(2007) Course ADM940. ABAP AS. Authorization Concept - SAP NetWeaver,
SAP AG. Schaad, A., J. Moffett, et al. (2001) The role-based access control
system ...
QUT Digital Repository: http://eprints.qut.edu.au/
Khan, Roheena Q. and Corney, Malcolm W. and Clark, Andrew J. and Mohay, George M. (2009) A role mining inspired approach to representing user behaviour in ERP systems. In: Proceedings of The 10th Asia Pacific Industrial Engineering and Management Systems Conference, 14-16 December 2009, Kitakyushu International Conference Center, Kitakyushu.
©
Copyright 2009 [please consult the authors]
APIEMS2009
Dec. 14-16, Kitakyushu
A Role Mining Inspired Approach to Representing User Behaviour in ERP Systems Roheena Khan†1, Malcolm Corney2, Andrew Clark3, George Mohay4 Information Security Institute Queensland University of Technology, Brisbane 4001, AUSTRALIA Email:
[email protected] [email protected] [email protected] [email protected]
Abstract. Despite all attempts to prevent fraud, it continues to be a major threat to industry and government. Traditionally, organizations have focused on fraud prevention rather than detection, to combat fraud. In this paper we present a role mining inspired approach to represent user behaviour in Enterprise Resource Planning (ERP) systems, primarily aimed at detecting opportunities to commit fraud or potentially suspicious activities. We have adapted an approach which uses set theory to create transaction profiles based on analysis of user activity records. Based on these transaction profiles, we propose a set of (1) anomaly types to detect potentially suspicious user behaviour and (2) scenarios to identify inadequate segregation of duties in an ERP environment. In addition, we present two algorithms to construct a directed acyclic graph to represent relationships between transaction profiles. Experiments were conducted using a real dataset obtained from a teaching environment and a demonstration dataset, both using SAP R/3, presently the most predominant ERP system. The results of this empirical research demonstrate the effectiveness of the proposed approach. Keywords: Fraud Detection, Role Mining, Anomaly Detection, Enterprise Resource Planning, Security, Policy inference, Audit trail analysis.
1. INTRODUCTION ERP systems are one of the most important IT developments to emerge in the 1990’s. More and more organizations are now adopting ERP systems, with most of the Fortune 1000 firms having installed ERP systems to run their businesses (Bingi, Sharma et al. 1999). An ERP system is a packaged software solution that aims to automate and integrate the core business processes of an organization. Whilst ERP systems provide numerous benefits to organizations, due to their nature they are vulnerable to many internal and external threats (Little and Best 2003). Since the advent of ERP systems, researchers have always focused on fraud prevention rather than fraud detection. Many recent publications have discussed fraud prevention approaches such as role-based access control, segregation of duties, encryption, username and passwords, etc in different systems (Musaji 2002; Little and Best 2003; O'Gara 2004). Although many organizations employ fraud prevention techniques, they only prevent simple kinds of ________________________________________ † : Corresponding Author
2541
fraud from occurring and are not enough on their own (Bolton and Hand 2002). Complex fraud schemes built over time, involving various applications, are difficult to prevent. Nevertheless only a few publications deal with fraud detection approaches in ERP systems (Albrecht, Albrecht et al. 2006; Best 2007). Another driver for better fraud detection particularly in ERP systems, is the shift towards service oriented architectures (SAP 2005). These architectures allow a higher degree of automation of business processes, which may lead to more cases of fraud as the number of human checks are reduced and the number of entry points into the system are increased (Clark, Mohay et al. 2005). Auditors and fraud examiners generally review audit logs to detect frauds in ERP systems, which is a labourintensive task requiring time, effort and resources (Wells 2005). They need to have a good understanding of the business, ERP software and its features in order to conduct effective audits. As audits are conducted periodically generally once every financial year, fraud is only detected towards the end of the year. According to the KPMG fraud
APIEMS2009
Dec. 14-16, Kitakyushu
survey (2006), the average time to detect fraud is 18 months. Automated fraud detection approaches provide a possibility of real time fraud detection which can be conducted continuously therefore identifying frauds as soon as they are perpetrated and reducing the overall financial losses and time to detect fraud. ERP systems typically have role based access control over which permissions a user is allowed to perform. In addition to this, security policies assist in the segregation of related duties to reduce the opportunities to commit fraud. Many researchers have discussed the use of role mining techniques to automatically determine roles from existing permissions assigned to users within an organization (Sandhu, Coyne et al. 1996; Kuhlmann, Shohat et al. 2003; Schlegelmilch and Steffens 2005; Vaidya, Atluri et al. 2006; Zhang, Ramamohanarao et al. 2007). Role mining is the process of defining roles and their associated permissions. The current work has been motivated by role mining techniques, adapted to identify transaction profiles and so detect suspicious activities or anomalies and violations in segregation of duties with respect to the activities actually performed by users. We have also proposed a graphical representation depicting the relationships between transaction profiles. The intention is to identify activity which may be indicative of financial fraud. The next section describes the related work in the field. The paper follows with a discussion of the proposed approach, using transaction profiles, in Section 3. An articulation of the proposed scenarios for identifying inadequate segregation of duties and anomaly types for detecting anomalous behavior are presented in Sections 3.1 and 3.2 respectively. Next, the generation and implementation of the directed acyclic graph, showing relationships between transaction profiles is described with the help of an example in Section 3.2.1. The experiments and a discussion of the results are presented in Section 4. The paper concludes with a brief discussion on the current work and future directions presented in Section 5.
2. RELATED WORK The motivation for this study stems from role mining approaches which generate roles from existing permissions assigned to users. We have adapted a role mining approach for generating transaction profiles from the user activities recorded in an ERP system. We have derived a set of anomaly types that flag potentially suspicious activities from these transaction profiles. We also detect scenarios that identify violations in proper segregation of duties from the transaction profiles, based on the principles presented in Little and Best (2003). The next subsections discuss the related work in the literature.
2542
2.1 Role Mining and Segregation of Duties Segregation of duty policies reduce the opportunities for fraud by ensuring that mutually exclusive roles must be invoked in order to complete a sensitive task (Kuhn 1997; Sandhu, Bhamidipati et al. 1999). If an individual has privileges to both authorize and execute transactions, it is possible for them to commit and cover fraud in their normal course of duties. Effective internal control structures require such privileges to be segregated at various levels within an organization. Weaknesses in segregation controls are common and often provide opportunities for fraud (KPMG 2008). Numerous guidelines and principles for the separation of duties have been proposed in the literature to prevent fraud (Srinidhi 1994; Haelst and Jansen 1997; Arens and Loebbecke 2000; Little and Best 2003). In an ERP system, where hundreds and thousands of users are performing activities, the only way to segregate duties is to assign roles and authorizations to users which would prevent them from performing incompatible combinations of transactions (Little and Best 2003). Role mining is the process of determining a set of roles that is complete and correct and to do so in an efficient manner (Coyne 1996). Synonyms of role mining include role engineering, role definition, role discovery, role finding and role characterization. Essentially there are two main approaches to role mining: (i) the top-down approach and (ii) the bottom-up approach. Some authors have also discussed a combination of the two approaches, called a hybrid approach (Schaad, Moffett et al. 2001). In the topdown approach, business processes are carefully examined to identify job functions and their associated roles. Topdown approaches are mainly adopted by small enterprises where there are no existing roles or permissions assigned to individuals (Martin, Dalia et al. 2003). Though the approach identifies groups of users who perform similar activities accurately, it is a costly, time consuming and tedious process to understand the semantics of the business processes especially in large organisations with millions of authorizations and thousands of users (Vaidya, Atluri et al. 2008). Detecting financial fraud is a labour-intensive task requiring time, effort and resources for internal and external auditors, and having to perform role mining using this approach would further extend the manual audit processes. On the other hand, the bottom-up approaches derive roles from existing permissions assigned to users, with minimal human intervention. Most studies in the literature have proposed bottom-up role mining techniques as they automate the process of role discovery and are therefore more cost effective (Zhang, Ramamohanarao et al. 2007). This approach is not likely to consider the business functions within an organization (Shin, Ahn et al. 2003). Schlegelmilch and Steffens (2005) present a bottom-
APIEMS2009
Dec. 14-16, Kitakyushu
up approach which uses hierarchical clustering to create a hierarchical tree of permissions and users which can be used to derive roles. Their algorithm first computes for each permission the number of users who have that permission and groups these users together in a cluster. In this initial step, each different permission is in its own cluster, meaning that each user may be a member of multiple clusters. Pairs of clusters are combined based on the maximal overlap of their user sets. Newly formed clusters contain the permissions of their child clusters and the set of users from the child clusters who have all permissions in this new cluster. The algorithm stops when no more clusters can be combined or when all permissions are combined into one root node. The algorithm does not derive roles, but a tree with users and permissions, although there is a discussion on manually deriving roles from the tree. Another bottom up approach, proposed by Vaidya et al. (2006) uses subset enumeration to derive roles from existing permissions. The algorithm intersects all possible combinations of permissions to derive roles. It starts by considering existing permissions assigned to users as roles, called initial roles. The intersections of these roles are then used to generate more roles, called generated roles. Further intersections of generated and initial roles are carried out until no new roles are generated (Vaidya, Atluri et al. 2006). Our implementation of this algorithm discovered that an enormous number of roles are generated and not surprisingly that some of these were not allocated to any users. We believe that this is impractical and time consuming for the auditor to detect anomalous activities. Compared to Vaidya et al. (2006) and Schlegelmilch and Steffens (2005) work, our approach is more similar to Schlegelmilch and Steffens (2005). In their study they have suggested roles that are derived from existing permissions assigned to users. While in our approach we use subsetsuperset relationships to derive transaction profiles from the activities actually performed by users.
2.2 Anomaly Detection and User Profiling Anomaly detection is a branch of intrusion detection. Typical anomaly detection systems profile the regular also called standard or normal behavior of a user, generally referred to as the training or profiling phase and any deviations from this standard behavior, known as the detection or use phase is indicated as a possible intrusion or anomaly (Lu 2006; Xu, Sung et al. 2007)). Once the deviations or anomalies are identified, the system generates an alert. Anomaly detection models are capable of adjusting their detectors to keep up with the changes in a user behavior to accurately detect suspicious behaviour (McCue 2006). They are also capable of detecting novel frauds.
2543
Denning (1987) developed an intrusion-detection model that gathered information from various audit logs/records which generated profiles for users. These profiles are then compared with normal user activity and anomaly records are generated for deviations found. Also, activity logs were maintained to track actions if particular conditions were met. They could also be used for updating profiles and generating reports (Denning 1987). Anomaly detection systems are generally accepted, but are expensive in terms of overhead, as they keep track of profiles and updates (Kruegel and Vigna 2003) and sometimes identify unusable but legitimate behavior as fraudulent, therefore generating a high rate of false alarms (Yang, Binxing et al. 2007).
3. THE APPROACH: USE OF TRANSACTION PROFILES In this section we discuss our three main contributions. We have adapted a role mining approach for deriving transaction profiles. We use the term, transaction profile, TP, to denote a set of distinct transaction types that one or more users have performed. A transaction profile may be associated with one or many users and each user is associated with exactly one transaction profile. Our work uses information recorded in security audit logs which record the transactions performed by the users of the system. ERP systems generally have role based control over which transactions a user is allowed to perform. Users are assigned one or many roles and they are allowed to perform any transactions in those roles, but different policies may mandate only one role at a time. Problems can occur when a user changes their job function or are promoted, meaning that they are assigned a new role or set of roles but their previous roles are not revoked (Schlegelmilch and Steffens 2005). This accumulation of roles cannot be avoided in some cases when an organization has only a small number of employees and these employees must take on many roles. Often in small organizations role segregation is difficult and users have more permissions than they require (Little and Best 2003). These situations can provide the opportunity for fraudulent activities when a user has access to roles that allow them to carry out all transactions required for those fraudulent activities. As an example, a user may have the necessary role permissions to create a vendor and to create orders and invoices for that vendor. Even though a user has access to all transactions in their assigned roles, they may not use all of them. Therefore, two users who have the same roles assigned in the system may have quite different transaction profiles based on the transactions that they actually use. In our work, we ignore roles and focus on the actual transactions that users perform as recorded in the ERP security audit logs.
APIEMS2009
Dec. 14-16, Kitakyushu
We now describe our approach to detecting transaction profiles which represent potential fraud situations; situations which represent inadequate segregation of duties or user activity which is anomalous.
3.1 Detecting Inadequate Segregation of Duties We aim to detect users whose transaction profile contains conflicting or incompatible transactions that violate the principles of segregation of duties. We implement and test our approach using the theoretical framework for separation of duties presented by Little and Best (2003). They propose the following set of seven principles for General Ledger (GL), Accounts Receivable (AR) and Accounts Payable (AP) applications of an ERP system: (i) Users who are given the authorizations to create and edit master records should not be able to enter transactions. (ii) Credit management activities and master record maintenance should be separate in AR. (iii) Credit management and dunning functions must be segregated from invoice and receipt data entry. (iv) Receipt data entry should be separate from credit memo and invoice data entry. (v) In AP, cheques and payments must be performed by someone who is not entering vendor invoices. (vi) Writing off AR as a bad debt must be segregated from receipt data entry. (vii) User activities between GL, AP and AR should not cross boundaries. We detect scenarios based on these principles to identify inadequate segregation of duties from transaction profiles discovered by processing the security audit log. The idea is to identify users whose transaction profiles have provided the opportunity to commit fraud.
3.2 Detecting Anomalous Activities We aim to detect users whose transaction profiles are anomalous when compared to other users, based on differences in transaction profiles discovered from processing the security audit log. We use the following types and notation: u : a user_id t : a transaction type tp : a user transaction profile – a set of transaction_types ug : the set of users associated with a particular tp UG : the set of all ug’s U : the user set - the set of all user_ids TP : the set of all unique tp’s Anomaly Type 1. The idea behind this anomaly type is to
2544
detect a small group of users who behave slightly differently to a large group of users by performing some small number of additional transaction types. The number of additional transaction types used to detect this anomaly type is set as a threshold value, ∆trans, e.g. three extra transaction types, and the difference in the number of users with the two transaction profiles is likewise set as some threshold, ∆users, e.g., the small group could be one-tenth of the number of users in the large group. The detection of transaction profiles of interest tpi can be expressed as follows: Find tpi ∈ TP, ∀ tpj ∈ TP | tpi ≠ tpj ∧ < |ugj|/∆users
tpj ⊆ tpi ∧
∧ |tpi| - |tpj| < ∆trans
|ugi| (1)
Anomaly Type 2. We aim to detect transaction profiles which have a large number of transactions that are being performed by a small number of users. For example: users may have accumulated many roles over the course of their employment in an organization. The number of users can be set with some threshold value, ∆users and the number of transactions can be set with another threshold value, ∆trans. These transaction profiles may represent the administrators of the system which would mean that the transaction profiles are not anomalous. The user threshold value could be set based on the known number of system administrators to reduce the number of false positives. This can be expressed as follows (note that the thresholds ∆users and ∆trans have a different significance here than in Anomaly type 1): Find tpi ∈ TP| |ugi| < ∆users
∧ |tpi| > ∆trans
(2)
Anomaly Type 3. A third type of anomaly detection is proposed which will detect transaction profiles which are completely separate from all other transaction profiles i.e. transaction profiles where none of the transaction types in the transaction profile can be found in any other transaction profile. Users having these transaction profiles could be interesting to locate, simply because they share no transaction types with other users. The number of users with such a transaction profile is expected to be low. Find tpi ∈ TP, ∀ tpk ∈ TP | tpi ≠ tpk ∧ tpi ∩ tpk = { }
(3)
Discussion. It may be noticed that detection of these anomaly types relies on set relations between transaction profiles. The transaction profiles of interest in Anomaly type 1 have a transaction set which is a slight superset of a transaction profile which is used by a large number of users. Anomaly type 2 may arise because the set of transactions in
APIEMS2009
Dec. 14-16, Kitakyushu
the transaction profile of interest is the superset of transaction sets of multiple other transaction profiles. Anomaly type 3 may occur when the transaction profile has a unique transaction set i.e. the transaction profile has no transaction supersets or subsets. We propose to use a directed acyclic graph of transaction profiles to represent the subset – superset relationships. Directed edges connect transaction profiles from a parent vertex to a child vertex where the transaction type set in the parent is a proper subset of those in the child. A graph built from transaction profiles may have multiple roots. These root vertices will be transaction profiles with unique transaction sets, probably with a small number of transactions. Internal and leaf vertices in the graph may have one or many parent vertices. There may be vertices in the graph which are not connected at all and these will relate to Anomaly type 3 above. When the graph has been built, it can be traversed to detect the anomaly types discussed above and flag possibly fraudulent transaction profiles and their users. We suggest that it is necessary to have security audit log data from a system for a long period of time in order to reduce the number of false positives that the anomaly types may generate.
3.2.1 Generating the Transaction Profile Graph Our approach uses set theory to profile user activities recorded in ERP security audit log files. Given a set of users and transaction types, in an ERP security log, our algorithm progresses in three phases as follows: (1) User-transaction mapping: We firstly traverse the ERP security audit log, to map users to a set of transaction types that they have performed. For each user, a user-totransaction type set mapping is generated. Algorithm 1. Transaction profile generation 1. TP ← {} 2. UG ← {} 3. for each ui ∈ U do 4. tpi ← get_tp(ui) 5. if tpi ∈ TP then 6. ugi ← get_ug(tpi) 7. ugi ← ugi ∪ ui 8. else 9. TP ← TP ∪ tpi 10. ugi ← {ui } 11. end if 12. end for (2) Transaction profile generation: We next generate a set, TP, of unique transaction profiles from the user-totransaction type set mappings, ui → tpi. Each distinct set of
2545
transaction types represents a transaction profile, tpi. Users who have the same transaction profile are grouped into a set ugi, associated with that transaction profile. We have a mapping from users to their transaction profiles: get_tp : u → tp and a mapping from transaction profiles to the set of users associated with that transaction profile: get_ug : tp → ug. The process of generating transaction profiles is presented in Algorithm 1. Algorithm 2. Deriving the transaction profile graph Require: TP from Algorithm 1 1. G = (V, E) 2. V ← {tpØ} 3. E ← { } 4. for x = 1 to max(|tpi|) do for each tpi ∈ TP| |tpi| = x 5. 6. for each tpg ∈ V 7. if tpg ⊆ tpi then 8. E ← E ∪ (tpg, tpi) 9. end if 10. end for 11. V ← V ∪ tpi 12. end for 13. end for 14. for x = max (|tpi|) to 1 do 15. for each tpi ∈ V| |tpi| = x 16. for each tpj ∈ V| tpi ⊆ tpj 17. for each tpg ∈ V| tpg ≠ tpi ∧ tpg ≠ tpj 18. if tpg ⊆ tpj ∧ tpg ⊆ tpi then 19. E ← E - (tpg, tpj) 20. end if end for 21. 22. end for 23. end for 24. end for (3) Deriving the transaction profile graph: A directed acyclic graph, G, is generated by this phase of the algorithm which has a set of directed edges, E, and a set of vertices, V, which represent the transaction profiles generated in Phase 2. A directed edge is connected from one transaction profile to another if the transaction set of the former is a proper subset of the transaction set of the latter. The final graph has a further restriction that a transaction profile will not have direct edges to a vertex which is a descendant of one of its children as these are redundant. The process of deriving the directed acyclic graph is presented in Algorithm 2. The graph is initialized with a special null transaction profile, tpØ, which has an empty transaction set (Steps 1 to 3 of Algorithm 2). This root vertex therefore acts as a
APIEMS2009
Dec. 14-16, Kitakyushu
parent for all transaction profile vertices that are added to the graph because it is a proper subset of all other transaction profiles and is present only for simplifying graph generation. This root vertex is ignored in all further calculations once the graph has been generated. The remainder of the transaction profiles are added to the graph in order of the cardinality of the transaction set, |tpi|, in the transaction profile. Each transaction profile is tested to determine if transaction profiles currently in the graph have transaction sets that are proper subsets of the current transaction profile’s transaction set. If the subset relationship is discovered, an edge from the parent transaction profile in the graph to the current child transaction profile is added to the set of edges (Steps 4 to 13 of Algorithm 2). Once a full pass of transaction profiles has been made, redundant edges as mentioned above are removed. This is done by starting at the leaves of the graph and moving back to the root vertex of the graph checking for such edges (Steps 14 to 24 of Algorithm 2). There are more efficient algorithms in the literature for determining subset enumeration (Haixun, Hao et al. 2006) but our approach runs in polynomial time, O(n3). An example. Suppose an ERP security audit log of an organization consists of six users (u1…u6) each of whom have executed a subset of five transactions (t1…t5) during a certain period of time. In Phase 1 of our approach, a userto-transaction type set mapping is generated for each user (see Table 1 below). Each distinct set of transaction types represent a transaction profile. It can be observed from Table 1 that users u1 and u4 perform the exact same set of transactions, meaning that they will belong to the same Table 1: User transaction mapping. U u1 u2 u3 u4 u5 u6
t1 0 0 0 0 1 0
t2 0 0 0 0 0 1
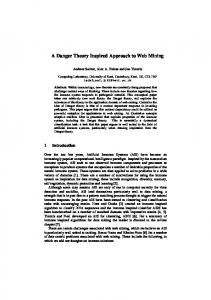
transaction profile. Table 2 shows the transaction profiles, tp and ug generated by Phase 2 of our approach. We then add transaction profiles as vertices in the graph based on the relationship between the sets of transaction types in the transaction profiles. As tp1 and tp2 have the lowest number of transaction types in this example, they become the root vertices (depicted in Figure 1). We then continue to work through the remaining transaction profiles. Transaction profile tp3 has transactions t3 and t4, making tp3 a child vertex of tp1 and tp2. (tp2 = {t4})
(tp5 = {t2, t5})
(tp3 = {t3, t4})
(tp1 = {t3})
(tp4= {t1, t3})
Figure 1: An example of a directed acyclic graph and an isolated vertex. As transaction profile tp5 does not have any transaction types that have subset-superset relationships with transaction types in other profiles, it is represented as an isolated vertex. The remainder of the vertex relationships can be seen in the final graph generated by our approach as shown in Figure 1.
4. EVALUATION This section describes the experiments conducted to validate the proposed approach. Two different datasets have been extracted from ERP systems to detect anomalies and inadequate segregation of duties. In the following subsections we describe the datasets, implementation and experimental results.
4.1 Dataset
T t3 1 0 1 1 1 0
t4 0 1 1 0 0 0
t5 0 0 0 0 0 1
Data from ERP systems, more specifically SAP R/3 systems were extracted for evaluating the approach. SAP R/3 is an integrated ERP system which offers modules for the various business functions in an organization. It has its own set of master records and configuration tables. Each user needs to enter a client number, a username and a password while logging on to the SAP system. After successfully logging in, each user accesses the same main menu for accounting, logistics, human resources as well as the security administration and configuration functions. User roles and authorizations restrict user access to individual functions (which are identified using transaction codes) (Best 2006). Typically a transaction code comprises four or more alphanumeric characters that uniquely identify an activity. For example the transaction code to create a vendor invoice is represented as FB60. A user can only log
Table 2: Transaction profiles and user sets. Transaction profiles
tp
tp1 tp2 tp3 tp4 tp5
{t3} {t4} {t3, t4} {t1, t3} {t2, t5}
ug {u1, u4} {u2} {u3} {u5} {u6}
2546
APIEMS2009
Dec. 14-16, Kitakyushu
Table 3: Extract from SAP R/3 security audit log. Date
Time
Cl.
User
Transaction code
Terminal
MNo
17.03.2008 17.03.2008 17.03.2008
11:54:32 11:54:32 11:54:32
600 600 600
233-063 233-063 233-002
EC01 EC01 FB50
fitgp-s623-206 fitgp-s623-206 fitgp-s527-017
AU3 AUW AU3
on if a user master record with a password for that user has been created in the system. The scope of activity of each user in the system is defined in the user master record by one or many roles. The user authorizations, roles, type and personal data such as the address are recorded in the user master record (SAP 2007). The security audit logs are stored in a binary format and can only be extracted using the reporting facility. Filters are used to define which events may be recorded in the logs. Information is only recorded in the audit files if the audit logs are turned on. An extract from the SAP R/3 security audit log is depicted in Table 3 above. It contains fields for the date and time of the user activity, client id, user id, transaction code, terminal name, message number and message text. The message number and message text fields of the log provide more details about the transaction performed. Some activities in the SAP system do not have specific transaction codes, such as logon, logoff and running RFC calls. These activities are represented by session_manager or no transaction code. These particular transaction codes on their own do not add any value to a transaction profile and therefore have been excluded from our experiments. Their inclusion to build richer transaction profiles with other information stored in system tables and/or the security audit logs, such as in (Best, Rikhardsson et al. 2009), is currently being studied and will be addressed in the future work, discussed in Section 5. Table 4 shows a summary of the datasets, excluding transactions session_manager or no transaction code and the users associated with only these two transaction types. Table 4: Summary of the experimental datasets.
N o 1 2
Datasets University dataset Demonstrat -ion dataset
Total records
Period of extraction
Total users
Total transa -ction types
60,988
12 months
202
584
304,126
6 days
39
183
The two different datasets that have been extracted from the SAP system for evaluating our approach are: (i) a dataset hosted by our university for teaching purposes and
2547
Text Transaction EC01 Started Report RSECOP01 Started Transaction FB50 Started
(ii) a demonstration or training dataset used for testing the different business functions within an organization. Dataset 1 consists of 60,988 records of real activities performed by administrators, instructors and students over a period of 12 months. Student activities are based on tutorial exercises conducted during two semesters. Amongst the 490 users in Dataset 1, only 202 users had transaction codes recorded against their names. These 202 users have executed 584 different types of transactions (shown in Table 4). On the other hand, Dataset 2 is a demonstration environment that is accessible to SAP customers from different organizations for learning and training on the SAP system. It consists of 304,126 records performed by 106 users. Only 39 users had transaction codes recorded against their names. Data was extracted over a period of 6 days in which users performed 183 different types of transactions. As Datasets 1 and 2 are extracted from a student and a demonstration dataset, any anomaly types or inadequate segregation of duties scenarios identified do not represent fraudulent behavior but demonstrate the effectiveness of the proposed approach.
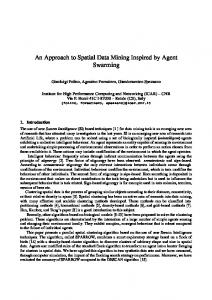
4.2 Implementation Algorithms 1 and 2 have been implemented in Java and the results of the experiments are stored in a MySQL database. Figure 2 describes the implementation process of the proposed approach. The security audit log and the user master records are exported to text files from the options available in the SAP R/3 system’s user interface. As all user activities are recorded in the security audit log, even when a user fails to logon to the system due to a mistyped username, the activity is recorded. A user can only log on successfully if a user master record for that particular user is present in the system. In the first step, the audit log file is filtered to exclude invalid user ids by checking if the user name exists in the user master record. Also to protect the
Figure 2: Implementation of the approach.
APIEMS2009
Dec. 14-16, Kitakyushu
confidentiality of the data, the username and the terminal id fields of the log are anonymized. The filtered and anonymized text file is then used as input for Algorithm 1. For each user in the text file, a user-to-transaction type set mapping is generated to create transaction profiles, which are required as input for Algorithm 2. Algorithm 2 then builds a directed acyclic graph based on the subset relationships between these transaction profiles. The parent-child vertex information from the directed acyclic graph is then stored into the database (depicted in Figure 2). Alerts or red flags are identified by running a set of SQL queries constructed for the various anomaly types and scenarios. The queries produce standard reports providing details of the red flags such as the transaction profiles, day and time of the activity, the anonymized users assigned to that transaction profile and the transaction codes executed.
4.3 Experimental Results Once the datasets have been filtered and anonymized the algorithms generate a collection of directed acyclic graphs which would assist an auditor to visualize the different groupings of transaction profiles in the dataset. Each visually disaggregated graph or grouping of transaction profiles contains related activities. In Dataset 1, the processing generated 9 disaggregated graphs with a total of 200 distinct transaction profiles. Table 5 shows the 9 disaggregated graphs or clusters, the depth of each graph and the number of transaction profiles and users in each graph. In order to give the reader an idea of the visual depth of each grouping or cluster of transaction profiles, we have included in Table 5 values for the number of levels in the graph. It can be observed that in Dataset 1 there are 4 graphs that have one or more levels and 5 graphs with no levels i.e. these 5 graphs consist of single vertices. As a user can only belong to one transaction profile, there is no overlap between users in different transaction profiles. It can be observed from Table 5, row one, that most users, that is 179 out of 202 in Dataset 1 belong to related transaction profiles. Also, all transaction profiles have one user each except two transaction profiles (in row one and two) which have two users each. Table 5: Groupings of disaggregated graphs in Dataset 1. Number of disaggregat -ed graphs 1 1 1 1 5
Depth of each graph (in levels) 4 1 1 1 0
Number of tp’s in graph 178 2 10 5 1
Number of users in graph 179 3 10 5 1
2548
In Dataset 2 the processing generated 4 disjoint graphs with a total of 39 distinct transaction profiles. Table 6 shows a summary of the number of transaction profiles and users in each disaggregated graph. It can be observed that each transaction profile has only one user. As this dataset has lesser users and transaction types compared to Dataset 1, there are small groupings of transaction profiles. In Table 6, row four, it can be observed that there are 23 transaction profiles that do not have any connecting edges and are relatively different from the transaction profiles present in other directed acyclic graphs in Dataset 2. Table 6: Groupings of disaggregated graphs in Dataset 2. Number of disaggregate -ed graphs 1 1 1 23
Depth of each graph (in levels) 1 1 3 0
Number of tp’s in graph 3 2 11 1
Number of users in graph 3 2 11 1
The next subsections discuss the anomaly types and inadequate segregation of duties scenarios detected from these transaction profiles.
4.3.1 Detecting Inadequate Segregation of Duties This section describes the results of the inadequate segregation of duties scenarios discussed in Section 3.1. The inadequate segregation of duties framework was presented by Little and Best (2003), but was not implemented or tested. We implement the seven principles as scenarios to detect transaction profiles that contain incompatible transactions and thus find the users who are assigned these transaction profiles. Table 7 shows the principle number, the exact number of matches found, the number of transaction profiles that contain incompatible transaction types and the number of users assigned to those transaction profiles in Dataset 1. Segregation violations are detected using SQL queries and reports are generated for any matches found. Principle 1 was split into (a), (b) and (c) for separation of data entry and master records for GL, AP and AR respectively. For Dataset 1, Table 7 shows that for principle 1(a) two transaction profiles, with one user each, have privileges to enter and post GL transactions, and create, change and delete GL master records in the system. It can be observed that the processing found most matches (69 in total) for scenario 7 which is segregation of transaction types across the GL, AP and AR activities. The separation of duties in scenario 7 is necessary to provide a check against AR and AP through GL control accounts and to
APIEMS2009
Dec. 14-16, Kitakyushu
properly authorize the offsetting transactions between AR and AP. 11 users in the dataset can perform transactions in all three functions. Principles 1 (b), 2, 3 and 6 are not present in Table 7 as no students have preformed the incompatible set of transaction types present in these scenarios. Table 7: Results of detecting inadequate segregation of duties in Dataset 1 Principle number 1(a) 1(c) 4 5 7
Number of matches 3 30 12 1 69
Number of transaction profiles 2 15 6 1 11
threshold value the higher the number of alerts. No further alerts are generated if the transaction threshold value is greater than 55 (shown in the last row of Table 8). This implies that the maximum difference in number of transaction types between two transaction profiles is less than or equal to 55 (more details presented in Table 9). Our results for Anomaly type 1 are restricted as Dataset 1 has only one user in each transaction profile, except two transaction profiles which have two users each. Table 8: Results for different transaction threshold values of Anomaly type 1 in Dataset 1.
Number of users 2 15 6 1 11
The scenarios focus on detecting potentially fraudulent activities within the financial module of the SAP system and therefore the transaction types included in the scenarios are all related to financial activities such as changing bank details, creating invoices and making payments. The queries did not find any transaction profile which contains conflicting or incompatible transaction types that violate the principles of segregation of duties in Dataset 2. This has been verified by manually checking the types of transactions present in the dataset. Most users in Dataset 2 have conducted activities related to the sales and manufacturing module.
4.3.2 Detecting Anomalies In this section, we discuss the results of the three anomaly types described in Section 3.2. The user and transaction threshold values for the anomaly types depend on a number of factors such as the size of the organization, the size of the dataset and the period for which the data has been extracted. Anomaly type 1 aims to detect a small group of users who have performed some additional transaction types compared to a large group of users. To see the effects of the variable transaction threshold values, we analyze the results by keeping the user threshold value steady. Table 8 shows the number of alerts generated for Anomaly type 1 in Dataset 1, for 6 different transaction threshold values and a steady user threshold value of 1. If the user threshold value is set to a value higher than 1, no alerts are generated because all 202 transaction profiles are assigned to one user each, except two transaction profiles which include two users. The queries generate different number of alerts based on the transaction threshold value. It can be observed that the higher the
2549
Transaction threshold value 5 15 25 35 45 55
User threshold value 1 1 1 1 1 1
Number of alerts 2 5 11 20 27 30
Table 9 presents a sample of the results (i.e. 4 out of 30 alerts) when the transaction threshold value is set to 55. It shows the number of users and the transaction types in the parent and child vertex. The four transaction profiles or child vertices shown in Table 9 have the same transaction profile as their parent vertex. It might be interesting for an auditor to investigate why the users in the child vertices have performed many more transactions than the users in parent vertex. The 4 alerts presented in Table 9 are the extremes, the other 26 alerts generated from the processing are interesting too but the difference in the cardinality of the transaction profiles is lesser i.e. between 8 and 40 transaction types. As this anomaly type depends on the number of users in each transaction profile, for Dataset 2, no alerts were generated as each of the 39 transaction profiles has one user assigned to them. Table 9: A sample of results for Anomaly type 1 in Dataset 1 if the transaction threshold value is set to 55. No. of users assigned to parent vertex 2 2 2 2
No. of transaction types in parent vertex 4 4 4 4
No. of users assigned to child vertex 1 1 1 1
No. of transacti on types in child vertex 57 54 55 50
APIEMS2009
Dec. 14-16, Kitakyushu
Anomaly type 2 aims to detect transaction profiles which have a large number of transactions that are assigned to a very small number of users. Table 10 shows the number of alerts generated for the different transaction threshold values for a steady user threshold value. For Dataset 1, the user threshold value was set to a value of 2 or less as each transaction profile consists of one or two users. Table 10: Results for different transaction threshold values of Anomaly type 2 in Dataset 1. Transaction threshold value 180 160 140 120 100
User threshold value 2 2 2 2 2
Number of alerts 1 1 2 2 2
When the transaction threshold value was set to 100, 120 or 140, the processing generated the same two alerts, which include: (1) one user who has performed 194 transaction types and (2) a user who has performed 142 transaction types (shown in Table 10). When the transaction threshold value was set to a higher value, i.e. 160 or 180, the processing flagged the transaction profile with one user who has performed 194 transaction types. These alerts indicate potentially fraudulent user behavior and have been successfully identified by the anomaly definition. After manual analysis of the dataset, we found that both these transaction profiles with 194 and 142 transaction types are assigned to an instructor and a system administrator at our university. Table 11: Results of Anomaly type 2 in Dataset 2 with a fixed user threshold value. Transaction threshold value 20 30 40
User threshold value 1 1 1
Number of alerts 4 1 1
who has performed 48 different transaction types. This user might be an administrator or an instructor who may have tested all the training activities before the trainees performed them. Table 12: Results of Anomaly type 3 in Dataset 1 and 2
Dataset
Number of isolated vertices
Dataset 1 Dataset 2
5 23
Lowest number of transactions/ profile 2 1
Highest number of transactions/ profile 37 25
Anomaly type 3 detects cases where the set of transaction types in the profile are not present in any other transaction profile. Table 12 shows the number of isolated vertices (i.e. the transaction profiles that do not have any edges connecting them) and the highest and lowest number of transaction types in a transaction profile, for both Datasets 1 and 2. It can be observed from Table 12 that in Dataset 1, the cardinality of transaction types for the 5 isolated vertices is between 2 and 37. For an auditor, it is interesting to investigate a user who has performed 37 different transaction types which no other user in the system has performed. Similarly, in Dataset 2 the highest number of transaction types in a profile is 25 and these are not performed by any other user in the system. For both datasets, the lowest number of transaction types in a profile is values of 1 or 2. It might be interesting for an auditor to investigate these users as they have only executed one or two transaction types in the system during the period for which the data has been extracted. These users might be valid users who have left the organization, been on leave or perhaps changed their user id in the system. Or they might be synthetic user ids created by valid users to perform fraudulent activities.
5. CONCLUSION AND FUTURE WORK
In Dataset 2, the user threshold value was set to a steady value of 1 as all transaction profiles have one user each. As Dataset 2 (see Table 11 for results) has less users and transaction types when compared with Dataset 1, if the transaction threshold value was set to a value higher than 40, no alerts were generated. The query generated the same alert when the transaction threshold value was set to 30 or 40. This alert may represent an anomaly as no users have performed more than 27 transaction types, except one user
2550
In this paper we have presented three main contributions: (1) we have adapted a role mining approach for generating transaction profiles from the user activities recorded in the security log of an ERP system, and for identifying subset relationships amongst such transaction profiles, (2) we have postulated a number of anomalous, possibly fraudulent, activity scenarios which can be detected using the transaction profiles, and we have identified such anomalies in our non-synthetic datasets, and (3) we have implemented scenarios that identify violations in proper segregation of duties and have detected such violations using the transaction profiles generated in (1).
APIEMS2009
Dec. 14-16, Kitakyushu
Our future work will focus on the detailed analysis of transactions involving session_manager and transactions where no transaction code is listed. This may in fact be a rich source of further information as it provides – in the case of the SAP software – detailed text message information qualifying the transaction in some fashion. The further step we intend is to incorporate frequency analysis into the anomaly detection. At the moment, our transaction profiles are based on transaction types only without regard for the number of times a particular type of transaction has been executed. This will naturally affect both the nature of transaction profiles and also the processing involved. It will provide the benefit of being able to detect much more subtle difference – possibly anomalies – amongst users.
ACKNOWLEDGMENT We gratefully acknowledge the support of SAP and the contributions of our following colleagues from SAP Research, past and present, at various stages of the work described in this paper: Julien Vayssiere, Sarath Indrakanti, Shane Bracher, and Tobias Raub. The research is supported in part by an ARC Linkage grant.
REFERENCES Albrecht, W. S., C. O. Albrecht, et al. (2006) Fraud Examination, Thomson, Mason. Arens, A. A. and J. K. Loebbecke (2000) Auditing: An Integrated Approach, Prentice-Hall, Upper Saddle River, N.J. Best, P. J. (2007) Week 4 - computer assisted auditing techniques. AYN413 Enterprise Systems Governance and Audit, Faculty of Business, Queensland University of Technology. Best, P. J., P. Rikhardsson, et al. (2009) Continuous fraud detection in enterprise systems through audit trail analysis, The Journal of Digital Forensics, Security and Law, 4, 21. Bingi, P., M. K. Sharma, et al. (1999) Critical issues affecting an ERP implementation, Information Systems Management, 16, 7. Bolton, R. and D. Hand (2002) Statistical fraud detection: a review, Statistical Science, 17, 235-249. Clark, A., G. Mohay, et al. (2005) Project description. ARC Research Grant Report, Information Security Institute, Queensland University of Technology. Coyne, E. J. (1996) Role-engineering. Proceedings of the 1st ACM Workshop on Role-based Access Control, USA. Denning, D. E. (1987) An intrusion-detection model, IEEE Transactions on Software Engineering, 13, 222-232.
2551
Haelst, W. and K. Jansen (1997) Control and audit of SAP R/3 logical access security, Information Systems Audit and Control Journal, 3, 37-44. Haixun, W., H. Hao, et al. (2006) Dual labeling: answering graph reachability queries in constant time. Proceedings of the 22nd International Conference on Data Engineering, Atlanta. KPMG. (2008) KPMG 2008 fraud survey. www.kpmg.com.au. Access date: 06.06.2009 at 11.00. Kruegel, C. and G. Vigna (2003) Anomaly detection of web-based attacks. Proceedings of the 10th ACM Conference on Computer and Communications Security, USA. Kuhlmann, M., D. Shohat, et al. (2003) Role mining revealing business roles for security administration using data mining technology. Proceedings of the 8th ACM Symposium on Access Control Models and technologies, Como, Italy. Kuhn, D. R. (1997) Mutual exclusion of roles as a means of implementing separation of duty in role-based access control systems. Proceedings of the 2nd ACM workshop on Role Based Access Control, Fairfax, VA, USA, 23-30. Little, A. G. and P. J. Best (2003) A framework for separation of duties in an SAP R/3 environment, Managerial Auditing Journal, 18, 419-430. Lu, F., Boritz, J. E. and Covvey, D. (2006) Adaptive fraud detection using Benford's law. 19th Conference of the Canadian Society for Computational Studies of Intelligence, Canada. Martin, K., S. Dalia, et al. (2003) Role mining revealing business roles for security administration using data mining technology. Proceedings of the 8th ACM symposium on Access control models and technologies, Como, Italy. McCue, C. (2006) Data Mining and Predictive Analysis : Intelligence Gathering and Crime Analysis, Butterworth-Heinemann, Boston. Musaji, Y. F. (2002) Integrated Auditing of ERP Systems, John Wiley and Sons, New York. O'Gara, J. D. (2004) Corporate Fraud : Case Studies in Detection and Prevention, John Wiley and Sons, New Jersy. Sandhu, R., V. Bhamidipati, et al. (1999) The ARBAC97 model for role-based administration of roles, ACM Transactions on Information and System Security, 2, 105-135. Sandhu, R. S., E. J. Coyne, et al. (1996) Role-based access control models, Computer, 29, 38-47. SAP. (2005) Service oriented architectures become reality for SAP customers. http://www.sap.com/about/news room/press.epx?PressID=4973. Access date: 02.05.2009 at 08.00.
APIEMS2009
Dec. 14-16, Kitakyushu
SAP. (2007) Course ADM940. ABAP AS Authorization Concept - SAP NetWeaver, SAP AG. Schaad, A., J. Moffett, et al. (2001) The role-based access control system of a European bank: a case study and discussion. Proceedings of the 6th ACM Symposium on Access Control Models and Technologies, Virginia, USA. Schlegelmilch, J. and U. Steffens (2005) Role mining with ORCA. Proceedings of the 10th ACM Symposium on Access Control Models and Technologies, Stockholm, Sweden. Shin, D., G.-J. Ahn, et al. (2003) On modeling systemcentric information for role engineering. Proceedings of the 8th ACM Symposium on Access Control Models and Technologies, Como, Italy. Srinidhi, B. (1994) The influence of segregation of duties on internal control judgments, Journal of Accounting, Auditing and Finance, 9, 423-444. Vaidya, J., V. Atluri, et al. (2008) Migrating to optimal RBAC with minimal perturbation. Proceedings of the 13th ACM Symposium on Access Control Models and Technologies, Estes Park, USA. Vaidya, J., V. Atluri, et al. (2006) RoleMiner: mining roles using subset enumeration. Proceedings of the 13th ACM Conference on Computer and Communications Security, Virginia, USA. Wells, J. T. (2005) Principles of Fraud Examination, John Wiley, New Jersey. Xu, J., A. H. Sung, et al. (2007) Behaviour mining for fraud detection, Journal of Research and Practice in Information Technology, 39, 3-18. Yang, L., F. Binxing, et al. (2007) Network anomaly detection based on TCM-KNN algorithm. Proceedings of the 2nd ACM Symposium on Information, Computer and Communications Security, Singapore. Zhang, D., K. Ramamohanarao, et al. (2007) Role engineering using graph optimization. Proceedings of the 12th ACM Symposium on Access Control Models and Technologies, Sophia Antipolis, France.
AUTHOR BIOGRAPHIES Roheena Khan is a doctoral candidate in the Information Security Institute at the Queensland University of Technology (QUT), Brisbane, Australia. Her areas of research are fraud detection and intrusion detection in ERP systems. She has also been a Lecturer in the School of Information Technology, Faculty of Science and Technology at QUT in 2008. She graduated BIT (QUT) in 2002 and MIT (QUT) in 2004 and is a member of the ACM. Malcolm Corney is a doctoral candidate in the Information Security Institute at the Queensland University of
2552
Technology and is also a Lecturer in the School of Information Technology, Faculty of Science and technology at the Queensland University of Technology, Brisbane, Australia. His current research interests are in the areas of insider misuse detection and computer forensics. He graduated BAppSc (QUT) in 1981 and Master of IT (QUT) in 2003 and is a member of the ACM. Andrew Clark is an Associate Professor in the School of Information Technology at Queensland University of Technology (QUT). He is also a Deputy Director of QUT's Information Security Institute where he leads a team of researchers investigating various aspects of network security and computer forensics. His current research interests lie in the fields of intrusion detection, fraud detection and network forensics. He is the author of over 70 academic publications covering various aspects of information security and is currently supervising numerous postgraduate research students in related areas. George Mohay is an Adjunct Professor in the Information Security Institute at the Queensland University of Technology, Brisbane, Australia. Prior to this he was Head of the School of Computing Science and Software Engineering from 1992 to 2002. His current research interests lie in the areas of computer security, intrusion detection, and computer forensics. He has worked as a visiting researcher while on sabbatical leave at Stanford University in 1981, Loughborough University in 1986, Bristol University in 1990 and the Australian National University in 2000. He graduated BSc(Hons) (UWA) in 1966 and PhD (Monash) in 1970, and is a member of the ACM and of the IEEE Computer Society. He supervises PhD and Masters students in the above areas and is involved as chief investigator in a number of related funded research projects. His publications include the book Computer and Intrusion Forensics. He is a program committee member for a number of international conferences.