Jul 24, 2008 - Thus results ranking is crucial to the success of a search engine.â[1]. Current commercial search engines (such as Google) tend to return to the ...
A Coherent Measurement of Web Search Relevance
William Mahoney Peter Hospodka William Sousan Ryan Nickell Qiuming Zhu
Department of Computer Science University of Nebraska at Omaha
Technical Report No. cst-2008-2 http://cs.unomaha.edu/trpt/2008/cst-2008-2.pdf
July 24, 2008
Copyright © 2008, by the author(s). All rights reserved. Permission to make digital or hard copies of all or part of this work for personal or classroom use is granted without fee provided that copies are not made or distributed for profit or commercial advantage and that copies bear this notice and the full citation on the first page. To copy otherwise, to republish, to post on servers or to redistribute to lists, requires prior specific permission.
A Coherent Measure ment of Web Search Relevance By William Mahoney, Peter Hospodka, William Sousan, Ryan Nickell, and Qiuming Zhu The KEWI1 Research Group Department of Computer Science College of Information Science and technology Peter Kiewit Institute of Information Science, Technology and Engineering University of Nebraska at Omaha Omaha, NE 68182
Thursday, July 24, 2008
1
KEWI – Knowledge Engineering and Web Intelligence
A Coherent Measurement of Web Search Relevance Abstract We present a metric for quantitatively assessing the quality of Web searches. The Relevance of Searching on Target (RoSoT) index measures how relevant a search result is with respect to the searcher's interest and intention. The index is established on the basis of the cognitive characteristics of common users in terms of their behavior and preference in the on-line Web browsing processes. We evaluated the accuracy of the index function with respect to a number of surveys conducted on several groups of our college students. The index can be used primarily to compare the Web search results and determine which one is more relevant. It can be extended to evaluate the expressiveness of the search queries and the effectiveness of the result filtering processes, as well as various other factors and techniques people apply to improve the Web search quality.
1 Introduction When studying methods and techniques for improving Web based search performance, people often question how to quantitatively assess the amount of improvement the new technique brings. It is useful to have a methodology for the measurement of the search results. Naturally a portion of this measurement could be subjective. For example, if you ask a typical Internet user which search engine they prefer, you usually receive a very definite answer. The follow-up question, regarding why the user prefers one search portal over another, however, is often difficult for the user to verbalize. How does one measure and assess the search process in terms of the quality of the search? Some common factors are: • •
Efficiency and effectiveness – which measures the quality of a search engine according to how much effort the user must spend on searching in order to locate the desired information, and how many times the user has to type/re-type and revise/refine the search terms, and Relevance – which measures the quality of a search result according to the percentage of entries in the returned list that are desired, and how the entries are ordered/ranked in the returned list from the user’s point of view.
The search relevance is an intriguing issue in Web information service. It is well known that search results on the Web have a high duplicate rate in terms of data sources in certain domains or specific areas. For example, the national and international news coverage is often duplicated by various sites mirroring the major news carriers. Due to the vast amounts of information on almost all topics, one cannot systematically review the entire set of results; therefore the user must rely on the ordering of the results. It is often the case that when the first several results are not relevant to what the user desires, then the user would prefer to refine the search terms and try again, rather then scrolling down the list to find the useful one; users feel that this just wastes time. Users thus often perform frequent re-search and re-retrieval based on the current results in order to narrow down the outcome. This paper presents an investigation of measurement metrics which can be used for assessing and evaluating the relevance of the search results. With the use of these metrics Web users might more easily measure their search performance. The study is based on the findings that the relevance quality (or improvement) of a search can be evaluated according to the following factors:
1
•
• • •
The number of times the user has to revise / re-type his/her query to get desired (target) information – assuming the information is available somewhere. Finding relevant information from the Web is often an iterative process. However, it is not in user’s best interest to repeatedly try different words and have to think about what different combinations of these keywords might yield the best information. How easily the user can find the desired entry from the list of entries returned by the search process – desired/target entries should appear at the top of the result list, with the most relevant preferably the topmost result. How many relevant entries are shown on the first page of the search results; users tend to not want to advance to the next page of results as it is time consuming. How many entries the user has to browse through in order to find desired sites from the list.
The problem of search relevance touches upon the aspect of how a Web search process (through a search engine, a search query, or a function/feature applied in the search process) alleviates the information overloading problem (not too many irrelevant information presented and displayed) and returns the information the user needed or intended to retrieve. The outcome of our investigation is not intended to be another search engine evaluation methodology. We show in section four of this paper that others are working on this problem. Rather, we want to explore a way that can be used to assist the users in improving their Web searching effectiveness, such as determining how search terms can be better expressed so as to generate a better result (more accurately defined), how query processing can be improved (e.g. “quick” versus “advanced” search), and how differences in the search terms can be utilized to affect the desired retrieval results. Our objective is to quantify the quality, in terms of efficiency and effectiveness, of Web search based information retrieval. This in turn will be useful for exploring means whereby searching can automatically expand the query expression to place proper annotations on the query and the target document or information source, such as to insert more semantic constraints to the query, to semantically analyze and tag the information resources, etc. That is, the outcomes of this study can be applied, with respect to the techniques and approaches, to: • • • •
Improve the search efficiency by reducing the number of tries (re-query and revising queries) that a user needs to use in order to retrieve pertinent information from Web. Reduce the complexity of queries the user has to configure to get the information he/she needs. Improve the search effectiveness by reducing the complexity of query construction, such that a simple query will cover a range of relevant terms and retrie ve/return a sophisticated set of relevant information entries, i.e., improving the chances of hitting desired information from each search. Improve the quality of search result presentation by ordering the return entries in terms of (a) relevance to query according to the query semantics and information/document tagging, and (b) clusters of result entries. The most relevant (or user intended) entries of search result should be presented on the top of list and most visible to the user.
We assume that the following are true in the study presented in this paper: • •
When assessing the search quality, we assume that the data resources (Web) are not intentionally smeared/corrupted or skewed/distorted. The effectiveness and efficiency of a Web search is determined by how much relevant/useful information a user obtains among the number of returns the user checks – not on how many links the search process returns, nor on the percentage of relevant information out of the total information the process returns.
Section two of this paper details more of the motivation behind the need for these measurement tools, and describes the aim of our research. Section three covers several items – the development of our index function, a user survey which we conducted in order to obtain raw data, and the results of applying the function to the
2
survey data. Other researchers have provided extensive background research in measurement metrics, and this is outlined in section four. One set of measurements in particular is described and we demonstrate in comparison that our metric is dissimilar and serves a different purpose. Our conclusions are given in section five. An appendix to the document contains a sample of our user survey.
2 Background, motivation, and the focus 2.1 Background and motivations As it was pointed out by Bar-Ilan et. al, “Searching is a major activity on the Web, and the major search engines are the most frequently used tools for accessing information. Because of the vast amounts of information, the number of results for most queries is usually in the thousands, sometimes even in the millions. On the other hand, user studies have shown that users browse through the first few results only. Thus results ranking is crucial to the success of a search engine.”[1]. Current commercial search engines (such as Google) tend to return to the top of the list the entries that have been visited by more Web users, along wit h some other attributes of the data resources (Web pages) [4]. This strategy does not necessary guarantee the retrieval of data the user intended, especially when searching for data sources and documents with semantic concerns (such as scientific and professional articles). Overall, the following scenario has been observed: • •
Search engines have the potential to inadvertently narrow the user’s search to an area other than the one of interest, simply because the correct keywords were not utilized in the search process. The use of keywords can be ambiguous. One or more keywords, even when combined, may have more than one meaning. One way to deal with this ambiguity is to search by meaning (semantics), rather than by keyword.
Instead of just entering keywords, which may be ambiguous, the users may need to have a means to somehow specify the context or concept in which their interest lies. That is, potential ways of improving searches include allow ing the user to specify more precisely the context, concept, or idea that s/he is searching for, and narrow the search results more accurately to what the user originally desired. For example, the word “tank” has a vastly different meaning to an army general than a cattle rancher. Enabling the search engine to understand terms in the proper context should yield improved results for the user’s queries. Certain Internet companies already rely on a form of this context sensitive searching [11]. Techniques to consider include indexing methods, ontology methods, collaborative tagging, theme detection, recommender systems, knowledge structures, use of tailored agents, extraction methods, clustering methods, standards, etc. Thus, the following two tasks are necessary in order to measure whether these improvements will work and yield better search results: • •
We need measures and metrics for search result quality assessment and evaluation. We need to conduct experiments and tests by applying these measures to carefully selected queries, and then monitor the results.
According to our study, the most popular assessment approaches include relevance of the results – based on human judgment, randomly selecting “pseudo-relevant” informatio n – not based on human judgment, and relevance in terms of known information contents and targets. Instead there is a need to rely on the use of benchmarks and standard testing resources.
3
2.2 The Focus It is known that whether a returned result is a match to the query is obviously a subjective matter. However, in order to gauge the effectiveness of new search methodologies, one must have some means whereby the subjective relevance given by an individual can be translated into an overall “search quality” result, in order to determine whether different evaluation methods are truly effective. The measurement index function which we are looking for thus should be • • • •
Independent of the search engines used. Simple to calculate in an “online” manner. Generate an appropriate overall value based upon individual result rankings. Assign appropriate weights, where top listed correct results are valued highly.
The creation of this index function is then the main task of this research, and the rationale is presented in the following sections. It has been difficult in the past to judge the efficiency of information retrieval and the effectiveness of Web searching. For example, if Al found that search result number one and three were interesting for one query, is this more or less successful than Betty finding all of entries two, five, and six relevant? Currently existing measurement techniques mentioned above do not address this question. Many aspects need to be considered when evaluating the efficiency and effectiveness of a search engine or a search process. These include the elapsed time required to execute the search, the correct usage of the keywords in queries, the accurate selection of retrieved information that is useful to the user, and so on. We do not consider the search time in our measurements, although we do note that the response time should be reasonable and stable as pointed by studie s in human computer interaction [6]. The criteria that are of greater concern to us are namely how many of the total hits were rele vant, how to define a hit, how to make an objective measurement, and how many were faulty results. The raw quantity of results returned by the search process should not be considered. Further items to consider include whether the search missed any target information – some data that should be found and returned by the searching but was not returned. This is difficult to judge unless you know the data sources in advance and that the query is correct. But as we mentioned, the usefulness of a returned entry is a subjective matter. With the same search query and the some search returns, user Al may find more useful entries than Betty. An entry that is useful to Al may be of no use to user Betty, and vice versa. Thus we need to collect numeric counts from many users over a period of time, and form a statistical measurement to judge the effectiveness of a search process. An additional factor to consider in terms of search efficiency is how to present the data to the user so that s/he can quickly locate the information desired, in order to prevent information overloading. If the users can retrieve the desired information rapidly, from the first few returned results for example, then the search was more efficient. If the correct result is in fact located by the search engine, but is presented far down within the list of results, then the user still must examine many results within the list to determine whether the desired data is present. This requires them to examine a link and skip the many results which are irrelevant. The search in this case is inefficient if there are no desired results, but is also inefficient even if the results are eventually located. Initially one can consider the quantity of results returned to the user and the (potentially much smaller) quantity of results which were useful. Consider: If a user is looking for a specific article dealing with a certain topic, how many articles does the user have to browse through from the returned set, before locating the correct or a pertinent article? Alternatively, if the user is looking for a particular Web site, or a kind of Web
4
site, how many useful Web links were retrieved relative to the total number presented by the search? The need for a coherent index of search quality (relevance) measurement is also evidenced by the fact that increasingly diverse information sources are used, and this causes the search results to be more deluged and overwhelming. While the quality and capabilities of search engines are improving over time, by, for example, learning from the user’s past behavior, the effectiveness of these improvements becomes harder and harder to judge if without a quantitative measurement. As the search engines focus more on what the user needs, it is important to have an effective means to measure and assess the quality of these improvements, overall or individually. Such measurement and evaluation, as our coherent index serves, will also provide meaningful hint and guidance for further efforts.
3 A Coherent index for relevance of searching on target (RoSoT) In order to evaluate potential index functions for the measurement of Relevance of Searching on Target (RoSoT), it is necessary to start with research in the form of surveys in order to gather user data. Secondly it is necessary to propose several potential RoSoT index functions. Thirdly we need to determine which, if any of the index functions is appropriate. The latter is accomplished by evaluating the functions relative to the initial data collected from the user surveys.
3.1 Data collection To establish a proper RoSoT measurement indexing function, we first surveyed students at our campus, simply because this data is easier for us to obtain. A copy of the survey form is shown in the appendix to this paper. The survey asked the students to first select a search term which was something that they were familiar with but had not looked up on the Web prior to taking the survey. Suggestions included solar power for homes, the birth date of certain celebrities, and so on. They were then asked to rank each of the search results on a scale from 1 through 5, according to the following scale: 1. 2. 3. 4. 5.
The link was broken, or had nothing to do with the search terms. The search terms were included in the page, but it was not something that really pertained to the search. It pertained to the search, but was not that interesting relative to what I was looking for. It is interesting and for the most part seems to match the search terms. It is exactly what I was searching for.
Duplicate entries were marked on the form, and in the process of data entry we discounted these to a result of 1; effectively they are thus counted as if they were not relevant. Students were also asked to make sure that they addressed the “overall” rank at the top of the page. This represents an indication of the relevance quality of the search, again with 5 as the highest and 1 as the lowest: 1 = The search yielded no URLs that matched. 2 = The search yielded a few that matched, but I had to hunt for them. 3 = This was a pretty “average” search result. 4 = The search returned mostly what I wanted; many pages were relevant. 5 = The search returned what I wanted. The experiment is thus to take the individual result rankings and attempt to use our function to predict the overall quality ranking selected by the survey participant. In this way, in the future, simply ranking the individual results can be utilized to judge whether one search session is better (i.e, returning more relevant entries) than another.
5
We were also careful to separate the survey users into groups, in order to check whether there were variances between groups. For example, we attempted to determine the following thoughts: • • • •
Do Ph.D. students have higher (or lower) expectations than others? Do undergraduate students have higher (or lower) expectations than others? Is there a difference between entry-level university students versus juniors and seniors? Do these results match “others” outside of the above groups?
Our hope is that our index function accurately represents results “across the board” in all groups. However this may or may not be the case, and any variance within user communities would need to be accounted for.
3.2 Selection of a uniform index function for RoSoT Once the survey results were collected our research focused on the definition of a function which matched this sample data as closely as possible. A set of numeric functions were selected initially for calculating the qualitative relevance of the Web searches. As noted, previous research on search engine evaluation relies on comparisons – comparing how the same entries appear at different places of different search processes. There is no metric or uniform index given for each search result, independent of other search attempts. We hope that by using a “uniform index function”, we can give a quantitative evaluation for each search process and the returned result, not based on comparisons, but simply based on the entries returned and their relevance to user interest. Since the index function we look for measures the Relevance of Searching on Target (RoSoT), we call it the RoSoT index. Specifically the RoSoT index is intended to: • • •
Place descriptive values in terms of the order of the entries in the returned list, Distinguish totally relevant or partially relevant entries, and Distinguish duplicate entries.
The first of these rules we consider to be the heart of the matter – that a search that a user deems successful involves no need to modify the search terms, and yields a result at or very close to the top of the results. We desire a function to place high values on entries at the top of the list for the search results. Let N be the number of entries evaluated on the search results. This N is the major parameter to our uniform index function. We noticed that an index function with a relatively slow decreasing order (for example, a linear function with a negative slope), is not preferred because it does not match well with user’s cognitive characteristics seen from our survey data. Thus our initial study focused on the following three functions: (1) X(N) = 1/N, (2) X(N) = 1/N1/2 , and (3) X(N) = X(N-1)*D; X(1)=1.0, with constant D < 1.0. These index functions are parameterized such that multiple relevant entries far down in the search results can be valued higher than an initial correct single entry. This implies that searches with a high number of returned results would have an advantage over searches with fewer entries, even if the latter is more accurate. However, an index function with a too rapidly decreasing order (e.g., X(N) = X(N-1)*D, with and D ≤ 0.5), is not preferred because it applies too much of a penalty on entries farther down in the results list. To better determine which index function fits more properly with the user cognitive characteristics in terms of the survey results, we desire to resolve a set of criteria first, instead of repetitively trying different functions. Among the criteria for assessing the index function, we considered the following:
6
(1) X(N) = X(N+1) > 0.0 This is a quality consideration - a matching entry N should always be rated higher than the next result. (2) X(N) < X(N+1) + X(N+2) This is a quantity consideration - two subsequent matching results together should have a higher value that a single matching entry right ahead. (3) X(N) = X(N+2) + X(N+3) This is a position consideration – a matching entry N should be rated higher than two results are two positions down the list. The criteria 4, 5, 6 below are extensions of the criteria 1, 2, and 3 above. (4) X(N) < X(N+2) + X(N+3) + X(N+4) (5) X(N) = X(N+3) + X(N+4) + X(N+5) (6) X(N) < X(N+3) + X(N+4) + X(N+5) + X(N+6) 2 A−1
In general, we have the cfriteria X(N) =
∑
2A
X(N+i) and X(N)
0 for a position valued solution, D > 0.618. Using the relation C = 1/ln(D), C > 2.078 for X(N) = e-(N-1)/C to satisfy X(N) < X(N+1) + X(N+2). Let X(N) = X(N+2) + X(N+3) for the D(N-1) function, in which case we have D(N-1) = D(N+1) + D(N+2). Solving this equation for D, D3 + D2 – 1 ≤ 0 and for a position valued solution, we have D ≤ 0.755, and C ≤ 3.556. That is, when D > 0.618, C > 2.078, we have X(N) < X(N+1) + X(N+2) for the e-(N-1)/C and D(N-1) functions. When D ≤ 0.755 or C ≤ 3.556, we have X(N) = X(N+2) + X(N+3) for the e-(N-1)/C and D(N-1) functions. The following table shows the relative weights for the three index functions, with each row in the table representing successive URL results: Result 1 2 3 4 5 6 7 8 9 10
(N-1)
X(N) = D 1.0000 0.7549 0.5699 0.4302 0.3248 0.2452 0.1851 0.1397 0.1055 0.0796
X(N) = 1/N 1.0000 0.5000 0.3333 0.2500 0.2000 0.1667 0.1429 0.1250 0.1111 0.1000
7
1/2
X(N) = 1/N 1.0000 0.7071 0.5774 0.5000 0.4472 0.4082 0.3780 0.3536 0.3333 0.3162
Table 1 – Values for Sample Index Functions Figure 1 below displays the relative values graphically: 1.6000 1.4000 1.2000 1.0000
X(N) = D^(N-1)
0.8000
X(N) = 1/N
0.6000
X(N) = 1/SQRT(N)
0.4000 0.2000 0.0000 1
2
3
4
5
6
7
8
9
10
Figure 1 –Index Functions and Various N Once the index function is selected, the summary value of the function on relevant entries is counted as the index of the search. For example, if the user Al find entries 1 and 10 in his interest, the total score using the X(N)= D(N-1) function is X(1)+X(10) = 1.0+0.080 = 1.080; i.e., this search has a quality (or success – efficiency and effectiveness) index of 1.080. If a user Betty find entries 3, 12, and 20 in her interest, the total score in this case = X(3)+X(12)+X(20) = 0.570+0.045+0.005 = 0.620; i.e., this search process generated a 0.620 index of success. ∞
Note that for the function X(N) = D(N-1), we have the summation of the series S(N) =
∑ X(N) ≈ 4.08 for D = N =1
10
0.7549 while S(N) =
∑ X(N) ≈ 3.835.
10
That is, the
N =1
∑ X(N) equals to the 94 percentage of the total N =1
summation, which means that the index value will be accounted mostly on the first 10 entries. While the X(N) = D(N-1) seems to be the best fit in principle according to the above study, all three candidate functions mentioned above were tested in the same manner. However, for practical reason each function is 10
normalized such that
∑ X (N ) ≈ 4.0 in this study. This is accomplished by scaling X(N)= D(N-1) by 1.0431, N =1
X(N)=1/N by 1.3657, and X(N)= 1/N1/2 by 0.7967 as in the following table: Result 1 2 3 4 5 6 7 8 9
(N-1)
X(N) = D 1.0431 0.7874 0.5944 0.4487 0.3388 0.2557 0.1930 0.1457 0.1100
X(N) = 1/N 1.3657 0.6829 0.4552 0.3414 0.2731 0.2276 0.1951 0.1707 0.1517
8
1/2
X(N) = 1/N 0.7967 0.5634 0.4600 0.3984 0.3563 0.3253 0.3011 0.2817 0.2656
10
0.0830
0.1366
0.2519
Table 2 – Normalized Values for Sample Index Functions Some observations of these index functions include: • •
• •
The application of the numeric assignment allows us to measure the search quality/improvement without depending on how many total entries happen to have been examined. The value is determined by how many entries are of interest to the user and wha t their relative positions are within the results. When comparing the results of two searches, examining more results does not penalize the score generated by the function. We do not need to take into account how many entries were examined. The total number of entries looked at should not be much of a significant factor – as long as a certain number of relevant/interest entries have been located. No averaging is needed. How much effect should the later entries have on the overall quality of the search? The effect should be small, but not completely insignificant or zero.
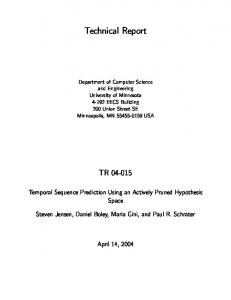
3.3 Results, Analysis, and Insights After obtaining the results from user surveys, the respondents were classified into groups according to the above criteria. In order to normalize the data we adjusted the user rankings from a 1..5 scale to a 0..4 scale in order to match the indexing function; since few users examined more than the first ten URL results, and since the total of the rank index for 1..10 is made 4.0 by scaling, this seemed reasonable. Shown below is a graphical representation of the results when Ph.D. students were asked to take the survey. In addition to the actual rankings made by the Ph.D. Students, we show the three functions detailed above for comparison purposes. 4.500 4.000 3.500 3.000 User Rating 2.500
X(N)=D^(N-1)
2.000
X(N)=1/N X(N)=1/SQRT(N)
1.500 1.000 0.500 0.000 1
2
3
4
5
6
7
8
9
10 11 12 13 14 1 5 16 17
Figure 2 – Ph.D. Student Response versus Index Ranking From the graphical representation it is clear that the candidate functions do, in general, represent the responses from the Ph.D. Students. We repeat the experiment with a combination of first plus second year students, third plus fourth year students, and others. These results are in the following figures:
9
4.500 4.000 3.500 3.000 User Rating 2.500
X(N)=D^(N-1) X(N)=1/N
2.000
X(N)=1/SQRT(N) 1.500 1.000 0.500 0.000 1 2
3 4
5 6 7
8 9 10 11 12 13 14 15 16 17 18 19 20 21 22 23 24
Figure 3 – First/Second Year Undergraduate Student Response versus Index Ranking 4.500 4.000 3.500 3.000 User Rating 2.500
X(N)=D^(N-1) X(N)=1/N
2.000
X(N)=1/SQRT(N) 1.500 1.000 0.500 0.000 1
2
3
4
5
6
7
8
9
10
11
12
13
14
15
16
Figure 4 – Third/Fourth Year Undergraduate Student Response versus Index Ranking 4.500 4.000 3.500 3.000 User Rating 2.500
X(N)=D^(N-1) X(N)=1/N
2.000
X(N)=1/SQRT(N) 1.500 1.000 0.500 0.000 1
3
5
7
9
11 13 15 17 19 21 23 25 27 29 31 33 35
37
Figure 5 – Other Response versus Index Ranking
10
From the figures, it is clear that each function does a fair job of predicting what the user indicated was the value of the search. The following table summarizes the errors in the three candidate functions. The mean error is simply the average difference between what the function predicted versus what the user indicated on the survey. The deviation is
1 ∑ x − x where again, x is the error quantity. n
Deviation of Error D 1/N 1/N D 1/N 1/N1/2 1st / 2nd Year Undergraduates 0.569 0.566 0.596 0.349 0.357 0.395 3rd / 4th Year Undergraduates 0.550 0.615 0.643 0.370 0.462 0.433 Ph.D. Students 0.702 0.672 0.761 0.397 0.359 0.408 Others 0.634 0.638 0.674 0.350 0.361 0.363 Overall 0.616 0.622 0.664 0.363 0.378 0.397 Table 3 – Mean Error, and Deviation for Three Index Functions Classification
Mean Error
(N-1)
1/2
(N-1)
From the above table we can see that the closest function for predicting the user’s responses is X(N)=D (N-1). Our first observation is that users tend to rank the overall search results using extremes. Consider the “other” group shown above in figure 5. Of the 37 responses in this category, 20 rated the overall search results as either “1 = The search yielded no URLs that matched” or “5 = The search returned what I wanted”. (This is normalized to zero and four in the graphs.) Further research may prove that using the X(N)=D (N-1) index function may yield better results if we broaden the range of the function after the prediction, so that these extremes are accommodated.
4 Prior research and comparison of RoSoT index to other methods There are many prior literatures dealing with search performance, but mostly from the standpoint of evaluation of the search engines themselves and not from the perspective of the user. In fact, entire books have been written which detail the algorithms used by Google and others [9], and research papers such as Su [15] specifically use metrics not to judge the search results, but the user satisfaction with the search engine. Thus, prior work generally deals with the question of whether “search engine X is better than search engine Y”. We first mention several of the available research papers in the area of measurement metrics, and then look at one in particular for comparison purposes. Bar-Ilan et. al. [1] presented a number of measures that compare rankings of search engine results. They applied the measures to five queries that were monitored daily for two periods of 14 or 21 days each. Rankings of the different search engines (Google, Yahoo! and Teoma for text searches and Google, Yahoo! and Picsearch for image searches) were compared on a daily basis, in addition to longitudinal comparisons of the same engine for the same query over time. The results and rankings of the two periods were compared as well. In a separate paper Bar-Ilan et. al. [2] also measured how similar were the rankings of search engines on the overlapping results. The paper compared rankings of results for identical queries retrieved from several search engines. The method was based only on the set of URLs that appeared in the answer sets of the engines being compared. For comparing the similarity of rankings of two search engines, the Spearman correlation coefficient was computed. When comparing more than two sets Kendall's W was used. These were wellknown measures and the statistical significance of the results could be computed. The methods were demonstrated on a set of 15 queries that were submitted to four large Web search engines. The findings indicated that the large public search engines on the Web employ considerably different ranking algorithms. In a later work by this group [3] the authors investigated the similarities and differences between rankings of search results by users and search engines. Sixty-seven students took part in a 3-week-long experiment, 11
during which they were asked to identify and rank the top 10 documents from the set of URLs that were retrieved by three major search engines (Google, MSN Search, and Yahoo!) for 12 selected queries. The URLs and accompanying snippets were displayed in random order, without disclosing which search engine(s) retrieved any specific URL for the query. The authors computed the similarity of the rankings of the users and search engines using four nonparametric correlation measures that complement each other. The findings showed that the similarities between the users' choices and the rankings of the search engines were low. The authors also examined the effects of the presentation order of the results, and of the thinking styles of the participants. Presentation order influenced the rankings, but overall the results indicated that there was no “average user,” and even if the users had the same basic knowledge of a topic, they evaluated information in their own context, which was influenced by cognitive, affective, and physical factors. This was the first largescale experiment in which users were asked to rank the results of identical queries. The analysis of the experimental results demonstrated the potential for personalized search. A frozen 18.5 million page snapshot of part of the Web has been created by Hawking and Craswell [8] and touted by Voorhees [17] among others, in order to enable and encourage meaningful and reproducible evaluation of Web search systems and techniques. This collection is being used in an evaluation framework within the Text Retrieval Conference (TREC) and will hopefully provide convincing answers to questions such as, “Can link information result in better rankings?”, “Do longer queries result in better answers?”, and, “Do TREC systems work well on Web data?” The snapshot and associated evaluation methods are described and an invitation is extended to participate. Preliminary results are presented for an effectiveness comparison of six TREC systems working on the snapshot collection against five well-known Web search systems working over the current Web. These suggest that the standard of document rankings produced by public Web search engines is by no means state-of-the-art. Soboroff [14] has used the TREC data to create “a new evaluation methodology which replaces human relevance judgments with a randomly selected mapping of documents to topics”. Hawking, Craswell, Bailey and Griffiths [7] evaluated the effectiveness of twenty public search engines using TREC-inspired methods and a set of 54 queries taken from real Web search logs. The Web is taken as the test collection and a combination of crawler and text retrieval system was evaluated. The engines were compared on a range of measures derivable from binary relevance judgments of the first seven live results returned. Statistical testing reveals a significant difference between engines and high inter-correlations between measures. Surprisingly, given the dynamic nature of the Web and the time elapsed, there was also a high correlation between results of this study and a previous study. For nearly all engines, there was a gradual decline in precision at increasing cutoff after some initial fluctuation. Performance of the engines as a group is found to be inferior to the group of partic ipants in the TREC-8 Large Web task, although the best engines approach the median of those systems. Shortcomings of current Web search evaluation methodology were identified and recommendations were made for future improvements. In particular, the present study and its predecessors dealt with queries which were assumed to derive from a need to find a selection of documents relevant to a topic. By contrast, real Web search reflected a range of other information need types which require different judging and different measures. Vaughan [16] proposed a set of measurements for evaluating Web search engine performance. Some measurements were adapted from the concepts of recall and precision, which were commonly used in evaluating traditional information retrieval systems. Others were newly developed to evaluate search engine stability, an issue unique to Web information retrieval systems. An experiment was conducted to test these new measurements by applying them to a performance comparison of three commercial search engines: Google, AltaVista, and Teoma. Twenty-four subjects ranked four sets of Web pages and their rankings were used as benchmarks against which to compare search engine performance. Results show that the proposed measurements are able to distinguish search engine performance very well. In Lewandowski [10] , again the topic was Web search engines; mainly the challenges in indexing the World
12
Wide Web, the user behavior, and the ranking factors used by these engines. Ranking factors were divided into query-dependent and query-independent factors, the latter of which had become more and more important within recent years. The possibilities of these factors were limited, mainly of those that were based on the widely used link popularity measures. The article concluded with an overview of factors that should be considered to determine the quality of Web search engines. McCown and Nelson [12] provided the first in depth quantitative analysis of the results produced by the Google, MSN and Yahoo API and WUI interfaces. Google, Yahoo and MSN all provided both Web user interfaces (WUIs) and application programming interfaces (APIs) to their collections. Whether building collections of resources or studying the search engines themselves, the search engines request that researchers use their APIs and not “scrape” the WUIs. However, anecdotal evidence suggests the interfaces produced different results. The authors had queried both interfaces for five months and found significant discrepancies between the interfaces in several categories. In general, they found MSN to produce the most consistent results between their two interfaces. The findings suggest that the API indices are not older, but they are probably smaller for Google and Yahoo. The authors also examined how search results decay over time, and built predictive models based on the observed decay rates. Based on the findings, it can take over a year for half of the top 10 results to a popular query to be replaced in Google and Yahoo; for MSN it may take only 23 months. In evaluating Search Engines for the Web, Chu and Rosenthal [13] described their research method in very simple terms: “Relevance of retrieved Web records was determined separately by both authors on the basis of the up to 10 Web records we downloaded for each query”. The authors did not try to read the full text Web documents by following the links provided because of time considerations and reliability of the Web linkages. In order to delineate the overall performance of each Web engine they examined, the authors not only computed precision scores for each individual query, but also calculated average precision among all 10 searches for every search engine included in the study. In addition, the authors tabulated the mean precision for each sample query so that some light could be shed on the suitability of using Web search engines for certain questions. One focus of the work by Beg [5] was to “outline a procedure for assessing the quality of search results obtained through several popular search engines”. To accomplish this they “watch the actions of the user on the search results presented before him in response to his query, and infer the feedback of the user therefrom”. In this approach, the actual activity of the user is monitored and the quality of the search results is inferred from the actions of the user. This is an “implicit” ranking which is then used to assess the quality of the search results by the various search engines under study. Our work does not rely on this implicit inference; we actually use the user survey to assess each document returned in the search. The prior research listed above is principally concerned with the determination of “which search engine is better”. None of these directly addresses the problem we are describing here, that is, the determination of user satisfaction based on the individual search results. One paper which is at least somewhat related to ours is by Bar-Yossef and Gurevich [4], which addresses the problem of measuring global quality metrics of search engines, including corpus size, index freshness, and the density of duplic ates. The authors presented two new estimators that were able to overcome bias introduced by previous research. Their estimators are based on a careful implementation of an approximate importance sampling procedure. Comprehensive theoretical and empirical analysis of the estimators demonstrates that they have essentially no bias even in situations where document degrees are poorly approximated. The Bar-Yossef and Gurevich paper addresses the “degree mismatch problem”, in which with respect to a certain document the number of queries that would (or should) retrieve the document is compared against the number of queries which actually do retrieve the document. For example, given a pool P of potential queries and a certain document x, the degree of x is q, where q ⊆ P, and each query in q retrieves x. The authors 13
use this primarily for an estimation of the effectiveness of the search engine; however we note that the inverse is also of importance – for a certain query in the set q, known to retrieve document x, where in the overall results will x appear? This is where our research fits; the prior research focuses on estimating the degree, whereas we focus on the rank of x within the results of some query within q. Duplicate density, which is briefly mentioned in the prior work, is associated with our research since we treat all but the first match in a duplicate set as a complete search miss. In our case the duplicate density has a direct impact on the RoSoT index result because of this elimination. In the case of Bar-Yossef and Gurevich, the focus is on estimating the duplicate density of the corpus maintained by the search engine; again we are considering the opposite of this, the position ranking of the duplicate within the results of query q. Finally, like our method, Yossef and Gurevich did not rely on specific knowledge of how the search
engine wo rks; they simply examined the results. But they stated that these metrics were relevanceneutral and no human judgment is required for computing them; we are focusing on which documents are relevant to a user which obviously requires human judgment. Unfortunately, it is impractical to quantitatively compare their measurement metric with our RoSoT index due to the natural differences of the parameter sets and the measurement functions involved.
5 Conclusions This paper presented a technique for a prediction of the user’s overall search value, based on the relevance of individual search results as ranked by the user. Our research properly addresses the proble m of how to measure the relevance of the Web search results with respect to the searchers interest and expectation. The RoSoT index represents a quantitative evaluation of the relevance of the search results from the user’s perspective. It can be utilized, for example, in the determination of whether search results are improved from the perspective of the users. The indexing function is not intended to be used for the comparison of different search engines, but is better used as a quantitative evaluation for the overall search results. It is also independent of the search engine used, as it only describes the satisfaction of the user, not the effectiveness of the search engine itself (although these may, of course, be related). The index function is also stand-alone and does not rely on a corpus or database of information sources created for testing purposes, as some previous methods did. Specifically we cite the following strengths to our approach: • • • • • •
The function is based on human preferences; we do not rely on particular search engines or sources of experimental setting. The function is stand-alone in the sense that no other data is needed other than the individual rankings of the URLs returned by whatever search engine is used. The function is simple to compute once the URL rankings are known. The function is intuitive – much more weight is given to correct results when they are encountered early in the returned set. This mimics the user’s perspective, where a good match early is extremely important. No standard database of test data is necessary. We also do not require any knowledge about the data itself, as the function results are based purely on the user responses to individual search results. The index function is an online function as opposed to an offline function.
We do note the following weakness in our approach: •
The index function obviously requires the user to provide the worth of individual returned results. This is,
14
by its very nature, subjective. On the other hand, we can also argue that the relevance measurement itself is subjective because it ought to be measured from individual user’s perspective. Our research is designed as a method to be used for the purpose of improving the quality of search results. In the future we can utilize the index function to determine whether methods such as ontology-based Web search methodologies, are generating improved or inferior search results. Not like some other research in this area that were designed for the comparison of search engines and often used standardized testing data sets, our index function is more general purpose and can be utilized by others for a reference on search quality which is independent of the data sources.
References [1]
Bar-Ilan, Judit, Mazlita Mat-Hassan , Mark Levene, “Methods for comparing rankings of search engine results, Computer Networks,” The International Journal of Computer and Telecommunications Networking, vol.50, no.10, p.1448-1463, 14 July 2006.
[2]
Bar-Ilan, Judit, “Comparing rankings of search results on the Web,” Information Processing and Management: an International Journal, vol.41, no.6, p.1511-1519, December 2005.
[3]
Bar-Ilan , Judit, Kevin Keenoy , Eti Yaari , Mark Levene, “User rankings of search engine results,” Journal of the American Society for Information Science and Technology, vol.58 no.9, p.1254-1266, July 2007.
[4]
Bar-Yossef Ziv, Maxim Gurevich; “Efficient Search Engine Measurements;” WWW 2007, May 8–12, 2007, Banff, Alberta, Canada.
[5]
Beg, M. M. S., “A subjective measure of Web search quality”, Information Sciences, 169 (2005), 365381.
[6]
Dix, Alan, Janet Finlay, Gregory D. Abowd, Russell Beale, “Human-Computer Interaction”, Pearson Prentice Hall, 3ed, 2004.
[7]
Hawking, D., N. Craswell, P. Bailey, K. Griffiths, “Measuring search engine quality”, Information Retrieval, 4 (2001). 33-59.
[8]
Hawking David, Nick Craswell, Paul Thistlewaite, Donna Harman, “Results and challenges in Web search evaluation,” Computer Networks, 31:1111, pp. 1321-1330, 1999.
[9]
Langville , Amy N., Carl D. Meyer, “Google's PageRank and Beyond: The Science of Search Engine
15
Rankings”, Princeton University Press, 2006. [10]
Lewandowski, Dirk, “Web searching, search engines and Information Retrieval,” Information Services and Use, v.25 n.3,4, p.137-147, July 2005.
[11]
Linden, Greg, “People Who Read This Article Also Read...,” IEEE Spectrum, Volume; 45, Issue: 3, March 2008, pp. 46-60.
[12]
McCown, Frank, Michael L. Nelson, “Agreeing to disagree: search engines and their public interfaces”, Proceedings of the 2007 conference on Digital libraries, June 18-23, 2007, Vancouver, BC, Canada.
[13]
Search Engines for the World Wide Web: A Comparative Study and Evaluation Methodology http://www.asis.org/annual-96/ElectronicProceedings/chu.html.
[14]
Soboroff, C. Nicholas, P. Cahan, “Ranking retrieval systems without relevance judgments”, Proceedings of the 24th Annual International ACM SIGIR Conference, 2001, pp. 66-72.
[15]
Su, L. T., H. L. Chen, X. Y. Dong, “Evaluation of Web-based search engines from the end-user's perspective: A pilot study”, Proceedings of the ASIS Annual Meeting, vol. 35, 1998, pp. 348-361.
[16]
Vaughan, L., “New measurements for search engine evaluation proposed and tested”, Information Processing & Management, 40 (2004), 677-691.
[17]
Voorhees, E. M., “Variations in relevance judgments and the measurement of retrieval effectiveness”, Information Processing and Management, 36 (2000), 697-716.
16
Appendix – Example Data Collection Form Search Quality Evaluation Data Collection Sheet Date:
_____________________
Overall rating:____________
Search engine:
_____________________
For the overall rating, use this scale: 1 = The search yielded no URLs that matched. 2 = The search yielded a few that matched, but I had to hunt for
them. Search terms:
_____________________
URL #
3 = This was a pretty “average” search result. 4 = The search returned mostly what I wanted; many pages were relevant. 5 = The search returned what I wanted.
Measure of relevance
Is it a duplicate?
1. The link was broken, or had nothing to do with the search terms. 2. The search terms were included in the page, but it was not something that really pertained to the search. 3. It pertained to the search, but was not that interesting relative to what I was looking for. 4. It is interesting and for the most part seems to match the search terms. 5. It is exactly what I was searching for. 1 2 3 4 5 6 7 8 9 10 11 12 13 14 15
17
Comment