WATERBIRDS JOURNAL OF THE WATERBIRD SOCIETY VOL. 32, NO. 2
2009
PAGES 203-362
A Sampling Design Framework for Monitoring Secretive Marshbirds DOUGLAS H. JOHNSON1*, JAMES P. GIBBS2, MARK HERZOG3, SOCHEATA LOR4, NEAL D. NIEMUTH5, CHRISTINE A. RIBIC6, MARK SEAMANS7, TERRY L. SHAFFER8, W. GREGORY SHRIVER9, STEPHEN V. STEHMAN2 AND WILLIAM L. THOMPSON10 1
U.S. Geological Survey, Northern Prairie Wildlife Research Center, Saint Paul, MN, 55108, USA *Corresponding author; E-mail:
[email protected]
2
State University of New York College of Environmental Science and Forestry, Syracuse, NY, 13210, USA 3
4
U.S. Fish and Wildlife Service, Biological Monitoring Team, 2630 Fanta Reed Road, La Crosse, WI, 54603, USA 5
6
PRBO Conservation Science, Petaluma, CA, 94954, USA
U.S. Fish and Wildlife Service, Habitat and Population Evaluation Team, Bismarck, ND, 58501, USA
U.S. Geological Survey, Wisconsin Cooperative Wildlife Research Unit, Department of Forest and Wildlife Ecology, University of Wisconsin, Madison, WI, 53706, USA 7
8
9
10
U.S. Fish and Wildlife Service, Division of Migratory Birds, Laurel, MD, 20708, USA
U.S. Geological Survey, Northern Prairie Wildlife Research Center, Jamestown, ND, 58401, USA
Department of Entomology and Wildlife Ecology, University of Delaware, Newark, DE, 19717, USA
National Park Service, Southwest Alaska Inventory and Monitoring Network, Anchorage, AK, 99501, USA
Abstract.—A framework for a sampling plan for monitoring marshbird populations in the contiguous 48 states is proposed here. The sampling universe is the breeding habitat (i.e. wetlands) potentially used by marshbirds. Selection protocols would be implemented within each of large geographical strata, such as Bird Conservation Regions. Site selection will be done using a two-stage cluster sample. Primary sampling units (PSUs) would be land areas, such as legal townships, and would be selected by a procedure such as systematic sampling. Secondary sampling units (SSUs) will be wetlands or portions of wetlands in the PSUs. SSUs will be selected by a randomized spatially balanced procedure. For analysis, the use of a variety of methods as a means of increasing confidence in conclusions that may be reached is encouraged. Additional effort will be required to work out details and implement the plan. Received October 20 2008, accepted April 25 2009. Key words.—marshbirds, monitoring, population, sampling design, survey. Waterbirds 32(2): 203-215, 2009
The design, implementation and reporting of population monitoring programs provide the foundation for much of our understanding of wildlife population trends, responses to management actions, and, more recently, phenological shifts associated with climate change (e.g., Stenseth and Mysterud 2002). In North America, the Breeding Bird Survey (BBS; Robbins et al. 1986) and the annual waterfowl surveys (Smith 1995) are the
most comprehensive, long-term and largescale avian monitoring programs in existence. Information from these programs has provided a basis for recommendations for harvest management, identified significant population changes, and heightened our awareness of the population declines in many migratory landbirds (e.g., Robbins et al. 1989). Despite these programs, many bird groups remain inadequately monitored. To
204
WATERBIRDS
that end, greater attention to comprehensive, large-scale monitoring programs has been directed towards other groups of birds, including marshbirds (Wheeler 2006). The planning of a North American breeding marshbird monitoring program was formally initiated in 1998 (Ribic et al. 1999), when focal species - rails (Rallus spp. and Porzana carolina), American and Least Bitterns (Botaurus lentiginosus and Ixobrychus exilis), Wilson’s Snipe (Gallinago gallinago), Pied-billed Grebe (Podilymbus podiceps), American Coot (Fulica americana), Common Moorhen (Gallinula chloropus) and Purple Gallinule (Porphyrula martinica) - were identified; a standardized field protocol was later developed (Conway 2008); and consideration was given to statistical design and sampling issues. It was also decided that an ideal monitoring program would be multi-scale so that both local and regional needs for information could be met and there would be a feasible way of “rolling up” results to make inferences about marshbird population status and trends at regional and national scales (Ribic et al. 1999). Although reasons for monitoring marshbirds (or any group of birds) are numerous, here we focus exclusively on monitoring changes in population size over time. We do not consider other useful objectives, although actual implementation of a monitoring program might address some of them. We focus on recorded counts, as indices of abundance, rather than estimates of abundance for two major reasons. First, methods to account for detectability in surveys of diverse assemblages of birds over extensive areas are not available (Johnson 2008). The detection process is more complex than has generally been acknowledged (Alldredge et al. 2007b; Simons et al. 2007), and the assumptions required to appropriately adjust counts for incomplete detectability are difficult to meet (Johnson 2008). Second, problems associated with counts of birds are much greater for secretive marshbirds than they are for most landbirds. Secretive marshbirds are, well, secretive: many are inconspicuous, they often hide in heavy vegetation, some vocalize only infrequently, and their re-
actions to the presence of human observers or to broadcasts of calls played by observers are largely unknown. Further, the habitats occupied by marshbirds are not conducive to human travel to conduct surveys. Nonetheless, the proposed sampling design would be compatible with any protocols that might account for detectability. To be successful, the sampling framework must be both statistically sound and logistically feasible. The sampling design must produce data that readily allow “rolling up” results in a hierarchical manner. The design also needs to accommodate certain realities, such as the fact that some areas (e.g., national wildlife refuges) are likely to be surveyed much more intensively than other areas, and that surveys in many areas necessarily would rely on volunteer observers. Species considered were those identified at the 1998 workshop (Ribic et al. 1999). To keep the issue manageable, we restrict the geographic scope to the contiguous 48 United States. In principle, much of the proposed framework is appropriate for other parts of North America, although implementation issues (e.g., types and sources of wetland data) may differ. Herein we provide a framework for monitoring marshbirds on a spatially extensive basis. We consider the difficulties associated with sampling marshbirds, discuss analysis issues and consider implementation challenges. SAMPLING DESIGN Design Criteria We developed a sample selection protocol to address several desirable design criteria: 1) probability sampling to provide a rigorous basis for inference, 2) hierarchical design structure to permit nesting of sub-regions within larger geographical entities (e.g., states nested within regions), 3) spatial balance to improve precision of estimates and to ensure the sample is spatially well-distributed, 4) spatial clustering of sample locations to reduce costs, 5) adaptable to accommodate the anticipated high non-response rate attributable to landowner resistance and
DESIGN FOR MONITORING MARSHBIRDS
heavy reliance on volunteers as observers, and 6) surveywide consistency to foster simplicity in describing methodology, analyzing the data, pooling and scaling up results, and reporting findings. The Sampling Universe The sampling universe is the totality of breeding habitat (i.e. wetlands) potentially used by the target species within the contiguous 48 states. Knowing the sampling universe is important when developing a sampling frame and analyzing survey data but often is difficult to specify completely. To develop the sampling universe, spatial databases can be used in conjunction with geographic information systems to identify wetlands. Doing so will permit broad-scale evaluation of the geographic regions to be monitored, which will facilitate stratification, simplify the logistics of developing the sampling frame and allow spatial analysis of the data. However, several issues relate to identifying wetlands from spatial databases: 1) defining a wetland, 2) the varying nature of wetlands, 3) the amount of open water in the wetland, 4) accessibility, and 5) regional consistency. We suggest using a broad, inclusive definition of wetlands. Because wetlands change between years due to varying water availability and processes such as ecological succession and wetland modification, a more narrow definition likely would exclude habitat in some years. The nature of wetlands differs greatly both among and within regions. Areas such as the Prairie Pothole Region are dominated by small, discrete wetlands, whereas areas such as coastal marshes are dominated by large, extensive wetlands. Therefore, we recommend that the sampling universe be divided into one universe consisting of small (≤3 ha), discrete wetlands and another universe consisting of large (>3 ha), extensive wetlands. The 3-ha demarcation was based on a circle of radius 200 m, the distance at which many calling marshbirds can be heard (e.g., Allen et al. 2004; Conway and Nadeau 2006). Both types of wetlands can occur in
205
close proximity, so the universes are not spatially distinct, and the design will select samples from both universes in a coordinated fashion. Sampling units would consist of entire wetlands in the universe of small, discrete wetlands and portions of wetlands in the universe of extensive wetlands. We propose no minimum size for wetland area because some target species (e.g., Sora [Porzana carolina] and Virginia Rail [Rallus limicola]) regularly occur on small wetlands (Brown and Dinsmore 1986), even on wetlands smaller than 0.1 ha (D. H. Johnson, unpublished data). The minimum size of wetlands in the sample universe most likely would be determined by the resolution of the available data used to construct the sampling frame. Many wetlands have large areas of deep and open water that would rarely be used by most target species and would be difficult for observers to access. For those reasons, large open-water areas should be excluded from the sampling universe. Areas of emergent vegetation and open water within 200 m of the wetland edge should be retained. Wetland accessibility may be very limited either because of landowners denying access or because of difficulties traveling to certain points. Accordingly, the sampling universe should be classified into accessible and inaccessible wetlands, which, somewhat analogously to the discrete and extensive universes, would be analyzed differently. Decisions about which wetland types will be deemed available for surveying should be comparable within and among regions. Such decisions could vary regionally in part because of differences in the quality of wetland maps available. For example, National Wetland Inventory (NWI; Wilen and Bates 1995) maps may be used for most states, but National Land Cover Database (NLCD; Homer et al. 2007) maps may be needed for other areas. The comparability of these maps, and the potential bias introduced by drawing samples from different map types, need to be assessed. Three spatial databases likely would be suitable as a start to determining the sampling universe. All are available across most or all of the contiguous 48 states; they are the
206
WATERBIRDS
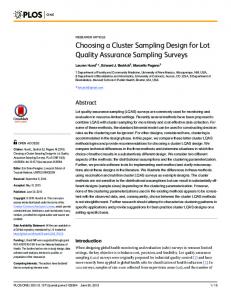
National Wetlands Inventory, the National Hydrography Dataset (NHD) and the National Land Cover Database. Each database has its imperfections. For example, all three databases were mapped or classified over multiple years, and varying precipitation levels over time can affect the number and area of wetlands mapped. However, even if wetlands were perfectly mapped, water levels of extant wetlands will vary among and within years, as will the extent and composition of emergent vegetation. Despite their shortcomings, the numerous advantages that these databases provide make their use preferable to alternatives such as subjective identification of wetlands to include in sampling. Whichever wetland database is used, the actual wetland universe will change over time as wetlands are created or are lost. These changes can be tracked over time and may require the collection of ancillary data to account for changes in water conditions and numbers of wetlands. To ensure that the sampling frame uses the best available wetland data, the selection of which database to use and the determination of accessibility in a region should be done using local expertise and field evaluation by joint ventures or with federal or state agencies overseeing implementation. Wetland maps should be evaluated periodically when more information becomes available and revised as necessary; this will be particularly important for wetlands near urbanizing areas or elsewhere where the chance of destruction is likely highest. If the underlying wetland habitat is permanently destroyed, then the affected sampling points would need to be replaced; supplemental sampling (see below) is one way to add points. Site Selection—Two-stage Cluster Sample Primary Sampling Unit Selection Protocol. Selection protocols would be implemented within geographical strata, where the strata may be Bird Conservation Regions (BCRs), states, or Bird Conservation Subregions (BCSs, the intersections of Bird Conservation Regions and states; Fig. 1, [Bart 2006]). Within each stratum, two-stage cluster sam-
Figure 1. Strata could be formed by the intersections of state boundaries (dark lines) and Bird Conservation Regions (light lines; U.S. North American Bird Conservation Initiative Committee 2007), as suggested by Bart (2006).
pling would be employed (Cochran 1977). The cluster sampling design entails separate selection protocols for the two sizes of sampling unit, a first-stage selection of primary sampling units (PSUs) followed by a secondstage selection of secondary sampling units (SSUs) within each first-stage PSU. PSUs would be land areas, such as 40-km2 or 648km2 Environmental Protection Agency hexagons (White 2007) or legal townships, and would be selected by a procedure such as systematic sampling. The PSU structure allows for obtaining improved frame information and possibly even refined maps of wetlands within the sampled PSUs; such detailed information would not be needed for the entirety of wetlands in the 48 states, thus saving significant costs associated with developing frame information needed to select the sample. Within each PSU, the sampling universe of marshbird habitat would be developed as described above. Wetlands would be characterized as either small (≤3 ha) and discrete wetland basins or large (>3 ha) and extensive wetlands. Areas of deep, open water more than 200 m from the wetland shore would be excluded. Each wetland or portion of wetlands would be categorized as accessible or inaccessible due either to difficulty of physical access (e.g., distant from roads) or to the lack of permission from owners. The inability to prospectively identify the accessibility of sites is an issue needing resolution. The areal extent of each wetland type, by accessibility,
DESIGN FOR MONITORING MARSHBIRDS
would be determined using a Geographical Information System (GIS). Model-based estimation would be used to extrapolate results to inaccessible sites. Sample sizes of PSUs will affect the precision of estimators, will be limited by available survey effort, and likely will vary greatly among strata and regions. Although variable sampling effort among strata is not ideal for the purpose of monitoring overall population size, unbiased estimation would still be possible with such unequal effort. The flexibility to shift sampling effort among strata may be advantageous when the survey is implemented. For example, intensifying sampling effort in larger strata with greater populations of marshbirds at the expense of reducing PSU sample sizes in smaller strata with fewer marshbirds will lead to greater precision in the overall estimator of marshbird population changes. Secondary Sampling Unit Selection Protocol.Secondary sampling units (SSUs) will be wetlands or portions of wetlands in the PSUs. Secondary sampling units will be selected by a randomized spatially balanced procedure such as Generalized Random Tesselation Sampling (GRTS; Stevens and Olsen 1999, 2003, 2004) or the method of Lister and Scott (2009). Points within extensive wetlands should be at least 400 m apart (based on the field protocol of Conway 2008). For each SSU, on-the-ground observers will identify accessible locations well-suited for detecting marshbirds and record their positions with a Global Positioning System (GPS) unit, so that observers can revisit the same locations on subsequent occasions. The SSU selection protocol depends on whether the PSU contains only small and discrete wetlands, only large extensive wetlands, or a mixture of both discrete and extensive wetlands. Wetlands may stretch across PSU boundaries, thus wetlands are defined as being within a PSU if the wetland’s centroid, as determined from the frame information, falls within the PSU. All discrete (and accessible) wetlands within the PSU will be listed. If the PSU contains only discrete wetlands, the number of discrete wetlands sampled in each PSU will be a maxi-
207
mum of ten. If fewer than ten discrete wetlands are present in a PSU, all of them will be sampled. If more than ten discrete wetlands are present in a PSU, a GRTS or Lister-Scott protocol will be used to select ten SSUs from all wetlands present. If the PSU contains only extensive wetlands, the GRTS or Lister-Scott protocol applied to a continuous spatial domain will be used to select a sample of point locations in accessible, extensive wetlands within the PSU. The number of points selected in a PSU depends on the area of extensive wetland within the PSU, as determined from the frame information. We tentatively propose the recommendations in Table 1, as used in a pilot study in Wisconsin in 2008. For that study, a grid of 40-km2 hexagonal cells was used to delineate the PSUs. Sample size guidelines for SSUs for the Wisconsin pilot study were based on the number of SSUs that could potentially fit within the area of extensive wetland, while maintaining the recommended 400-m minimum spacing between SSUs (Conway 2008). Thus, there could be about one SSU for every 12.5 ha of extensive wetland. For the Wisconsin pilot study, it was not possible to determine accessibility of SSUs prior to point selection. Instead, accessibility is being determined during ground-truthing of selected points prior to actual survey, and Table 1. Proposed secondary sampling unit sample-size guidelines, based on the number of accessible discrete sampling sites (k) and the area of accessible extensive wetland within a primary sampling unit. Available
In Sample
Discrete (k) Extensive (ha) 1-10 >10 0 0 0 0 0 k (k>0) k (k>0) k (k>0) k (k>0) k (k>0)