A Scalable Self-organizing Map Algorithm for Textual Classification: A Neural Network Approach to Thesaurus Generation
Dmitri G. Roussinov Department of MIS, Karl Eller Graduate School of Management, University of Arizona, McClelland Hall 430ww, Tucson, Arizona, 85721, E-mail:
[email protected] Hsinchun Chen Department of MIS, Karl Eller Graduate School of Management, University of Arizona, McClelland Hall 430ww, Tucson, Arizona, 85721, E-mail:
[email protected]
Abstract: The rapid proliferation of textual and multimedia online databases, digital libraries, Internet servers, and intranet services has turned researchers' and practitioners' dream of creating an information-rich society into a nightmare of info-gluts. Many researchers believe that turning an info-glut into a useful digital library requires automated techniques for organizing and categorizing large-scale information. This paper presents research in which we sought to develop a scaleable textual classification and categorization system based on the Kohonen's self-organizing feature map (SOM) algorithm. In our paper, we show how self-organization can be used for automatic thesaurus generation. Our proposed data structure and algorithm took advantage of the sparsity of coordinates in the document input vectors and reduced the SOM computational complexity by several order of magnitude. The proposed Scaleable SOM (SSOM) algorithm makes large-scale textual categorization tasks a possibility. Algorithmic intuition and the mathematical foundation of our research are presented in detail. We also describe three benchmarking experiments to examine the algorithm's performance at various scales: classification of electronic meeting comments, Internet homepages, and the Compendex collection.
1. Introduction According to the Webster's Ninth New Collegiate Dictionary, classification is defined as ``systematic arrangement in groups of categories according to established criteria.'' Mathematicians such as Duda and Hart explained that ``the problem of classification is basically of partitioning the feature regions, one region for each category'' [1 17]. The potential and importance of system-aided classification techniques have never been more evident than in the increasing presence of digital libraries, online databases, and Internet/intranet applications. The need to have topical, subject-specific structures (taxonomy of categories) for many of these emerging large-scale information sources and the difficulty of manually creating and maintaining such structures have made classification techniques promising and appealing. The resurgence of neural network based classification techniques, some clustering or 17], recently have attracted significant attention by researchers unsupervised learning in nature [1 [3 33]. Although computationally extensive, this class of techniques, which is based on network data structures and statistical algorithms, is generally flexible and powerful and is suited for parallelization. The self-organizing feature map (SOM) algorithm, developed by Kohonen [2 26] 27], in particular, has been widely used in many different engineering and scientific applications [2 such as image recognition, signal processing, and connectionist natural language processing. In addition, SOM is also widely used in visualization as a dimension (feature) reduction tool. The robustness of the SOM algorithm and its appealing visualization effects have also made it a prime candidate in several large-scale information categorization and visualization projects. Most noticeably, the Kohonen group has created and maintained a WEBSOM server which 22]. The Illinois Digital Library categorizes several thousand Internet newsgroup items [2 Initiative project [4 48] [4 47] has also adopted and revised SOM for textual meeting comment 39] and multi-layered SOM classification of about 10,000 Internet homepages categorization [3 [1 13]. One of the major drawbacks of neural network computation, including the SOM algorithm, has been its computational complexity. Training instances are often presented multiple times and network performance is achieved only after gradual modification of network connection/link weights. Our experience in adopting SOM in several mid-size information visualization and categorization projects (10-100 MBs, several to hundreds of thousands of abstract-size 13]. The computational complexity of the SOM documents) confirmed this general observation [1 algorithm has rendered it infeasible for large-scale applications (1-10 GBs, millions of documents, e.g., the entire searchable Internet WWW homepages). In order to improve the scalability of the SOM approach to textual classification, a more efficient algorithm is needed. This paper presents our research efforts to develop a scalable and efficient textual classification algorithm based on Kohonen’s SOM algorithm. Our implementation took advantage of the sparsity of coordinates in typical document input vectors and reduced the SOM computational complexity by several orders of magnitude. Although our technique is problem-dependent (i.e., suitable for applications that exhibit sparse input vectors), we believe it can be easily combined with other more general and domain-independent techniques reported in other research.
Section 2 presents an overview of relevant classification literature. Section 3 presents Neural Network approach to Thesaurus generation. The original SOM algorithm and our optimized SSOM algorithm are discussed in Section 4. Algorithmic intuition and the mathematical foundation of the proposed SSOM algorithm are also presented. Section 5 presents benchmarking results for three textual classification applications. Ongoing and future research efforts are summarized in Section 6.
2. Textual Classification: Literature Review 17] have explained the difference between supervised learning, which primarily Duda and Hart [1 calls for parameter estimation, and unsupervised learning, which represents clustering techniques: The distinction is that with supervised learning we know the state of nature (class label) for each sample, whereas with unsupervised learning we do not. As one would expect, the problem of unsupervised learning is the more difficult one. Their stated reasons for the importance of unsupervised learning still apply very well in textual classification applications [1 17] [7 7]. First, the labeling of a large set of sample patterns can be costly and time consuming. The recent example of the Yahoo! directory for Internet homepages is a testament to such an effort. Second, the characteristics of the patterns can change slowly over time. This is particularly true in the context of most digital libraries and Internet/intranet applications. Finally, it may be valuable to gain some insight into the structure of the a collection. System-generated classifications could provide a good strawman for further refinement and analysis. A significant number of text-based classification algorithms for documents are based on supervised learning techniques such as Bayesian probability, decision trees or rule induction, 30] linear discriminant analysis, logistic regression, and backpropagation-like neural networks [3 2] [1 1] [4 49]. Other text categorization studies have relied on machine-readable dictionaries [3 31] [2 and natural language processing techniques [4 41]. We also found use of unsupervised clustering techniques in textual analysis applications. For example, Botafoga used the graph theoretic definition of k-edge-components to define natural 4]. Iwayama and Tokunaga compared several statistical clustering clusters in hypertext systems [4 methods (e.g., single-link and Ward's) and Bayesian clustering algorithms for text categorization [2 25]. Burgin also compared the retrieval effectiveness of five hierarchical clustering methods and confirmed the single-link clustering method to be inferior to all four other methods [5 5]. In our research, our focus is on unsupervised learning and clustering techniques for textual classification. Classification of textual documents requires grouping (or clustering) similar concepts/terms as a 18]. Two approaches to cluster analysis category or topic, a process calling for cluster analysis [1 exist: the serial, statistical approach and the parallel, neural network approach. In this section, we provide only a brief summary of the conventional statistical approach. (Readers are referred 17] [1 18] for more details.) However, because our ongoing research is based on an to [1 unsupervised neural network algorithm, we provide a more detailed review of the newer parallel,
neural network approach to textual classification.
The Serial, Statistical Approach 40] defines cluster analysis as ``a statistical technique used to generate a category Rasmussen [4 structure which fits a set of observations. The groups which are formed should have a high degree of association between members of the same group and a low degree between members of different groups.'' She points out that cluster analysis is a technique that has significant potential for textual analysis. Automatic document classification involves determining a document representation structure and methods for determining similarities between documents. The hierarchical clustering of documents can be carried out either divisively or agglomeratively [4 46]. Divisive clustering breaks one complete cluster down into smaller pieces. In agglomerative clustering ``individual item similarities are used as a starting point and a gluing operation collects similar items, or groups, 46].'' into larger groups [4 Using these techniques, classes of similar objects are basically found by doing pairwise comparisons among all of the data elements. These clustering algorithms are serial in nature in that pairwise comparisons are made one at a time and the classification structure is created in a serial order.
The Parallel, Neural Network Approach A new approach to addressing clustering and classification problems is based on the connectionist approach, or neural network computing. Algorithms based upon neural networks are parallel in that multiple connections among the nodes allow for independent, parallel comparisons. Neural networks are patterned after the biological ganglia and synapses of the nervous system. The concept is not new - McCulloch and Pitts suggested the description of a neuron as a logical threshold limit in 1943 [3 36]. The essential element of the neural network is the neuron. A typical neuron j receives a set of input signals from other connected neurons, xi, each of which is multiplied by a synaptic weight factor of wij. All activation weights are then summed to produce the activation level for neuron j. Many neural network topologies and error correction (learning) 33]. algorithms have been developed since the early 1980s [3 The adjustments of the weights of the nodes of the neural network enable the total network to ``learn'' in the sense that a neural network's performance can be adjusted to fit a known set of data characteristics. In supervised learning, a set of training examples with class labels is presented, one by one, to the network. The network then calculates outputs based on its current input. The resulting output is then compared with a desired output for that particular input example. The network weights are then adjusted to reduce the error. In unsupervised learning, network models are first presented with an input vector from the set of possible network inputs. The network learning rule adjusts the weights so that input examples are grouped into classes 15] [4 44]. based on their statistical properties [1 Several information science researchers have developed neural network clustering algorithms for
textual applications. MacLeod and Robertson [3 34] present a two-layer neural network and an algorithm that is used for document clustering. This algorithm adopts an unsupervised approach to clustering by way of partitioning. Inputs are binary-valued vectors representing documents. The algorithm uses two similarity measures in order to allow proof of algorithmic behavior, cluster stability, and characterization of final clusters. The algorithm is multi-pass in that documents are repeatedly read into the network until two consecutive passes produce identical classifications for each document (convergence). Only those clusters that are successful in classifying one or more documents during the last pass are active. Inactive clusters do not take part in any subsequent retrieval operations. In [1 10], Chen et al. describe an algorithm for concept classification of electronic brainstorming comments that combines automatic indexing of the electronic brainstorming comments, term co23]. Results of occurrence concept space generation, and a Hopfield neural network classifier [2 experiments comparing the output of their algorithm with human experts and novices found that the Hopfield classifier performed as well as the novices but two human experts out-performed the novices and Hopfield classifier significantly. Reasons given for the performance differences centered on the ability of the experts to associate terms more appropriately.
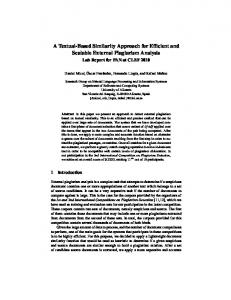
The Self-organizing Map Approach In addition to these unique neural network based clustering algorithms for information science applications, prior research in neural networks has strongly suggested the Kohonen selforganizing feature map (SOM) as a good candidate for clustering textual documents. Each Output Node is a vector of N weights
Kohonen Layer
Input Layer -- Each Node a vector representing N terms.
Figure 1: Kohonen SOM topology 26]. The Kohonen based his neural network on the associative neural properties of the brain [2 topology of the Kohonen SOM network is shown in Figure 1. This network contains two layers of nodes - an input layer and a mapping (output) layer in the shape of a two-dimensional grid [6 6] [2 21]. The input layer acts as a distribution layer. The number of nodes in the input layer is equal to the number of features or attributes associated with the input. Each node of the mapping layer also has the same number of features as there are input nodes. Thus, the input layer and each node of the mapping layer can be represented as a vector which contains the number of features
of the input. The network is fully connected in that every mapping node is connected to every input node. The mapping nodes are initialized with random numbers. Each actual input is compared with each node on the mapping grid. The ``winning'' mapping node is defined as that with the smallest Euclidean distance between the mapping node vector and the input vector. The input thus maps to a given mapping node. The value of the mapping node vector is then adjusted to reduce the Euclidean distance. In addition, all of the neighboring nodes of the winning node are adjusted proportionally. In this way, the multi-dimensional (in terms of features) input nodes are mapped to a two-dimensional output grid. After all of the input is processed (usually after hundreds or thousands of repeated presentations), the result should be a spatial organization of the input data organized into clusters of similar (neighboring) regions. Many engineering and scientific applications which involve numeric data (e.g., image recognition, signal processing) 27]. have successfully adopted the SOM approach to parallel clustering [2 Several recent studies adopted the SOM approach to textual analysis and classification. Ritter and Kohonen [4 42] applied the Kohonen SOM to textual analysis in an attempt to detect the logical similarity between words from the statistics of their contexts. Their first approach represents context of terms as a set of attribute values that occur in conjunction with the words. The second approach defines context by the sequences in which words occur, without consideration of any associated attributes. They analyze simple verbal statements consisting of nouns, verbs, and adverbs and suggest that ``such phrases or clauses involve some of the abstractions that appear in thinking, namely, the most common categories, into which the words 42].'' They argue that a similar process may be at work in the are then automatically grouped [4 brain. Typical self-organizing maps reflect metric distance relations between patterned representation vectors. Ritter and Kohonen associate this with lower levels of perception. More recently, the Kohonen group has created and maintained a WEBSOM server that demonstrates its ability to categorize several thousand Internet newsgroup items [2 22]. An intuitive twodimensional graphical user interface was also created for WEBSOM browsing. 38] developed DISCERN (DIstributed SCript processing and Episodic memoRy Mikkulainen [3 Network) as his dissertation project. DISCERN is a prototype of a subsymbolic natural language processing system that shows how script instantiation and inferences can be learned from examples by a parallel distributed processing architecture that is based upon a Kohonen selforganizing map. 48] [4 47] has also The NSF/ARPA/NASA-funded Illinois Digital Library Initiative project [4 adopted and revised SOM for textual document categorization and visualization [3 39] [1 13]. The SOM-generated categories were found to be comparable to those generated by human subjects [3 39]. (Details about these studies are to be summarized in later sections.) 32] used SOM to classify documents for information retrieval. In this application, Lin [3 documents are represented as vectors of binary values. The resulting map provides an intuitivelyappealing organization of the input documents. The documents are classified according to their content and conceptual regions are formed and named on a two-dimensional grid. A prototype system was developed based on the Macintosh's HyperCard. Merkl and Tjoa [3 37] suggested using SOM for organizing software libraries. H. Ichiki et al. [2 24] developed multi-layer semantic maps for categorization. The same idea was also adopted in the MSOM (multi-layered SOM) 13]. By allowing presentations of multiple layers, SOM was able to algorithm reported in [1 categorize mid-scale collections (i.e., several to hundreds of thousands of documents).
Although the categorization robustness and graphical friendliness of the SOM-family of algorithms have been shown in several recent studies, the computational complexity of such algorithms has caused severe implementation problems, especially for mid-to-large-scale applications. For a mid-scale application such as the Internet homepage categorization project reported in [1 13] (10,000 homepages) about 10 hours of processing on a DEC Alpha 3000/600 workstation (200 MHz, 128 MBs RAM) were required. Several researchers have tried to optimize SOM, and general-purpose SOM optimization techniques often have targeted the key steps of the algorithm. Rodriguez and Almeida [4 43] suggested starting with a small grid and adding nodes as the net begins to converge. The locations of the added nodes were interpolated from the locations of older nodes. The improvement observed varied from marginal for small applications to 10-fold for large networks. 28] suggested a way to improve the process of finding the winning node in Koikkalainen et al. [2 maps which are almost converged by replacing the exhaustive search method in SOM with an heuristic search technique for finding the winning node. Other researchers have attempted to improve SOM through parallelization. Demian and Mignot 16] optimized SOM on parallel computers, testing both SIMD and MIND architectures. They [1 assigned blocks of neurons (nodes) to each processor. The reported performance improvement was about 10-fold for 128 processors. Recently, Chen and Yang [1 14] also paralleled SOM on shared-memory multiprocessor (SMP) Convex Exemplar supercomputers. Multiple processors were used to find the winning node and to update weights of a winning neighborhood. A 10-fold improvement was also noted for SOM implemented on a 24-processor Exemplar.
3. A Neural Network Approach to Automatic Thesaurus Generation Literature Review The importance of thesauri in electronic communication was noticed dozens of years ago. A thesaurus can help when extending queries in searching for information, when selecting words to express ideas, or when switching vocabularies across domains while browsing a collection of documents. Furnas at. al [1 19] showed that different people use the same term to describe the same object with a probability less than 20%. A typist being asked to name an editing operation, might use the words delete, change, remove, spell-check, make into, etc. Atkins and Levin [3 3] suggested that meanings may not be neat little packages attachable to a word, but a blending from one dictionary sense to another. A good overview of the history of automatic thesaurus construction can be found in Gerfenstette's book, ''Exploring in Automatic Thesaurus Discovery'' [2 20]. He concludes that solving the problem by hand (manually creating a thesaurus) is costprohibitive. It is feasible only when the vocabulary is 1) limited 2) known ahead of time and 3) there exists a person or a group motivated to document exhaustively all the ways in which words can be used. Manually created vocabularies are typically either very general and static (like Webster's) or small and domain dependent (for example, MEDLINE). A number of research efforts have used knowledge-poor approaches for automatic thesaurus generation. Lewis et al., [20] using Chemistry Ph.D. titles as documents, showed that synonyms
tend never to occur together, but often tend to co-occur with the same set of other title words. 45] have demonstrated that, over large corpora, antonymous adjectives tend to Justeson & Katz [4 co-occur in the same sentence much more often than frequency-based probability would indicate. According to Grefenstette [2 20] there are three problems with co-occurrence statistical methods. 1) There is need for granularity. The technique becomes parametric since it depends greatly on the size of the text window for selection of words considered relevant. Using huge windows is computationally expensive. Small ones discard valuable information. 2) Similar concepts may never happen to co-occur. For example a document might have either tumor or tumour but not both. A document would have either car or vehicle but not often both of them nearby. 3) They are computationally expensive. Typically, the computational complexity grows as O(N2) with number of terms N. This probably explains why many researchers turned to neural network techniques for their processing. Neural networks are not considered parametric techniques. They do not provide a statistical model, but they do not need as many assumptions as do classical statistical models. Patterned after associative properties of a living brain, neural networks can be trained to discover statistical significance, to perform classifications, and to visualize information. Neural networks are very simple to implement. Neural mechanisms can be also easily utilized in parallel hardware. Kwok [2 29] trained a three-layer neural network in an attempt to reduce the semantic space to a limited number of axes represented by the hidden layer. One of the significant drawbacks of this technique is that it necessitates manually created relevance judgment. Kwok's technique falls into the category of supervised learning. On the contrary, the idea of unsupervised learning is that relevance judgments are already present in text. If two terms enter the same sentence they are relevant to some degree. One of the very well-known and frequently used techniques for unsupervised learning is self-organization, described in the previous section. We next show how self-organization can be used as an automatic thesaurus generation tool.
SSOM as a Thesaurus Tool Below, we explain how we use Kohonen's SOM as a tool for extracting semantic relationships between words and creating a hierarchy of categories. We use the abbreviation SSOM, which stands for Scaleable Self-organizing Map, to distinguish our algorithm from the original one developed by T. Kohonen. Kohonen's SOM is very well known as a clustering and dimension reduction tool. Clustering can be used for categorization of input vectors. Dimension reduction can be used for visualization and for reducing information in order to ease search, storage or processing of another kind. In Kohonen's implementation of SOM for categorizing Internet documents (WEBSOM) [22] there are no automatically created categories. Users are expected to label the map manually to produce meaningful categories. Our algorithm creates the labels automatically. For this, we build hierarchical Kohonen's maps. We produce a hierarchical taxonomy of the clustered documents as well as the concepts discovered in them. We do it similarly to the way it has been described in Chen et al. [8]. We create a label for a node by assigning the term that corresponds to the largest coordinate in the representation of the node, called the winning term. Neighboring regions having the same winning terms are merged to produce regions. The winning term is designated as the category (concept) for the entire region. Documents belonging to the same categories are
recursively used to produce smaller maps corresponding to a deeper level in the resulting hierarchy. Our SSOM algorithm gives a hierarchy of concepts, which is also called a thesaurus, and a hierarchy of documents. A hierarchy can be browsed manually or used as an extension tool for search. It is easy to see that the concepts are ordered from more general concepts (top) to more narrow ones (bottom). We should emphasize that because our SSOM produces hierarchies of documents and of terms by means of the same learning process, it is not biased toward either of these two objectives. Historically, in automatic semantic analysis, the two objectives have been separate: documents have been used as attributes to cluster terms or terms have been used as attributes to cluster documents. SSOM uses the same information to create hierarchies of documents and of concepts. Since SSOM is a neural network technique, an assumption of statistical independence of terms is not required. As a result of self organization, the vector space becomes quantified. Each quantum (node in the map) is represented by a spectrum of keywords, each with its own weight. We call this combination of terms a concept. Latent Semantic Indexing (LSI) [9,10] is another approach, one that makes use of semantic axes that operate on concepts. In LSI, each semantic axis is also a combination of terms with specified weights. It should be noted that our SSOM gives each concept a label, which LSM does not do. Another statistical property of Kohonen's SOM is that the density of nodes in the vector space resembles the distribution density of input vectors in the concept space. Bigger regions correspond to the concepts most frequently represented in input documents.
4. A Scaleable Self-organizing Algorithm for Textual Classification
Map
The scaleable self-organizing map (SSOM) implementation that we have proposed takes advantage of the input vector sparseness that exists in most textual applications. Other generalpurpose optimization techniques discussed in previous research and algorithmic paralleling can also be implemented in conjunction with the proposed SSOM algorithm.
The SOM Algorithm for Textual Classification and Time Complexity The proposed SSOM algorithm is based on the conventional SOM algorithm developed by Kohonen [2 26] [2 27]. A sketch of a revised SOM algorithm for textual classification [1 13] [3 39] is summarized below: 1. Initialize input nodes, output nodes, and connection weights: Use the top (most frequently occurring) N terms as the input vector and create a two-dimensional map (grid) of M output nodes (say a 20-by-10 map of 200 nodes). Initialize weights wij from N input nodes to M output nodes to small random values. 2. Present each document in order: Describe each document as an input vector of N
coordinates. Set a coordinate to 1 if the document has the corresponding term and to 0 if there is no such term. Each document is presented to the system several times. 3. Compute distance to all nodes: Compute Euclidean distance dj between the input vector and each output node j: d
j
=
N −1
∑
2
( x i ( t ) − w ij ( t ))
(1)
i=0
where xi(t) can be 1 or 0 depending on the presence of i-th term in the document presented at time t. Here, wij is the vector representing position of the map node j in the document vector space. From a neural net perspective, it can also be interpreted as the weight from input node i to the output node j 4. Select winning node j* and update weights to node j* and its neighbors: Select winning node j*, which produces minimum dj. Update weights to nodes j* and its neighbors to reduce the distances between them and the input vector xi(t): wi j (t + 1) = wi j (t )+ η (t )(x i (t + 1) − wi j (t ))
(2)
After such updates, nodes in the neighborhood of j* become more similar to the input vector xi(t). Here, η(t) is an error-adjusting coefficient (0 < η(t) < 1) that decreases over time. (See [2 26][3 33] for the algorithmic details of neighborhood selection and adjustment.) 5. Label regions in map: After the network is trained through repeated presentations of all documents (each document is presented at least 5 times), assign a term to each output node by choosing the one corresponding to the largest weight (winning term). Neighboring nodes which contain the same winning terms are merged to form a concept/topic region (group). Similarly, submit each document as input to the trained network again and assign it to a particular concept in the map. The resulting map thus represents regions of important terms/concepts with the documents assigned to them. Concept regions that are similar (conceptually) appear in the same neighborhood. Similar documents are assigned into same or similar concepts. Steps 2-4 are repeated many times for each document and thus account for most of the processing time required. Steps 3 (compute distance to all nodes) and 4 (update weights) require iterations through all coordinates in the input vector. The processing time T for the conventional SOM is proportional to the number of document presentation cycles (Step 2) and the vector size: T = O(NC), where N is the input vector size and C is the number of document presentation cycles. For textual categorization, input vector size can be as large as the total number of unique terms in the entire collection. In our previous experiments, we have found that the number of unique terms for mid-scale collections (10-50 MBs) after applying thresholds (for example, a term appearing more than 2 times) can be as high as tens or hundreds of thousands [1 12] [1 11]. By observing the document collections that we have analyzed and that have been mentioned in the literature, for example, Grefenstette’s works on automatic thesauri [20], it is possible to conclude that the number of unique terms in a collection is typically proportional to the size of a collection. Representing the size of a collection as S, we can define N in terms of S as N = O(S).
Similarly, because each document is presented multiple times, C can be represented by S as C = O(S). Thus, the total processing time T could be estimated as: T = O(NC) = O(S2) Given the fact that the size of text collections targeted by automatic processing grows exponentially over time, we fear that even continuously improving computer hardware (e.g., parallel supercomputers) will not be able to build SOMs using traditional approach. The conventional SOM's time complexity of ``square of the size of collection'' is deemed unscaleable. We believe that even parallel processing on the prevailing supercomputers will not 11]. resolve this algorithmic problem [1 39] [1 13] and recent analyses of the characteristics of textual Based on extensive experimentation [3 classification, we noticed that sparsity of the input vector stood out as a prime candidate for SOM optimization. It is evident that for large-scale textual collections a vast majority of coordinates in the input vectors are zeros (non-existence of a given term) and only very few are ones (existence of a given term). Due to the large number of unique terms in mid-to-large-scale collections (and thus large input vector size), almost all documents could be represented by a sparse vector of a few 1-s, plus mostly 0-s. Sparse vectors or matrices are often candidates for optimization in software engineering and operations research. We also noted that such an optimization technique has been adopted in automatic linguistic thesaurus generation [2 20].
Intuition Behind the Technique Below, we present some intuitive consideration of why such an improvement is possible. More rigorous proof is presented in the succeeding section. Using sparseness of input vectors is very typical in the textual analysis domain [20]. It is easy to notice that the vast majority of coordinates in the input vectors (documents) are 0-s, and only very few are 1-s. So, the typical input vector may look like this: …000000000100000110000000000010000001000001… This is because in each document most of the terms are missing and only a few are present. The self-organization algorithm consists of many training cycles. Each cycle involves only one input vector. We know that an input vector is typically very sparse. So, the changes in the map due to each input are relatively small. To reflect the sparseness present in the input vectors we use special data structures. We represent input vectors as sets consisting of all their non-zero coordinates. Each non-zero coordinate is essentially a pair (x, i), where x is the coordinate value and i specifies the axis. If the coordinate is not in the set, its value is equal to 0. This approach significantly reduces the amount of information to be stored and makes processing much faster. The next section shows how it can be done. Our objective is to modify the SOM algorithm so as to be able to compute distances to all nodes (Step 3) and update the weights of nodes (Step 4) at a number of iterations proportional to the number of non-zero coordinates in the input vector, represented here as P. Since we were able to do so, we can obtain an algorithm that takes O(PS) time instead of O(NS), which is thousands of times faster with up-to-date tasks. Below, we show how we derived the required modifications. It
should be noticed that the modified algorithm produces the same output as the original Kohonen’s SOM algorithm.
Mathematical Foundation for the SSOM Algorithm In this section, we first describe our modifications for weight updates (Step 4 of the SOM algorithm), followed by our procedure for computing distance to all nodes (Step 3).
Updating Weights to Nodes This subsection shows how to update weights at O(PS) time. We use a special representation for the weights of nodes. Instead of keeping the actual values of weights wij we keep “scaleable weights” denoted by aij and a special “scale” factor fj defined for each node j. The algorithm guarantees that at each training cycle the weights wij can be computed by the following multiplication: wij(t) = fj(t) aij(t)
(3)
So, the algorithm does not store or update wij , but instead works with the “scaleable weights” aij. It starts with fj(0)=1 for all nodes, and aij(0) = wij(0) for any i and j. Introducing scale factor fj benefits the performance because each time the algorithm requires weights wij to be changed we have a choice between changing aij or changing fj. We can always choose the fastest way. It should be noted that changes in fj affect values wij for all coordinates i. The weight update formula in Step 4 of the SOM algorithm can be transformed into two separate cases: wij (t ) + η (t )(0 − wij (t )), for all i such that xi (t ) = 0 wij (t + 1) = wij (t ) + η (t )(1 − wij (t )), for all i such that xi (t ) = 1 and re-arranged into: (1 − η (t ))wij (t ), for all i such that xi (t ) = 0 wij (t + 1) = η (t ) + (1 − η (t )) wij (t ), for all i such that xi (t ) = 1 In terms of aij, and fj, this transformation is expressed as: (1 − η (t )) f j (t )a ij (t ), for all i such that xi (t ) = 0 f j (t + 1)aij (t + 1) = η (t ) + (1 − η (t )) f j (t )aij (t ), for all i such that xi (t ) = 1
(4)
We update fj by the rule: f j (t + 1) = (1 − η (t )) f j (t )
(5)
To obtain the update rules for the weights aij, we substitute the update rule (5) into update rule (4):
(1 − η (t )) f j (t )aij (t ), for all i such that x i (t ) = 0 (1 − η (t )) f j (t )aij (t + 1) = η (t ) + (1 − η (t )) f j (t )aij (t ), for all i such that xi (t ) = 1 By dividing both sides by (1 − η (t )) f j (t ) we finally obtain: a ij (t ), for all i such that x i (t ) = 0 a ij (t + 1) = η (t ) (1 − η (t )) f (t ) + a ij (t ), for all i such that x i (t ) = 1 j
(6)
Since the case xi(t)=0 does not change the values for aij we need to update only the factor fj (rule (3)) and the values aij corresponding to non-zero coordinates xi(t) in rule (6). That means the time complexity of our weight adjustment is proportional to the number of non-zero coordinates. Updates according to the above formulas produce the same values for wij as the traditional SOM algorithm.
Computing Distance to All Nodes Step 3 accounts for the other major part of the computation in SOM. Redoing this process is vital for performance. We follow the same objective of separating zero and non-zero coordinates in
∑
the input vector. Throughout our paper, summation
N−1
stands for
xi (t ) =1
, for all i such that
i=0
N−1
∑
xi(t)=1. Summation
∑
stands for
xi (t ) =0
∑
, for all i such that xi(t)=0. It is easy to see that it takes
i=0
O(P) time to compute the first one, while the second one takes O(N) time. Our objective is to convert all transformations into those that are defined by
∑
since they can be computed at
xi (t ) =1 N−1
O(P) time. If we kept any
∑
components, our implementation would not be efficient and
i=0
scalable since N can be of the order of thousands and grows as O(S), while P is a small constant. Using the above notation, the formula in Step 3 of SOM can be re-written the following way: N −1
∑ ( x (t ) − w i =0
=
i
2 i j
∑ (1) + ∑
x i ( t ) =1
(t )) =
x i ( t ) =1
∑ (1 − w
x i ( t ) =1
wi j ( t ) +
∑w
2
xi ( t ) = 0
2 i j
2 i j
∑w
(t )) +
xi ( t ) =0
(t ) − 2
∑w
x i ( t ) =1
2 i j
i j
(t ) =
(t ) =
∑ (1 − 2w
x i ( t ) =1
(t ) + wi j (t )) + 2
i j
N −1
∑ (1) +∑ w
x i ( t ) =1
i =0
2 i j
(t ) − 2
∑w
x i ( t ) =1
i j
∑w
xi ( t ) = 0
2 i j
(t ) =
(t ) =
= S1 (t )+ S 2 (t ) + S 3 (t ) Here, S1 (t )=
∑ (1) and S (t )= −2 ∑ w
x i ( t ) =1
3
x i ( t ) =1
ij
(t )
can be computed at O(P) time. Computing S2
=
∑w
2 i j
(t ) involves all coordinates and time consuming. The correct solution is to update it at
All xi
each cycle instead of computing. We derive the update rule for S2(t+1) below by using aij and fj, as defined in (3) and (6): N −1
N −1
i =0
i =0
S2 (t + 1) = ∑ wi j 2 (t + 1) = ∑ ( ai j (t + 1) f j (t + 1))2 = =
∑
(ai j (t + 1) f j (t + 1))2 +
∑
(ai j (t + 1) f j (t + 1))2 +
∑
(ai j (t + 1) f j (t + 1))2 + (1 − η (t ))2
∑
(ai j (t + 1) f j (t + 1))2 + (1 − η (t ))2 ( ∑ (ai j (t ) f j (t ))2 −
x i ( t +1 ) =1
=
x i ( t +1 ) =1
=
x i ( t +1 ) =1
=
x i ( t +1 ) =1
∑ (a
(t + 1) f j (t + 1))2 =
∑ (a
(t ) f j (t )(1 − η (t )))2 =
x i ( t +1 ) = 0
ij
x i ( t +1 ) = 0
ij
∑ (a
x i ( t +1 ) = 0
ij
(t ) f j (t ))2 =
N −1 i=0
∑ (a
x i ( t +1 ) =1
ij
(t ) f j (t ))2 ) =
′ = S2 (t + 1) + (1 − η (t ))2 ( S2 (t ) − S ′ (t + 1)),
where
S2′ (t + 1) =
∑ (a
x i ( t + 1) =1
ij
(t + 1) f j (t + 1))2 and
S ′ (t + 1) =
∑ (a
x i ( t +1) =1
ij
(t ) f j (t ))2 can
both
be
computed at O(P) time. This implies that S2(t) can be updated at O(P) time by using the above rule.
What Is the Gain? So far, we have shown that computing distance to all nodes (Step 3 in SOM) and updating weights of nodes (Step 4) can be implemented in such a way that it takes time proportional to the number of non-zero coordinates in the input vector (represented by P), instead of total number of coordinates (represented by N) Because these two operations need to be performed at each iteration, the overall learning time for SOM can be drastically reduced while the output is preserved the same. Our proposed SSOM algorithm is efficient for applications where the average number of present features in a given record is much lower than the total number of available features in the entire database, i.e., exhibiting the sparse input vector characteristic. Our SSOM algorithm takes O(PS) time instead of O(S2), which can be thousands of times faster with up-to-day tasks. Since P is almost a constant invariant to the scale S , the resulting time complexity of SSOM is almost linear: O(S). It is easy to check whether a similar transformation technique can be applied when the input coordinates are real numbers and not limited to 0 or 1. All the algorithmic improvements remain the same as long as the input vectors are sparse.
5. Benchmarking Experiments The above SSOM algorithm was implemented on two SOM-based systems developed earlier at 39] [1 13]. the Illinois DLI project [3
Electronic Brainstorming Comment Classification 39] described research in the application of an SOM algorithm to the problem of Orwig at al [3 classification of electronic brainstorming output and evaluation of the results. Electronic brainstorming is one of the most productive tools in the electronic meeting system called 10]. A major step in group problem-solving involves the classification of GroupSystems [1 electronic brainstorming output into a manageable list of concepts, topics, or issues that can be further evaluated by the group. Information overload and the cognitive demand of processing a large quantity of textual data make this step problematic. Our research built upon previous work in automating the meeting classification process using a Hopfield neural network [10]. Evaluation comparing SOM output with Hopfield and human expert output using the same set of data found that the SOM performed as well as a human expert in representing term association in the meeting output and out-performed the Hopfield algorithm. In addition, recall of consensus meeting concepts and topics using the Kohonen algorithm was equivalent to that of the human expert. However, precision of the SOM was poor. The graphical representation of textual data produced by SOM suggests many opportunities for improving information organization of textual data. Increasing uses of electronic mail, computerbased bulletin board systems, and world-wide web services present unique challenges and opportunities for a system-aided classification approach. Research has shown that the Kohonen SOM can be used to create ``a picture that can represent a thousand (or more) words'' automatically. A sample classification output (important meeting topics) represented by SOM is shown in Figure 2. Each region represents one such topic as determined by SOM; the number of comments classified under each region is noted in the map. Clicking on a specific region allows the user to 39] for more details. Sample view the comments classified under it. Readers are referred to [3 outputs can also be accessed via WWW at: http://ai.bpa.arizona.edu/gsmap/
Figure 2: SOM output for 202 electronic meeting comments
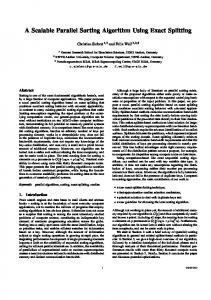
In order to improve the processing speed of SOM for GroupSystems, we proceeded to experiment with using SSOM on the same brainstorming comments. The sample electronic brainstorming data set for our SSOM bench-marking experiment consisted of 202 small paragraph-size comments (i.e., 202 input vectors). The output layer consisted of a 20-by-10 grid, (i.e., 200 output nodes). Each input vector varied in size (25-400 terms) and represented the top terms(in frequency) in the input file. Using a DEC Alpha 3000/600 workstation (200 MHz, 128 MBs RAM) for our experiment, application of the original SOM algorithm took between 55 seconds and 18 minutes, depending on the vector size. As shown in Table 1 and Figure 3, the SOM processing time increased proportionally to the size of the input vector. However, our SSOM algorithm was invariant to the size of the input vector. The SSOM processing time ranged between 41 seconds and 52 seconds (only small overhead was involved in initializing larger input vectors). Although this test set appears small in size, the SSOM speed-up (from 1.34 times to 21.73 times) should be considered very important because each EBS session needs to be analyzed and 10]. The SOM system was often used as an active classified in real time during actual meetings [1
meeting facilitation agent for classifying textual meeting output [9 9]. A short meeting pause of 12 minutes for SSOM generation is considered reasonable. However, waiting for 20 minutes and more for SOM classification in an actual meeting may often disrupt meeting process and dynamics. For longer meeting sessions and larger vector sizes, the SSOM speed-up was found to be even more significant.
Table 1: Meeting comments: processing time as a function of the vector size (number of cycles = 15,000) vector size
non-optimized (min:sec)
optimized (min:sec)
speed-up (times)
25
0:55
0:41
1.34
50
2:06
0:41
3.07
75
3:18
0:42
4.71
100
4:30
0:43
6.28
125
5:41
0:43
7.93
150
6:53
0:43
9.60
175
8:05
0:43
11.28
200
9:16
0:46
12.09
225
10:28
0:45
13.96
250
11:40
0:47
14.89
275
12:51
0:47
16.40
300
14:03
0:48
17.56
325
15:15
0:49
18.67
350
16:26
0:50
19.72
375
17:38
0:51
20.75
400
18:50
0:52
21.73
Figure 3: Meeting comments: processing time as a function of the vector size
21:36
19:12
16:48
CPU time (minutes)
14:24
12:00 not optimized optimized 9:36
7:12
4:48
2:24
0:00 0
50
100
150
200
250
vector size
300
350
400
450
Internet Entertainment Homepage Classification The problems of information overload and vocabulary differences have become more pressing with the emergence of the increasingly popular Internet services. The main information retrieval mechanisms provided by the prevailing Internet WWW software are based on either keyword search (e.g., Lycos, Alta Vista) or directory browsing (e.g., Yahoo!). Chen et al. [1 13] have presented research which aimed at providing an alternative concept-based categorization and search capability for WWW servers based on the SOM algorithm. They reported results of testing multi-layered SOM (MSOM) clustering algorithm to classify Internet homepages according to their content. The category hierarchies created could serve to partition the vast Internet services into subject-specific categories and databases and improve Internet keyword searching and/or browsing. In this study we used the same collection of about 10,000 entertainment-related homepages (extracted by a spider running on the entertainment portion of the Yahoo! directory). The topmost classification output (entertainment-related topics) represented by SOM is shown in Figure 4. Each region represents an important entertainment-related topic (category) determined by SOM and the number of homepages classified under each region was also noted in the map. Each region can be clicked on to view a more detailed SOM map representing sub-topics classified under the region. The threshold for the lowest-level map was set to 100 homepages. By clicking the lowest-level map, a user could view the actual homepages. Readers are referred to [1 13] for more details. Sample outputs can also be accessed via WWW at: http://ai.bpa.arizona.edu/ent/
Figure 4: First-level map for 10,000 entertainment-related homepages
The same DEC Alpha 3000/600 was used for the SSOM experiment on Internet homepages. Only the first-level map was used for comparison. (Producing maps of all levels took 4-5 times the first-level map processing time.) As shown in Table 2 and Figure 5, processing time for SOM varied significantly according to the input vector size (25 to 400 coordinates), from 10 minutes and 10 seconds to 190 minutes and 20 seconds. Using SSOM, the processing time ranged between 8 minutes and 12 seconds and 12 minutes and 33 seconds. As plotted in Figure 5, SSOM was largely invariant to the vector size, while SOM process time was linearly proportional to the vector size. The SOM speed-up was15-fold when vector size was 400. Due to the time requirement for testing the SOM algorithm, we were unable to continue to increase the vector size beyond 400. However, the same speed-up conclusion should hold for large vector sizes. For the large-scale Illinois DLI test collections, which involve several million Internet homepages and journal abstracts (5-10 GBs) [4 47], significantly larger vector sizes (often on the order of several thousands) are needed, thus demanding the SSOM classification approach.
Table 2: Internet homepages: processing time as a function of the vector size (number of cycles = 130,000) vector size
non-optimized (min:sec)
optimized (min:sec)
speed-up (times)
25
10:10
8:12
1.23
50
22:10
8:29
2.61
75
34:11
8:46
3.90
100
46:12
9:04
5.10
125
58:12
9:21
6.22
150
70:13
9:39
7.28
175
82:14
9:56
8.28
200
94:14
10:13
9.22
225
106:15
10:31
10.10
250
118:16
10:48
10.96
275
130:16
11:06
11.74
300
142:17
11:23
12.50
325
154:18
11:40
13.23
350
166:18
11:58
13.90
375
178:19
12:15
14.56
400
190:20
12:33
15.17
Figure 5: Internet homepages: processing time as a function of the vector size
216:00:00
192:00:00
168:00:00
CPU time (minutes)
144:00:00
120:00:00 not otpimized optimized 96:00:00
72:00:00
48:00:00
24:00:00
0:00:00 0
50
100
150
200
250
vector size
300
350
400
450
Large Scale Experiment In this section, we describe an experiment with a large scale SSOM. We built a map for a collection that would be impossible to build on currently available hardware without using the optimized SOM technique. We used the documents from the very well known COMPENDEX collection, which consists of abstracts from such computing-related fields, such as electrical engineering, computer science, information systems etc. The collection has 247,721 documents and the size of the collection after we applied indexing was 360 megabytes. After indexing, we extracted about 160,000 unique terms, not counting words in a stop-word list or words that appeared fewer than 3 times. Of those, we selected 10,000 frequently occurring terms as the most representative. We chose more frequently occurring terms since they provided the most overlap in the document representations and we found this to be usually beneficial for the quality of maps. We built a map of 30 by 30 nodes and performed 4,500,000 training cycles, so each document was presented about 15 times. The entire process took 15,7 CPU hours, about 24 hours of real time. We used the same DEC Alpha machine for this experiment as for the experiments described above. Our analysis of the algorithms presented earlier in this paper suggests that the straightforward technique would take about 1000 times as much time, which corresponds to 625 CPUdays. Even with a supercomputer speed-up ratio of about 40 to 1, this task could never be finished in a reasonable amount of time.
6. Conclusion and Discussion This paper presents our research efforts to develop a scalable and efficient textual classification algorithm based on Kohonen's self-organizing feature map (SOM) algorithm. Our data structures and implementation take advantage of the sparsity of coordinates in the document input vectors and reduce the SOM computational complexity by several orders of magnitude. The resulting time complexity of our algorithm is proportional to the average number of non-zero coordinates in an input vector rather than to input vector size. Our research was part of the Illinois DLI project, one of the long-term goals of which is to develop scalable and robust categorization techniques for large-scale textual and multimedia documents. Our current research efforts include: •
Algorithmic improvement: Several domain-independent SOM optimization techniques reported in earlier studies [4 43] [2 28] are under consideration. We believe that by incorporating these techniques in SSOM we may be able to reduce another order of computational complexity.
•
SSOM parallelization: As discussed earlier, we are in the process of implementing parallel SSOM applications on the 24-node SGI Power Challenge and 24-node Convex Exemplar supercomputers, made available through the National Center for 14]. Our initial Supercomputing Applications (a partner of the Illinois DLI project) [1 implementation results showed a 10-fold improvement on a 24-node Convex Exemplar.
However, we also experienced significant file I/O bottleneck and inter-hypernode communication and synchronization problems in the shared-memory multiprocessor (SMP) based Convex Exemplar. More systematic benchmarking is under way. •
SSOM for visual thesaurus: In conjunction with a University of California at Santa Barbara (UCSB) DLI project that focuses on geo-referenced collections, we are also in the process of adopting SSOM for large-scale aerial photo and satellite image classification based on texture and region extraction algorithms developed earlier at 35]. UCSB [3
Acknowledgment This project is supported mainly by: •
a Digital Library Initiative grant awarded by NSF/ARPA/NASA (``Building the Interspace: Digital Library Infrastructure for a University Engineering Community,'' PIs: B. Schatz, H. Chen, et al., 1994-1998, IRI9411318),
•
an NSF/CISE grant (``Concept-based Categorization and Search on Internet: A Machine Learning, Parallel Computing Approach,'' PI: H. Chen, 1995-1998, IRI9525790), and
•
an NCSA High-performance Computing Resources Grant (``Information Analysis and Visualization for Business Applications,'' PI: H. Chen, 1995-1997, IRI960001N).
References 1. C. Apte, F. Damerau, and S. M. Weiss. Automated learning of decision rules for text categorization. ACM Transactions on Information Systems, 12(3):231-251, July 1994. 2. C. Apte, F. Damerau, and S. M. Weiss. Towards language independent automated learning of text categorization models. In Proceedings of the 17th Annual International ACM/SIGIR Conference on Research and Development in Information Retrieval, pages 3-12, Dublin, Ireland, 1994. 3. Beryl Atkins and Beth Levin. Admitting impediments. in lexical acquisition: exploiting online resources to build a lexicon. In U. Zernik, editor, Lexical Acquisition: exploiting on-line resources to build a lexicon, page 233, Hillsdale, New Jersey, 1991. Lawrence Erbaum Associates. 4. R. A. Botafogo. Cluster analysis for hypertext systems. In Proceedings of the 16th Annual International ACM/SIGIR Conference on Research and Development in Information Retrieval, pages 116-125, Pittsburgh, PA, 1993. 5. R. Burgin. The retrieval effectiveness of five clustering algorithms as a function of indexing exhaustiveness. Journal of the American Society for Information Science, 46(8):562-572,
September 1995. 6. M. Caudill. A little knowledge is a dangerous thing. AI Expert, 8(6):16-22, June 1993. 7. H. Chen. Machine learning for information retrieval: neural networks, symbolic learning, and genetic algorithms. Journal of the American Society for Information Science, 46(3):194-216, April 1995. 8. H. Chen, Schuffels C., and Orwig R. Internet categorization and search: A machine learning approach. Journal of Visual Communication and Image Representation, 7:88-102, 1996. 9. H. Chen, A. Houston, J. Yen, and J. F. Nunamaker. Toward intelligent meeting agents. IEEE COMPUTER, 29(8):62-70, August 1996. 10. H. Chen, P. Hsu, R. Orwig, L. Hoopes, and J. F. Nunamaker. Automatic concept classification of text from electronic meetings. Communications of the ACM, 37(10):56-73, October 1994. 11. H. Chen, B. R. Schatz, T. D. Ng, J. P. Martinez, A. J. Kirchhoff, and C. Lin. A parallel computing approach to creating engineering concept spaces for semantic retrieval: The Illinois Digital Library Initiative Project. IEEE Transactions on Pattern Analysis and Machine Intelligence, 18(8):771-782, August 1996. 12. H. Chen, B. R. Schatz, T. Yim, and D. Fye. Automatic thesaurus generation for an electronic community system. Journal of the American Society for Information Science, 46(3):175-193, April 1995. 13. H. Chen, C. Schuffels, and R. Orwig. Internet categorization and search: a machine learning approach. Journal of Visual Communications and Image Representation, 7(1):88-102, March 1996. 14. H. Chen and M. Yang. Self-organizing map optimization using Exemplar supercomputers. In Center for Management of Information, University of Arizona, Working Paper, CMI-WPS 9615, 1996. 15. J. Dalton and A. Deshmane. Artificial neural networks. IEEE Potentials, 10(2):33-36, April 1991. 16. V. Demian and J. C. Mignot. Implementation of the self-organizing feature map on parallel computers. In L. Bouge, M. Cosnard, Y. Robert, and D. Trystram, editors, Proceedings of the Second Joint International Conference on Vector and Parallel Processing, pages 775-776, Berlin, Heidelberg, 1992. Springer. 17. R. O. Duda and P. E. Hart. Pattern Classification and Scene Analysis. John Wiley & Sons, Inc., New York, NY, 1973. 18. B. Everitt. Cluster Analysis. Second Edition, Heinemann Educational Books, London, England, 1980. 19. George W. Furnas, L.M. Gomez Tomas K. Landauer, and Susan T.Dumais. The vocabulary
problem in human-system communication. Communications of the ACM, 30:964-971, 1987. 20. G. Grefenstette. Explorations in Automatic Thesaurus Discovery. Kluwer Academic Publishers, Moston, MA, 1994. 21. A. Hiotis. Inside a self-organizing map. AI Expert, 8(4):38-43, April 1993. 22. T. Honkela, S. Kaski, K. Lagus, and T. Kohonen. Newsgroup exploration with WEBSOM method and browsing interface. In Report A32, Helsinki University of Technology, January 1996. 23. J. J. Hopfield. Neural network and physical systems with collective computational abilities. Proceedings of the National Academy of Science, USA, 79(4):2554-2558, 1982. 24. H. Ichiki, M. Hagiwara, and N. Nakagawa. Self-organizing multi-layer semantic maps. In Proceedings of International Conference on Neural Networks, pages 357-360, Seattle, WA, July 1991. 25. M. Iwayama and T. Tokunaga. Cluster-based text categorization: a comparison of category search strategies. In Proceedings of the 18th Annual International ACM/SIGIR Conference on Research and Development in Information Retrieval, pages 273-280, Seattle, WA, 1995. 26. T. Kohonen. Self-Organization and Associative Memory. Third Edition, Springer-Verlag, Berlin Heidelberg, 1989. 27. T. Kohonen. Self-Organization Maps. Springer-Verlag, Berlin Heidelberg, 1995. 28. P. Koikkalainen. Fast deterministic self-organizing maps. In F. Fogelman-Soulié and P. Gallinari, editors, Proceedings of the International Conference on Artificial Neural Networks, pages 63-68, Nanterre, France, 1995. 29. K. L. Kwok. Query learning using ANN with adaptive architecture. In Lawrence A. Birmbaum and Gregg C. Collins, editors, Machine Learning: proceedings of the eight International Workshop (ML91), pages 260-264, SanMateo, CA, 1991. Morgan Kaufmann Publishers Inc. 30. D. D. Lewis and W. A. Gale. A sequential algorithm for training text classifiers. In Proceedings of the 17th Annual International ACM/SIGIR Conference on Research and Development in Information Retrieval, pages 3-12, Dublin, Ireland, 1994. 31. E. D. Liddy, W. Paik, and E. S. Yu. Text categorization for multiple users based on semantic features from a machine-readable dictionary. ACM Transactions on Information Systems, 12(3):278-295, July 1994. 32. X. Lin, D. Soergel, and G. Marchionini. A self-organizing semantic map for information retrieval. In Proceedings of the Fourteenth Annual International ACM/SIGIR Conference on Research and Development in Information Retrieval, pages 262-269, Chicago, IL, October 13-16 1991. 33. R. P. Lippmann. An introduction to computing with neural networks. IEEE Acoustics Speech and Signal Processing Magazine, 4(2):4-22, April 1987.
34. K. J. MacLeod and W. Robertson. A neural algorithm for document clustering. Information Processing & Management, 27(4):337-346, 1991. 35. B. S. Manjunath and W. Y. Ma. Texture features for browsing and retrieval of image data. IEEE Transactions on Pattern Analysis and Machine Intelligence, 18(8):837-841, August 1996. 36. W. S. McCulloch and W. Pitts. A logical calculus of the ideas immanent in neural nets. Bulletin of Mathematical Biophysics, 5:115-137, 1943. 37. D. Merkl and A. M. Tjoa. The representation of semantic similarity between documents by using maps: application of an artificial neural network to organize software libraries. In Proceedings of the General Assembly Conference and Congress of the International Federation for Information and Documentation, 1994. 38. R. Mikkulainen. Subsymbolic Natural Language Processing: An Integrated Model of Scripts, Lexicon, and Memory. The MIT Press, Cambridge MA, 1993. 39. R. Orwig, H. Chen, and J. F. Nunamaker. A graphical, self-organizing approach to classifying electronic meeting output. Journal of the American Society for Information Science, 48(2):157-170, February 1997. 40. E. Rasmussen. Clustering algorithms. In Information Retrieval: Data Structures and Algorithms, W. B. Frakes and R. Baeza-Yates, Editors, Prentice Hall, Englewood Cliffs, NJ, 1992. 41. E. Riloff and W. Lehnert. Information extraction as a basis for high-precision text classification. ACM Transactions on Information Systems, 12(3):296-337, July 1994. 42. H. Ritter and T. Kohonen. Self-organizing semantic maps. Biological Cybernetics, 61:241254, 1989. 43. J. S. Rodrigues and L. B. Almeida. Improving the learning speed in topological maps of patterns. In Proceedngs of International Conference on Neural Networks, pages 813-816, Dordrecht, Netherlands, 1990. Kluwer Academic Publishers. 44. D. E. Rumelhart, G. E. Hinton, and R. J. Williams. Learning internal representations by error propagation. In Parallel Distributed Processing, pages 318-362, D. E. Rumelhart, J. L. McClelland, and the PDP Research Group, Editors, The MIT Press, Cambridge, MA, 1986. 45. Justeson John S. and Slava M. Katz. Co-occurrences of anonymous adjectives and their contexts. Computational Linguistics, 17:1-19, 1991. 46. G. Salton. Automatic Text Processing. Addison-Wesley Publishing Company, Inc., Reading, MA, 1989. 47. B. R. Schatz and H. Chen. Building large-scale digital libraries. IEEE COMPUTER, 29(5):22-27, May 1996. 48. B. R. Schatz, B. Mischo, T. Cole, J. Hardin, A. Bishop, and H. Chen. Federating repositories of scientific literature. IEEE COMPUTER, 29(5):28-36, May 1996.
49. H. Schutze, D. A. Hull, and J. O. Pedersen. A comparison of classifiers and document representation for the routing problem. In Proceedings of the 18th Annual International ACM/SIGIR Conference on Research and Development in Information Retrieval, pages 229-237, Seattle, WA, 1995. 50. Lewis P. A. W., P. B. Baxendale, and J. L. Bennet. Statistical discrimination of the synonymy/antonymy relationship between words. Journal of the ACM, 14:20-44, 1967.