A Segmentation Perturbation Method for Improved Iris Recognition Joseph W. Thompson
Patrick J. Flynn
Department of Computer Science and Engineering University of Notre Dame Email:
[email protected]
Department of Computer Science and Engineering University of Notre Dame Email:
[email protected]
Abstract—A new approach for iris recognition is presented. Perturbations of iris segmentations generated by an existing algorithm are used to generate probe templates that are compared to gallery templates. Information from the perturbation match score distributions is used to boost the recognition accuracy of the original algorithm. Experiments with the technique show performance improvements ranging from 24% to 35%
The paper is organized as follows. Section II will detail the experimental setup defining the algorithm used, the data set, the perturbations used, and the procedure. Section III will present the results of two similar experiments run on the presented data set with discussion of the results in section IV. Finally, conclusions and future work will be discussed in section V.
I. I NTRODUCTION II. E XPERIMENT Most existing iris recognition algorithms are composed of three distinct parts: a segmentation algorithm to extract the iris in an image, a normalization and feature extraction step to acquire a standard set of features from the iris texture, and a matching algorithm. Each part affects the overall performance, but segmentation can be viewed as the critical step. If the segmentation is incorrect, any feature extraction algorithm will fail, and any matching performed will be essentially meaningless. Thus, a recognition performance gain should be observed for any recognition algorithm if the segmentation result can be improved. This paper proposes a technique for improving recognition performance by perturbing software provided segmentation data. An initial iris segmentation is found using existing techniques. Normalized iris templates are obtained through perturbation of the segmentation parameters and employed in matching, generating a set of matching scores which can yield a final match score through fusion or selection. While this method cannot overcome a failed segmentation that misses the iris completely, it can overcome mislocalizations. Perturbation studies have already been completed in the facial recognition domain. The first work was conducted by Riopka and Boult [1] where the effects of perturbing the provided eye locations on different algorithms was analyzed. They concluded that eye location was a critical element in recognition performance. In work by Min et al. [2], perturbed eye locations were used to generate multiple probe templates from a single image. These templates were then matched against a gallery generating many match scores. Min et al. showed that score fusions of the perturbed scores improved recognition performance. This is to our knowledge the first work to apply a perturbation method to iris segmentations with the intent to improve recognition performance.
978-1-4244-7580-3/10/$26.00 ©2010 IEEE
A. Recognition Algorithm The IrisBEE iris recognition system used in this experiment was developed as a reimplementation of a Daugman-like system originally developed by Masek [3]. The initial release was created by Xiaomei Liu [4] in 2005 and has been rewritten and extensively modified. The segmentation system assumes that the pupil and limbic boundaries are well approximated by circles. It first attempts to locate the pupil circle edge using a Canny edge detector and a Hough circle transform. Second, the same approach is applied to locate the limbic boundary. Various contrast tests are performed on candidate circles in each case in an effort to ensure that the most accurate boundary is selected. Active contours [5] are then optionally used to refine the limbus boundary masking the eyelid and other artifacts obstructing the iris texture in the process. If active contours are not used to refine the limbus boundary, the originally implemented [4] two-piece linear eyelid detector will attempt to mask the eyelids within the limbus boundary circle. In both segmentation algorithms specular highlights are also masked. The two masking steps are drastically different. Active contours use global model information obtained from many different iris images. The global model contains information about the general limbus boundaries and iris textures. With this model, the limbus boundary is refined using active contours to create a mask attempting to ensure that only iris texture is left unmasked inside the limbus circle. Segmentations created using this method will be referred to as active contours segmentations. The two-piece linear eyelid detector attempts to fit two lines to each of the upper and lower eyelids using local region data. If these lines intersect the calculated limbus boundary, everything above the the upper eyelid and below the lower eyelid is masked. If eyelids are not occluding the iris,
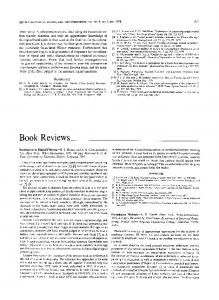
Fig. 1. A segmented iris image masked using an active contours snakes model. The parameters that determine the boundary circles are labeled. a) is the radius of the pupil circle with center b). c) is the radius of limbus boundary circle with center d).
only specular highlights will be masked. Segmentations created using this method will be referred to as Liu segmentations [4]. The segmented images are then normalized by transforming the (x,y) image coordinates into a doubly dimensionless polar coordinate system as described by Daugman [6]. The normalized rectangular image is filtered one row at a time using a 1dimensional log Gabor filter. The complex valued filter output is binned into one of the four quadrants based on the sign of the components. There are 4 bins and thus two bits needed to represent all of the bins. With this information, a two bit array (one for the real quadrant and one for the imaginary quadrant) are created to represent the filtered image. A bitwise fractional Hamming distance can then be calculated to determine a match score between zero and one with better matches having lower scores [6]. B. Data The data used in the this experiment are a subset of the publicly available ND-IRIS-0405 data set [7] . The data set contains iris images acquired on an LG2200 [8] iris camera system and was compiled for use in the Iris Challenge Evaluation (ICE) [7] . Hollingsworth et al. originally constructed the subset for use in [9]; it contains between 15 and 118 left eye images for each of 24 subjects for a total of 1,226 images. Of the 24 subjects, 10 are male and 14 are female, 20 are Caucasian and four are Asian. The subset contains images with minimal eyelid and eyelash occlusion. This ensures that almost all of the iris texture is available to be analyzed. Further, all of these images were well segmented by IrisBEE as verified by physical inspection. In [9] Hollingsworth et al. note that slight segmentation imperfections are still present, the main reason for this being the software attempting to fit circular boundaries to boundaries in the iris that are not perfectly circular. Because
——
Fig. 2. Top: an iris with the segmented using the Liu algorithm and the associated normalized image. Bottom: the optimum perturbed segmentation with the associated normalized image.
of this, the segmentation boundaries may not contain all of the iris and may contain parts of the pupil and the sclera. C. Defining Segmentation Perturbations The IrisBEE software consists of three parts, segmentation, normalization and feature extraction, and matching. The segmentation step attempts to find the circular boundaries that best approximate the boundaries between the limbus and sclera and between the pupil and limbus. These circles are represented by 6 parameters: the x-coordinate, the y-coordinate, and the radius of the circle, and the same three values for the pupil circle (shown in Fig. 1). Taken together these parameters fully represent the original segmentation of the image as determined by the software. A perturbed segmentation is defined as a segmentation resulting from changing one or more of the parameter values of the original segmentation. For example, the limbus circle can be shifted 10 pixels to the left by subtracting 10 from the original x-coordinate of the limbus circle center. Using
this perturbed segmentation, a different normalized image is created from the same input image. To create a perturbed segmentation, any subset of the segmentation parameters may be adjusted by any amount that leaves the pupil circle entirely within the limbus circle. Fig. 2 illustrates an example perturbation. For the purposes of this experiment, only segmentation parameter adjustments of three pixels or less in either direction are used. With this limitation, the number of possible perturbations is 76 − 1, since the original unperturbed segmentation is already available. D. Defining Segmentation Performance Given a segmentation, IrisBEE transforms the input image into the doubly dimensionless coordinate form as proposed by Daugman[6]. Once the normalized image is created, each row is filtered and an iris code generated through quantization of the phase response by quadrant. The template is then matched against all other templates in the gallery to yield a Hamming distance between each pair of probe and gallery images. The performance of a segmentation is defined as the matching performance of the resulting template image, that is, the Hamming distance between the input image and its true match in the gallery (a lower Hamming distance is better). E. Procedure We have designed an experiment to determine if the segmentation for an input image generated by IrisBEE is the optimum segmentation. An optimum segmentation of a probe image is defined as the segmentation that produces the normalized image (and thus features) that minimizes the Hamming distance to the template extracted from the identity-matched gallery image. For example, the IrisBEE segmentation is optimal if the Hamming distance between the template generated without perturbation and the matching gallery image template is lower than the Hamming distance between any other template generated by perturbation and the same gallery template. The experiment uses IrisBEE to generate a segmentation and an iris code template for the probe image (the original segmentation). Other segmentation parameter files are then created for each perturbation in the defined perturbation space. Using the original and perturbed segmentations, the original image is normalized and processed to obtain 76 − 1 additional iris code templates. These templates are used as probes to be compared to the templates in a previously selected gallery. The above process generates 76 true match scores and 23 × 76 non-match scores for a gallery of 24 subjects that includes the correct subject. Of the true match scores for each input image, only two are of interest for this experiment, the original segmentation true match score and the minimum true match score obtained from the matches of perturbed versions of the segmentation. All non-match scores are considered equally important. Processing the entire probe set in this way yields four score distributions: the true match scores of the original segmentations (Original Match), the non-match scores of the original segmentations (Original Non-Match), the distribution of optimal match scores for perturbed segmentations
(Optimum Perturbed Match), and the non-match scores of the perturbed segmentations where all perturbed segmentations are considered (Perturbed Non-Match). In an ideal recognition experiment, the match and nonmatch distributions should be completely separable. That is, there should exist a threshold value such that every matching score less than this value can be classified as true match and every score greater than the value can be classified as a true non-match (true reject) with 100% accuracy. Normally to compare two match and non-match distribution pairs, receiver operating characteristic (ROC) curves are used to analyze the false accept (FAR) and false reject rates (FRR). The two distributions are also compared using the equal error rate (ERR) point which corresponds to the point on the ROC curve at which the false accept rate is equal to the false reject rate. However, these metrics become meaningless if one algorithm is 100% accurate. Instead, we analyze shifts between related distributions. This is similar in approach to the above metrics but allows for better analysis of algorithms that are 100% accurate. The match distributions from each experiment should be compared as well as the non-match distributions from each. Given two recognition algorithms, A and B, A is more accurate than B if the match and non-match distributions of A overlap less than the match and non-match distributions of B. This can appear in results as the left shift of the match distribution of A compared to B while the non-match distributions remain nearly identical. III. R ESULTS AND A NALYSIS A. Active Contours Segmentation This set of experiments employed the active contours limbus boundary refining step. TABLE I D ISTRIBUTION S TATISTICS Full Parameter Search Space
Active Contours
Orig. Pert. Diff.
Match Mean Std. Dev 0.1534 0.0516 0.1043 0.0337 0.0491 0.0179
Liu Segmentation
Orig. Pert. Diff.
0.1489 0.0960 0.0529
Algorithm
0.0480 0.0357 0.0123
Non-Match Mean Std. Dev 0.4391 0.0194 0.4393 0.0194 -0.0002 0.0000 0.4453 0.4454 -0.0001
0.0169 0.0167 0.0002
Reduced Parameter Search Space
Active Contours
Orig. Pert. Diff.
Match Std. Dev Mean 0.1534 0.0516 0.1153 0.0406 0.0381 0.0110
Liu Segmentation
Orig. Pert. Diff.
0.1489 0.1068 0.0421
Algorithm
0.0480 0.0387 0.0093
Non-Match Mean Std. Dev 0.4391 0.0193 0.4391 0.0194 0.0000 -0.0001 0.4453 0.4454 -0.0001
0.0169 0.0169 0.0000
Match Score Distributions (Active Contours) 0.25 Original Match Optimum Perturbed Match Perturbed Non−Match Original Non−Match
% in Bins
0.2
0.15
0.1
0.05
0
0.05
0.1
0.15
0.2
0.25
0.3
0.35
0.4
0.45
0.5
Fractional Hamming Distance (Match Score)
Histogram of Perturbations Sorted by Parameter 450
Number of Images with Perturbation
−3
−2
−1
0
1
2
3
400 350 300 250 200 150 100 50 0
LimbusX
LimbusY LimbusRad
PupilX
PupilY
Perturbation Amounts by Parameter
PupilRad
Fig. 3. Top: Match and non-match distributions comparing the original segmentations to the perturbed segmentations using the active contours segmentation algorithm. Bottom: Histogram detailing the occurrences of each perturbation amount sorted by parameter.
True Match Scores: Full vs. Reduced (Active Contours) 0.14 Optimal Perturbed Match (Full) Optimal Perturbed Match (Reduced)
0.12
% in Bins
0.1
0.08
0.06
0.04
0.02
0
0.05
0.1
0.15
0.2
0.25
0.3
0.35
Fractional Hamming Distance (Match Score) Fig. 4. Comparison of the match distributions for the optimum perturbed segmentations on the full and reduced parameter spaces for the active contours segmentation algorithm.
1) Full Parameter Search Space: Fig. 3 shows the histograms for the four previously mentioned distributions of match and non-match scores. In every case, a perturbed segmentation generated a better-matching template than the original segmentation. On average, the decrease (improvement) in match score value was 0.0491 for the optimal perturbed template. This shifted the true match score distribution to the left as shown in Fig. 3. In addition to shifting the true match score distribution to the left, using the optimal perturbation as the probe image also served to compress the score distribution compared to the original true match distribution. The standard deviation of match scores in the perturbed optimal true match distribution was 0.0337; the standard deviation of match scores in the original true match distribution was 0.0516. Using every perturbed image as a probe has a negligible impact on the non-match distribution. Fig. 3 shows that the two non-match histograms are similar. The difference of means of the two is 0.0002 with the perturbed non-match distribution having the higher mean, and the standard deviations are equal to four significant digits. Mean and standard deviation data for all distributions are provided in Table 1. The combined effect of shifting true match scores to the left and compressing the true match distribution while leaving the non-match distribution relatively unchanged implies that the optimal perturbation method can greatly improve matching performance on this data set. From Fig. 3, it can be seen
that the original match and original non-match distributions overlap. This implies that no score threshold could be set that would result in both 100% true accepts and 100% true rejects. Comparing this to the optimal perturbation distributions, the maximum true match score obtained by this method is 0.2291 and the minimum non-match score is 0.3052. Any threshold value in this interval would yield perfect classification results (no false accepts and no false rejects). Fig. 3 shows six histograms each depicting the relative frequency of shift values in the optimal perturbations of probe images used in the experiment. The optimal perturbed images usually involve a shift of the limbus boundary to the right as is apparent from the large number of right shifts compared to the smaller number of left shifts. Because only left eyes are used in the experiment, this suggests that there is a bias in the segmentation software that offsets the center estimate of the limbus boundary in the nasal direction relative to the true value. In contrast to the performance on the limbus boundary and the evidence of a bias in location, Fig. 3 also shows that segmentation performance on the pupil boundary is quite good. Across the three pupil parameters, the software generated segmentation is often within 1 pixel of the optimal value. This data implies that the -3 to 3 pixel offset search space for the pupil parameters may be larger than needed. This motivated the experiment described next. 2) Reduced Parameter Search Space: We restricted the pupil segmentation parameter search space to offsets of -1,
Match Score Distributions (Liu) 0.25 Original Match Optimum Perturbed Match Perturbed Non−Match Original Non−Match
% in Bins
0.2
0.15
0.1
0.05
0
0.05
0.1
0.15
0.2
0.25
0.3
0.35
0.4
0.45
0.5
Fractional Hamming Distance (Match Score) Fig. 5.
Match and non-match distributions comparing the original segmentations to the perturbed segmentations for the Liu segmentation algorithm.
0 and 1 pixel and ran the same experiment. Fig 4. shows the results of the experiment using this reduced pupil parameter search space. Once again, the optimal perturbed distribution is compared against the original match score distribution, and similar results to those described earlier were obtained. The optimum perturbed matches are better than matches arising from unperturbed segmentations, and there is no significant effect on the non-match score distribution. Fig 4. compares the optimum match score distributions obtained by using the full parameter space and the reduced parameter space. Compared to the the optimal perturbed match distribution on the full parameter space, the same distribution on the reduced parameter space has its mean shifted to right by 0.011 with a standard deviation 0.007 higher indicating that reducing the parameter space does indeed have a slightly negative impact on recognition performance. However, the recognition accuracy rate is still 100% in both cases. B. Liu Segmentations This set of experiments employed the original two-piece linear eyelid detector developed by Liu et al. 1) Full Parameter Search Space: Similar results to the active contours segmentation method are observed when using the Liu segmentation algorithm. The optimal perturbed match distribution is shifted to the left and compressed compared to the original match distribution (Fig. 5). With and without perturbation, this algorithm resulted in a rank-one recognition rate of 100%. Using perturbations, the average match score
improvement was 0.0529. As with the previous algorithm, the non-match distributions of the perturbed and original scores are similar. All distribution data is found in Table 1. 2) Reduced Parameter Search Space: As with the active contours segmentation algorithm, restricting the parameter space for the Liu segmentation method shifts the optimal perturbation match score distribution to the right and widens the distribution compared to the full parameter space. The mean shift amount is 0.0108 and the increase in standard deviation is 0.0030. A comparison of the reduced parameter space optimal perturbation match distribution to the full parameter space distribution is shown in Fig. 6. C. Segmentation Algorithm Comparison In both cases, the mean of the match score distribution decreased relative to the original match distribution mean by applying the perturbation method. The mean of the original match distribution generated by the active contour segmentation algorithm is improved by 32.01% and the mean of the original match distribution mean generated by the Liu segmentation method is improved by 35.53%. The non-match distributions are relatively unaffected with both algorithms. When using the reduced parameter search space, the mean of the original match distribution generated by the active contour segmentation algorithm is improved by 24.84% and the mean of the original match distribution mean generated by the Liu segmentation method is improved by 28.27%.
True Match Scores: Full vs. Reduced (Liu) 0.12 Optimal Perturbed Match (Full) Optimal Perturbed Match (Reduced)
0.1
% in Bins
0.08
0.06
0.04
0.02
0
0
0.05
0.1
0.15
0.2
0.25
0.3
Franctional Hamming Distance (Match Score) Fig. 6. Comparison of the match distributions for the optimum perturbed segmentations on the full and reduced parameter spaces for the Liu segmentation algorithm.
IV. D ISCUSSION
D. Computational Cost of Perturbation Matching The creation of iris code templates from perturbed segmentations potentially carries a nontrivial computational cost. The method incurs the cost of the initial segmentation, S0 , and the normalization/filtering of this segmentation, F0 . In addition to this, the normalization/filtering is performed on every perturbed segmentation, i. Assuming the normalization/filtering cost is the same for every segmentation, this results in a total preprocessing cost of S0 +
X
Fi = S0 + 117649 × F0
(1)
i
if the full parameter search space is used. Using the reduced search space for the pupillary boundary perturbation incurs a cost of S0 + 9261 × F0
(2)
This method becomes increasingly feasible as the ratio of S0 to F0 increases. With the active contour snakes segmentation algorithm, this ratio averages about 10 to 15. In addition to the additional preprocessing cost, every perturbed template used as a probe must also be matched against the gallery. This increases the matching cost by a factor of 117,649 when using the full parameter space and 9,261, when using the reduced parameter space.
The results indicate that by perturbing the segmentations obtained from IrisBEE, recognition performance can be improved. That is, for every template in the probe data set, a perturbed template can be found that better matches the associated gallery template. Further, the perturbation method is robust across two segmentation methods provided by IrisBEE. Drastic performance improvements are seen using both algorithms. By this metric, the perturbation matching method is successful. However, using this as a recognition method carries with it a nontrivial computational burden. Even with a reduction in the parameter space, the computational cost is still too high for many practical applications. A more efficient way to locate the optimum perturbation parameters within the search space is needed to make this method feasible for recognition applications. Currently though, it is a tradeoff of time for increased accuracy. It should also be noted that this method does not find a universally optimum segmentation for an iris. The universal optimum is considered to be the segmentation that contains as much iris texture as possible while at the same time minimizing the non-iris artifacts it contains. The perturbation method instead finds an optimum segmentation that best matches an already enrolled gallery template, which may have a slightly incorrect segmentation. In essence, it adjusts the probe images
to account for noise present in the gallery data caused by minor imperfections in the segmentation at enrollment. V. C ONCLUSIONS We have shown that it is possible to greatly improve recognition performance by perturbing software generated segmentations. The computational cost currently prevents this method from being employed in a recognition system. This cost must be reduced, and potentially could be through more intelligent searches for optimum perturbation values for a given template. One such method is proposed here. If the parameter space is partitioned into a number of subspaces, representative points from each subspace may be chosen and used to perturb the original segmentation. Some of these perturbations should yield a score improvement and some should not. Using this information, some of the subspaces could be eliminated from further consideration. The remaining subspaces are then combined and repartitioned. The above process repeats until no score improvement is found. Ideally, this searching method would eliminate at least half of the subspaces at each iteration. This in turn reduces the number of iterations to a log factor of the initial parameter space which makes the perturbation method much more practical as a recognition algorithm. This will be further explored in future work. ACKNOWLEDGMENT We would like to thank the reviewers for their comments and suggestions for future work.
This work is supported by the Federal Bureau of Investigation, the Central Intelligence Agency, the Intelligence Advanced Research Projects Activity, the Biometrics Task Force, and the Technical Support Working Group through US Army contract W91CRB-08-C-0093. The opinions, findings, and conclusions or recommendations expressed in this publication are those of the authors and do not necessarily reflect the views of our sponsors. R EFERENCES [1] T. Riopka and T. Boult, “The eyes have it,” in Proc. ACM SIGMM Biometrics methods and applications (WBMA’03), 2003, p. 9. [2] J. Min, K. Bowyer, and P. Flynn, “Eye perturbation approach for robust recognition of inaccurately aligned faces,” Lecture Notes in Computer Science, no. 3546, pp. 41–50, 2005. [3] L. Masek, “Recognition of human iris patterns for biometric information,” Master’s thesis, Massachusetts Institute of Technology, University of Western Australia, 2003. [4] X. Liu, K. Bowyer, and P. Flynn, “Experiments with an improved iris segmentation algorithm,” in Proc. Fourth IEEE Workshop Automatic Identification Technologies (’05), 2005, pp. 118–123. [5] M. Kass, A. Witkin, and D. Terzopoulos, “Snakes: Active contour models,” International Journal of Computer Vision, vol. 1, no. 4, pp. 41–50, Jan. 2005. [6] J. Daugman, “How iris recognition works,” IEEE Transactions on Circuits and Systems for Video Technology, vol. 14, no. 1, Jan. 2004. [7] NIST. (2008) Iris challenge evaluation 2005 workshop presentations. [Online]. Available: http://iris.nist.gov/icepresentations.htm [8] LG. (2009, Mar.). [Online]. Available: http:/www.lgiris.com/ [9] K. Hollingsworth, K. Bowyer, and P. Flynn, “The best bits in an iris code,” IEEE Transactions on Pattern Analysis and Machine Intelligence, vol. 31, no. 6, pp. 964–973, Jun. 2009.