IEEE TRANSACTIONS ON POWER DELIVERY, VOL. 30, NO. 4, AUGUST 2015
1965
Improved Online Monitoring Method for Transformer Winding Deformations Based on the Lissajous Graphical Analysis of Voltage and Current Chenguo Yao, Member, IEEE, Zhongyong Zhao, Yan Mi, Member, IEEE, Chengxiang Li, Yifan Liao, and Guochao Qian
Abstract—Power transformers have important roles as voltage converters in substations, which directly affect the safe operation of power grids. Online monitoring of winding deformation, which is one of the most common transformer faults, is crucial in protecting transformers from damage, particularly those induced by short-circuit current failures, and ensuring their safe operation. This study proposes an improved online monitoring method for winding deformations based on the Lissajous graphical analysis of voltage and current. A practical measurement system is also presented and discussed in this paper. A load normalization method is proposed to solve the problem of Lissajous diagrams changing as load varies. Finally, transformer and winding experiments are performed to verify the validity of the proposed load normalization method and the feasibility of the proposed monitoring method in distinguishing winding deformations with different degrees and locations. Index Terms—Lissajous graphical analysis, load normalization, winding deformation.
I. INTRODUCTION
T
HE transformer is one of the most important pieces of electrical equipment in power networks [1], and its safe operation is crucial in power systems. Considering the complex structure of a transformer, a large amount of manpower, material resources, and time is required for maintenance when failures occur, which impair normal grid operation and reduce economic efficiency. Winding deformation is considered as one of the most common causes of transformer failure [1],
Manuscript received August 22, 2014; revised November 18, 2014, February 08, 2015; accepted March 28, 2015. Date of publication April 14, 2015; date of current version July 21, 2015. This work was supported by the National Natural Science Foundation of China under Grants 51377175, 51321063 and in part by the National Engineering Laboratory for Ultra High Voltage Engineering Technology (Kunming, Guangzhou) (CSGTRC[2014]Q1406B12). Paper no. TPWRD-01006-2014. C. G. Yao, Z. Zhao, Y. Mi, and C. X. Li are with the State Key Laboratory of Power Transmission Equipment and System Security and New Technology, School of Electrical Engineering, Chongqing University, Chongqing 400044, China (e-mail:
[email protected];
[email protected]). Y. F. Liao is with the Electric Power Research Institute, CSG, Guangzhou 510062, China. G. C. Qian is with the Electric Power Research Institute of Yunnan Electric Power Test Research Institute (Group) Ltd., Kunming 650217, China. Color versions of one or more of the figures in this paper are available online at http://ieeexplore.ieee.org. Digital Object Identifier 10.1109/TPWRD.2015.2418344
[2]. A slight winding deformation tends to be neglected because of its minimal influence on transformer operation [2]. As winding deformations develop and accumulate, once an external short-circuit failure occurs, windings will suffer from severe deformations because of large electromagnetic forces. Consequently, the transformer will be seriously damaged and widespread power outages may occur [3]. Through online monitoring techniques, severe transformer winding deformations can be detected, which enables concerned personnel to deal with short-circuit current failures that can strongly affect the electromagnetic transient process. Numerous investigations have been conducted in the field of winding deformation detection. The short-circuit impedance method [4]–[7]; frequency-response analysis method [8]–[11]; ultrasonic measurement method [12]; electromagnetic-wave method [13]; vibration response method [14]; and other winding deformation detection methods have been proposed and developed; however, in [1], all of the aforementioned methods are discussed in detail. Among these, the short-circuit impedance method and the frequency-response analysis method are relatively noninvasive, accurate, and reliable [1]. Therefore, these two methods exhibit better prospects for improvement [15]. In [16], the transformer was suggested to be equivalent to a two-port network, and the winding consists of distributed resistances, inductances, and capacitances. Based on a series of experiments, a relation was found between equivalent circuit elements and winding deformation types in the literature [17]. The preceding two conclusions provide the theoretical and experimental foundations of electrical detection methods. Recently, the short-circuit impedance method was developed as an online monitoring technique. In [4], an online method to calculate short-circuit impedance was proposed. In [5], the short-circuit impedance method was evaluated through online measurement and simulation, and the transformer operation status was found to have a minimal effect on short-circuit impedance. In [6], an online graphical voltage and current method was proposed to analyze winding deformations. This method complements the short-circuit impedance method, which has few criterion parameters. Meanwhile, a finite-element method was presented in [7] to improve the accuracy and reliability of short-circuit impedance calculation results. Moreover, the frequency-response analysis method was developed as a specification mode with certain criteria. According to [8], the main equivalent circuit elements of winding change
0885-8977 © 2015 IEEE. Personal use is permitted, but republication/redistribution requires IEEE permission. See http://www.ieee.org/publications_standards/publications/rights/index.html for more information.
1966
IEEE TRANSACTIONS ON POWER DELIVERY, VOL. 30, NO. 4, AUGUST 2015
as frequency increases. A subanalysis of frequency response should be conducted. In [9], a pulse source was used to inject high-frequency pulses into the transformer winding, and the obtained pulse response was applied to analyze winding deformations. In [10] and [11], an electric power industry standard and an International Electrotechnical Commission standard were, respectively, proposed for the frequency-response analysis method. All of the aforementioned studies have contributed greatly to the development of diagnostic techniques for transformer winding deformations. However, difficulties remain in the area of online monitoring. For example, the existing online short-circuit impedance method only reflects changes in winding inductance values, and its accuracy has been a point of contention among researchers [1]. In addition, the power source required in the frequency-response method is different from that of power transformers; thus, this method is hardly used when the transformer is in service [9]. Based on the aforementioned important works, particularly [6], this study proposes an improved online monitoring method for transformer winding deformations based on the Lissajous graphical analysis of transformer voltage and current. Compared with online techniques presented in existing literature [6], where voltage and current are measured using potential transformers (PTs) and current transformers (CTs), respectively, this study proposes and develops a practical measurement system that avoids errors from PTs and CTs and collects complete waveforms. Furthermore, the proposed system considers the load impedance value. A load normalization method is then proposed for Lissajous diagrams changed by load. Finally, transformer and winding experiments are conducted to verify the feasibility and effectiveness of the proposed method.
Fig. 1. Equivalent model of the transformer: (a) equivalent circuit of the transformer and (b) phasor diagram [6].
Based on (4), can be substituted into (2). Equation (5) then indicates the relation between and as follows:
(5) The parameters in (6), as follows:
, and
are described as
, and
(6)
II. BASIC PRINCIPLE This study proposes an improved online monitoring method for transformer winding deformations based on the Lissajous graphical analysis of voltage and current. The method provides four Lissajous diagram parameters to identify faults in winding deformation analysis, namely: 1) the long axis (a); 2) the short axis (b); 3) the slope (k); and 4) the eccentricity (e). In the proposed method, the current signal will be measured using current transform through inductive coupling. Meanwhile, the voltage signal will be measured using a homemade capacitive voltage divider through capacitive coupling, which will not change any power grid connection nor affect its normal operation. A. Lissajous Graphical Analysis The relation between any two cosine values with the same frequency can be obtained by eliminating the common parameter as follows: (1) (2) Equation (2) can be transformed into (3) as follows:
Meanwhile,
, and
comply with (7) as follows: (7)
Equation (5) will represent an ellipse of y1 and y2 (Lissajous diagram) if the value of (7) is less than 0. Transformers require absorbing power from a power source. In the phasor diagram in Fig. 1(b), the phase between voltage and current cannot reach 180 ; consequently, the value of (7) is certainly less than 0. The four parameters in the Lissajous diagram of voltage and current, that is, a, b, k, e, can reflect the changes in equivalent circuit elements, as shown in Fig. 1(a). By using the four parameters, winding deformation can be analyzed comprehensively, thereby improving the reliability and validity of winding deformation judgments. However, voltage and current under switching, lightning, and inrush current will not be used to analyze the Lissajous diagram to avoid the effects of harmonics and saturation when a voltage swell occurs. In Fig. 2, . B. Measurement Configuration
(3) (4)
The proposed method for Lissajous graphical analysis requires transformer voltage and current. The voltage and cur-
YAO et al.: IMPROVED ONLINE MONITORING METHOD FOR TRANSFORMER WINDING DEFORMATIONS
1967
Fig. 2. Lissajous diagram of voltage and current. Fig. 4. Equivalent linear two-port circuit: (a) equivalent linear two-port circuit and (b) load that is substituted by a current source.
C. Influence Factors
Fig. 3. Measurement mode.
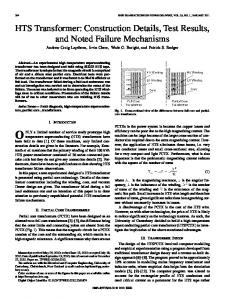
rent of windings in the high-voltage (HV) and low-voltage (LV) sides are analyzed using Lissajous diagrams to detect single winding deformations. The voltage and current of windings in each phase are also analyzed through Lissajous diagrams to detect one-phase winding deformations. The measurement configuration is shown in Fig. 3, using the transformer windings of the wye-delta connection as an example. For HV windings, input voltages are measured using capacitive coupling sensors (CCSs), whereas input currents are measured using CTs. If the neutral point is connected to the ground, a CT will be installed to measure neutral point current , and the Lissajous diagram of will be analyzed. If the neutral point is not directly connected to ground, a CCS will be installed to measure neutral point voltage , and the Lissajous diagram of will be analyzed. For LV windings, output voltages are measured using CCSs, whereas output currents are measured using CTs. The Lissajous diagram of will then be analyzed. For one-phase windings, input and output voltages are both measured using CCSs, whereas input and output currents are both measured using CTs. The Lissajous diagram of or will also be analyzed.
Transformer load varies during operation. Although several measures are taken to ensure grid stability, the property and value of load slightly change within a certain period. In addition, if winding deformation occurs, then the elements of the transformer equivalent circuit will change. In both situations, the Lissajous diagrams will also change. Therefore, the load must be normalized to avoid misjudging winding deformations. According to [6], the property of load will not change the Lissajous diagram; hence, the present study mainly considers the value of load. In addition, transformers may operate with nonlinear characteristics because nonlinear magnetic materials are used in transformers [18]. However, under normal operating conditions, the magnetic flux does not exceed 1.1 times the rated flux. This value is considerably less than the saturation magnetic flux, which is 1.4 times the rated flux [19]. Therefore, core saturation could be eliminated when the operating point for transformers is chosen properly to avoid falling in the saturation region. By contrast, transformers can be described through a linear T-equivalent circuit under power frequency working conditions. Therefore, in engineering, a transformer operates with linear characteristics under steady state. In addition, a transformer will still attempt to function under normal conditions for a short period after a short-circuit fault occurs. Therefore, current and voltage under normal operating conditions can be used for Lissajous graphical analysis. A transformer can be described as a linear two-port circuit, as shown in Fig. 4(a), where mary voltage;
is the primary current;
is the pri-
is the secondary
; and is the secvoltage, that is, the voltage on the load ondary current. Following a substitution theorem, load could be substituted by a current source with current 4(b).
, as is shown in Fig.
can be regarded as the combined actions of
Suppose
is the response of
secondary circuit is open, and
and
.
on the primary side when the is the response of
on the
1968
IEEE TRANSACTIONS ON POWER DELIVERY, VOL. 30, NO. 4, AUGUST 2015
Fig. 5. Equivalent linear two-port circuit when changes. (a) Equivalent changes and (b) load is substituted by a current linear two-port circuit when source.
primary side when the primary circuit is shorted. Based on a superposition theorem [20],
can be obtained through (8) (8)
When load varies from
to
, and
Fig. 6. Noninvasive voltage measurement sensor: (a) CCS and (b) capacitive voltage divider.
can be eliminated through parameter conversion when Lissajous ellipses are drawn
change to
, and , respectively, as shown in Fig. 5(a). is the network voltage that remains unchanged. A substitution theorem is also used in this case, as shown in Fig. 5(b). Suppose response Then,
, and
induces response
induces
on the primary side.
can be obtained through (9)
Following the linear homogeneity theorem [19], the relation between
and
can be described in (10) (10)
where represents the relative change in load current when load impedance changes, which can be determined through measurement. Based on (8)–(10),
(12)
can be rewritten as (11)
is the no-load current on the primary side when the secondary circuit is open, which is relatively small compared with the current when the transformer has a load. In most cases, the value is only 3% of the load current. Therefore, in engineering, (11) can be simplified into (12). The influence of load change
III. MEASUREMENT SYSTEM To apply the proposed method in practice, transformer power frequency voltages and currents should be measured and used for analysis. The Nyquist sampling theorem suggests that the upper cutoff frequency of a measurement system should be at least twice as large than the signal frequency. In engineering, however, this value can reach 20 times; that is, the working frequency band of the measurement system should reach 1 kHz to obtain a complete waveform [21]. A. Working Principle The proposed method can use installed transformer PTs and CTs. However, a set of noninvasive voltage and current measurement sensors based on the CCS and Pearson coil, which has a minimal effect on transformer operation, was developed to measure signals when a transformer is in service and, therefore, avoid the effects of PT and CT errors and the frequency band on Lissajous analysis. Capacitive bushing is constructed through the inner insulation of a coaxial cylindrical capacitor and external porcelain insulation. A CCS is proposed and developed based on the bushing structure, which will not affect the normal operation of power equipment. The mounting position of the CCS is shown in Fig. 6(a). The CCS is light and portable. A metal strip is wrapped around the bushing external insulation near the grounded flange and configured with the interface. The
YAO et al.: IMPROVED ONLINE MONITORING METHOD FOR TRANSFORMER WINDING DEFORMATIONS
1969
Fig. 8. Real capacitive voltage divider: (a) part 1 for the dividing voltage and (b) part 2 for the integrating waveform.
Fig. 7. Simulation analysis: (a) equivalent circuit and (b) simulation analysis result.
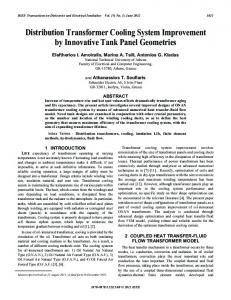
length of the metal strip is determined using the diameter of the external insulating bushing layer, but is slightly longer. The length can be adjusted using a clip to suit the external bushing layer. The width of the metal strip is 20 mm, and its thickness is approximately 2 mm. The metal strip is made of red copper, the clip is made of plastic, and the interference is made of stainless steel. The metal strip, inner conductor, and bushing layers form the stable capacitor [22], [23]. The CCS is then connected to the capacitive voltage divider to restore the measured waveforms and transform them into smaller values [24]. As shown in Fig. 6(b), the Cs and CCS on the left side divide the measured voltage, whereas the Rp and Cs on the right side integrate the measured waveforms. This voltage measurement sensor uses two-stage protective devices to suppress overvoltage and protect the dataacquisition equipment, which consists of a gas discharge tube and a varistor, as represented by G and K, respectively, in Fig. 6. The threshold values of protective devices are determined based on the corresponding data-acquisition equipment. B. Simulation Analysis The entire noninvasive voltage measurement sensor can be described as the circuit in Fig. 7(a). This circuit is modeled and simulated in Pspice, where the value of is calculated following a real 10-kV bushing structure. The result shows that the dividing ratio of the noninvasive voltage measurement sensor is 15730 and the working band ranges from 0 to 5.2 MHz, as shown in Fig. 7(b). C. Noninvasive Voltage Measurement Sensor Tests The real capacitive voltage divider is shown in Fig. 8. To obtain the voltage dividing ratio and the working frequency band of the noninvasive voltage measurement sensor, tests were performed in an electromagnetic shielding laboratory, and the test wiring is shown in Fig. 9. The CCS was installed around a
Fig. 9. Test wiring diagram.
10-kV porcelain bushing. A 50-Hz HV voltage source and a controllable nanosecond pulse generator were used to measure the voltage divider ratio and the working frequency band. Random noise was observed during the tests, the mathematical expectation of which was 0. Therefore, reducing the influence of noise by averaging the test data is effective. Each test was performed 100 times, and the average values were used for analysis. The measured waveforms in the 50-Hz tests are shown in Fig. 10(a), wherein the blue wave is from the 50-Hz HV source with an average amplitude of 6.8 kV, whereas the green wave is from the noninvasive voltage measurement sensor with an average amplitude of 437 mV. The voltage dividing ratio is 15550, as shown in Fig. 10(b). The measured waveforms in the pulse response tests are shown in Fig. 10(c), where the green wave is the pulse from the nanosecond pulse generator with a pulsewidth of 2000 ns, and the blue wave is the response from the noninvasive voltage measurement sensor. The working frequency reaches 4 MHz, as shown in Fig. 10(d). IV. CONFIRMATORY EXPERIMENT A. Transformer Experiment To verify the feasibility of the proposed method, experiments were conducted on an actual 110-kV transformer. The rated frequency of the tested transformer was 50 Hz, the rated capacity was 31.5 MVA, the rated transformation ratio was
1970
IEEE TRANSACTIONS ON POWER DELIVERY, VOL. 30, NO. 4, AUGUST 2015
Fig. 11. Tested transformer: (a) actual picture and (b) a section of the configuration.
Fig. 12. Transformer Lissajous diagrams of HV windings: (a) grounded neutral point and (b) ungrounded neutral point.
Fig. 10. Test results: (a) measured 50-Hz waveforms, (b) 50-Hz experiment analysis results, (c) measured pulse waveforms, and (d) pulse experiment analysis results.
110 kV/10.5 kV, and the transformer winding was wye connection on the HV side and delta connection on the LV side. This
transformer was overhauled, and the windings of each phase were healthy. The test configuration was set as shown in Fig. 3, and the test voltage source could produce a sinusoidal signal of 50 Hz. The load consisted of 300- resistance. The tested transformer and a section of the experiment configurations are shown in Fig. 11. The voltage and current of HV and LV windings can be measured to draw different Lissajous diagrams. However, only the Lissajous diagrams of HV windings were presented as examples because of the wide variety of Lissajous ellipses. Experiments were performed under grounded and ungrounded configurations of the HV windings neutral point. When the neutral point of the HV winding was grounded, input voltage , input current , and neutral point current were measured for the Lissajous graphical analysis of and . When the neutral point of HV windings was ungrounded, input voltage , neutral-point voltage ,
YAO et al.: IMPROVED ONLINE MONITORING METHOD FOR TRANSFORMER WINDING DEFORMATIONS
1971
TABLE I LOAD NORMALIZATION RESULTS (UNGROUNDED NEUTRAL POINT)
Fig. 13. Lissajous diagrams when load impedance changes.
Fig. 14. Lissajous diagrams when load is normalized.
C. Experiments on Winding Typical Faults and neutral-point current were measured for the Lissajous graphical analysis of and . The Lissajous diagrams of the three-phase HV windings are nearly the same under the two connection configurations, as shown in Figs. 12(a) and (b), respectively. Similar experimental results can be obtained when the Lissajous diagrams of LV windings are drawn. These results are consistent with the finding that the windings of each phase are nearly identical. B. Load Normalization Experiments with different loads were conducted to study the influence of load impedance on transformer Lissajous diagrams. In this test, the neutral point of the tested transformer was ungrounded, and the transformer loads were set to 15-, 20-, and 30- resistances. As shown in Fig. 13, Lissajous diagrams vary when the value of load impedance changes. To avoid the effect of transformer load impedance fluctuation on the Lissajous diagrams, the load should be normalized. The normalization method proposed in this study suggests that the voltage and current of the windings can be converted to their corresponding values when load impedance is the initial value. The load normalization results of the previous experiment are presented in Table I. In this table, the voltage and current values when load resistances were 20 and 30 were converted to their corresponding values when load resistance was 15 . Using the converted voltage and current values, the Lissajous diagrams were redrawn (Fig. 14). The table and figure show that voltage, current, and the Lissajous diagram are nearly identical under different loads of 15-, 20-, and 30- resistances when they were normalized to a specific value.
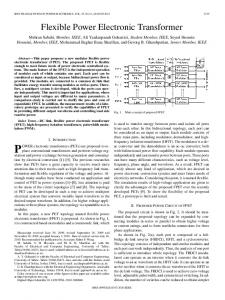
To verify whether the proposed method can detect winding deformations, a healthy 10-kV winding was used in typical faults experiments. Considering that a short-circuit fault is the most common winding deformation fault [6], it was chosen as an example for the experiments. A 50-Hz voltage source was used as the external voltage source, and a 300- resistance was used as the load. First, the short-circuit faults of 2, 5, and 10 turns were set at the end of the winding for the fault experiments in the same locations. Then, the short-circuit faults of 5 turns were set at the end and at the middle of the winding for the fault experiments in different locations. The obtained Lissajous diagrams are shown in Fig. 15, and the corresponding power frequency parameters and Lissajous parameters are shown in Table II. Furthermore, the differences between the Lissajous diagrams of the healthy and faulty windings are shown in Table III. The results show that as the degree of short-circuit faults increase at the end of the winding, the Lissajous diagram parameters change, particularly the short axis in each case. Maximum changes occur at the five-turn short-circuit fault. The equivalent circuit clearly changes when a short-circuit fault occurs. Consequently, the Lissajous diagrams change. However, as the degrees of short-circuit faults increase, the Lissajous diagrams do not change linearly because as fault turns increase, the fault location will draw closer to the middle of the winding, where fault occurrence has an important role in affecting changes. The Lissajous diagrams for the five-turn short circuit faults at the end and at the middle of the winding also exhibit differences, but the difference is small compared with those of other faults. The results also show that the middle short-circuit fault changes less at the long axis and more remarkably at the short
1972
IEEE TRANSACTIONS ON POWER DELIVERY, VOL. 30, NO. 4, AUGUST 2015
TABLE II SHORT-CIRCUIT FAULT RESULTS
TABLE III PARAMETER CHANGES IN SHORT-CIRCUIT FAULTS
axis and slope compared with the short-circuit fault at the end of the winding. In summary, the parameters of the Lissajous diagram change with different fault locations and fault degrees. In addition, the short axis changes significantly even with only two turns of the short-circuit fault, which indicates that the short axis of Lissajous ellipses is sensitive to winding faults, and that the proposed method may reach the potential to detect slight winding deformation. V. CONCLUSION
Fig. 15. Lissajous diagrams of a short-circuit fault: (a) Lissajous diagram of a short-circuit fault, (b) short axis of a short-circuit fault (partially enlarged detail), and (c) long axis and slope of a short-circuit fault (partially enlarged detail).
This study proposed an improved online monitoring method of transformer winding deformations. The Lissajous diagram was constructed for winding fault analysis. Then, a set of measurement systems based on the capacitive coupling and inductive coupling principle was proposed and developed. A load normalization method was then presented to address the effect of load on the Lissajous diagrams. Finally, transformer and winding experiments were performed using the measurement system. The results indicate that the proposed method exhibits the potential to detect slight winding deformations. In addition, faults with different degrees and locations may be distinguished. Future research requires other winding typical fault experiments, data analyses, simulations, and pattern-identification studies.
YAO et al.: IMPROVED ONLINE MONITORING METHOD FOR TRANSFORMER WINDING DEFORMATIONS
REFERENCES [1] M. Bagheri, M. S. Naderi, and T. Blackburn, “Advanced transformer winding deformation diagnosis: Moving from off-line to on-line,” IEEE Trans. Dielectr. Electr. Insul., vol. 19, no. 6, pp. 1860–1870, Dec. 2012. [2] E. G. Luna, G. A. Mayor, C. G. Garcia, and J. P. Guerra, “Current status and future trends in frequency-response analysis with a transformer in service,” IEEE Trans. Power Del., vol. 28, no. 2, pp. 1024–1031, Apr. 2013. [3] W. Ziomek, K. Vijayan, D. Boyd, K. Kuby, and M. Franchek, “High voltage power transformer insulation design,” in Proc. IEEE Elect. Insul. Conf., Annapolis, MD, USA, 2011, pp. 211–215. [4] E. Arri, A. Carta, F. Mocci, and M. Tosi, “Diagnosis of the state of power transformer windings by on -line measurement of stray reactance,” IEEE Trans. Instrum Meas., vol. 42, no. 2, pp. 372–378, Apr. 1993. [5] D. K. Xu and Y. M. Li, “A simulating research on monitoring of winding deformation of power transformer by on-line measurement of short-circuit reactance,” in Proc. IEEE Int. Conf. Power Syst. Technol., 1998, vol. 1, pp. 167–171. [6] A. A. Siada and S. Islam, “A novel online technique to detect power transformer winding faults,” IEEE Trans. Power Del., vol. 27, no. 2, pp. 849–857, Apr. 2012. [7] S. Q. Yu, S. Jiang, and W. Li, “Research on the deformation of transformer windings based on the analysis of short circuit reactance,” in Proc. Power Eng. Autom. Conf., 2011, pp. 240–243. [8] J. B. Jenson, B. B. Jenson, S. D. Mikkelsen, and C. G. Jensen, “Parametric identification in potential transformer modeling,” IEEE Trans. Power Del., vol. 7, no. 1, pp. 70–76, Jan. 1992. [9] T. De Rybel, A. Singh, J. A. Vandermaar, M. Wang, J. R. Marti, and K. D. Srivastava, “Apparatus for online power transformer winding monitoring using bushing tap injection,” IEEE Trans. Power Del., vol. 24, no. 3, pp. 996–1003, Jul. 2009. [10] Frequency Response Analysis on Winding Deformation of Power Transformers, DL/T911-2004, ICS27.100, F24, Doc. no. 15182-2005, People Republic of China, Electric Power Industry Standard, Jun. 1, 2005. [11] Measurement of Frequency Response, IEC standard 60076-18, Ed. 1.0, 2012-07. [12] N. Q. Shu, C. Zhou, F. HU, Q. S. Liu, and L. W. Zheng, “Study on ultrasonic measurement device for transformer winding deformation,” in Proc. IEEE CNF Int. Conf., Power Syst. Technol., 2002, vol. 16, no. 13, pp. 1401–1404. [13] M. A. Hejazi, M. Choopani, M. Dabir, and G. B. Gharehpetian, “Effect of antenna position on on-line monitoring of transformer winding axial displacement using electromagnetic waves,” in Proc. IEEE 2nd Int. Power Energy Conf., 2008, pp. 44–49. [14] A. Sokolov, Z. Berler, and V. Rashkes, “Effective methods of assessment of insulation system conditions in power transformers: A view based on practical experience,” in Proc. Elect. Insul. Conf. Elect. Manuf. Coil Winding Conf., 1999, pp. 659–667. [15] M. Bagheri, M. S. Naderi, T. Blackburn, and T. Phung, “Frequency response analysis and short-circuit impedance measurement in detection of winding deformation within power transformers,” IEEE Electr. Insul. Mag., vol. 29, no. 3, pp. 33–40, May/Jun. 2013. [16] A. Miki, T. Hosoya, and K. Okuyama, “A calculation method for impulse voltage distribution and transferred voltage in transformer windings,” IEEE Trans. Power App. Syst., vol. PAS-97, no. 3, pp. 930–939, May 1978. [17] T. McGrail, “SFRA basic analysis,” Doble Eng. Co., vol. 1, pp. 1–32, 2003. [18] S. R. Huang, S. C. Chung, B. N. Chen, and Y. H. Chen, “A harmonic model for the nonlinearities of single-phase transformer with describing functions,” IEEE Trans. Power Del., vol. 18, no. 3, pp. 815–820, Jul. 2003. [19] W. Y. Tang, Electrical Machinery (in Chinese), 4th ed. Beijing, China: China Machine Press, 2011.
1973
[20] C. K. Alexander and M. N. O. Sadiku, Fundamentals of Electric Circuits, 5th ed. New York, USA: McGraw-Hill Higher Education,, 2012. [21] Y. M. He and S. G. Dai, “The theory and realization of signal reconstruction,” in Proc. 1st Int. Conf. Inf. Sci. Eng., 2009, pp. 707–709. [22] A. Setayeshmehr, A. Akbari, H. Borsi, and E. Gockenbach, “On-line monitoring and diagnoses of power transformer bushings,” IEEE Trans. Dielectr. Electr. Insul., vol. 13, no. 3, pp. 608–615, Jun. 2006. [23] A. Akbari, H. Borsi, E. Gockenbach, and M. Hadighi, “Experiences with a non-invasive capacitive sensor for on-line partial discharge detection in power transformers,” in Proc. ETG-Fachtagung “Diagnostik Elektrischer Betriebsmittel”, Köln, Germany, 2004, pp. 301–304. [24] K. W. Struve, M. L. Horry, and R. B. Spielman, “Design, calibration and performance of water diagnostics on the PBFA,” in Proc. IEEE 11th Int. Pulsed Power Conf., Baltimore, MD, USA, 1997, pp. 1304–1306.
Chenguo Yao (M’08) was born in Nanchong, Sichuan, China, on February 1, 1975. He received the B.S., M.S., and Ph.D. degrees in electrical engineering from Chongqing University, Chongqing, China, in 1997, 2000, and 2003, respectively. He became a Professor with the School of Electrical Engineering, Chongqing University, in 2007. His current works include pulse power technology and its application in biomedical engineering, online monitoring of insulation condition, and insulation fault diagnosis for high-voltage apparatus.
Zhongyong Zhao was born in Guangyuan, Sichuan, China, on October 1, 1988. He received the B.S. degree in electrical engineering from Chongqing University, Chongqing, China, in 2011, where he is currently pursuing the Ph.D. degree in combination with the M.Sc.—Ph.D. degree in electrical engineering. His areas of research include pulse power technology, online monitoring of insulation condition, and insulation fault diagnosis for high-voltage apparatus.
Yan Mi (M’11) was born in Yueyang, China, on September 20, 1978. He received the B.S., M.S., and Ph.D. degrees in electrical engineering from Chongqing University, Chongqing, China, in 2000, 2003, and 2009, respectively. Currently, he is an Associate Professor with the School of Electrical Engineering, Chongqing University. His areas of research include online monitoring of insulation condition, and insulation fault diagnosis for high-voltage apparatus, and pulse power technology and its application in biomedical engineering.
Chengxiang Li was born in Shandong, China, in 1980. He received the B.S, M.S., and Ph.D. degrees in electrical engineering from Chongqing University, Chongqing, China, in 2002, 2005, and 2011, respectively. Currently, he is an Associate Professor with the School of Electrical Engineering, Chongqing University. His areas of research interests include online monitoring of insulation condition, and insulation fault diagnosis for highvoltage apparatus.
Yifan Liao, photograph and biography not available at the time of publication.
Guochao Qian, photograph and biography not available at the time of publication.