AG034962 (ALJ); U01-AG024904 (ADNI); American Federation for Aging. Research Medical Student Training in Aging Research Grant (JS); P30-EY008126.
A Semi-automated Method for Quantifying Infarcts in Older Adults With and Without Dementia AL Jefferson,1,2 GW Chapman,2 J Sparling,3 D Seichepine,2,3 KA Gifford,1,2 N Cantwell,2,3 B Martin,2,4 V Dobromyslin,5 D Salat 5,6 1Vanderbilt
University Medical Center, Nashville, TN; 2Boston University Alzheimer’s Disease Center, Boston, MA; 3Boston University School of Medicine, Boston, MA; 4Data Coordinating Center, Boston University Medical Campus, Boston, MA; 5VA Boston Healthcare System, Boston, MA; 6Harvard Medical School, Cambridge, MA
Background & Hypothesis
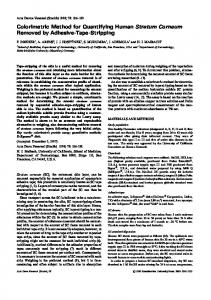
Figure 1. Infarct Detection Protocol
Table 1. Participant Characteristics NC (n=10)
MCI (n=10)
AD (n=10)
Age, years
76±7
75±10
80±8
Sex, % female
10
60
50
Education, years
17±3
16±2
14±3
Race, % white
70
90
100
Cerebral infarcts are associated with worse cognition among older adults. The gold standard for measuring infarcts is via manual rating, which is a labor intensive process.
A
We sought to develop a more efficient and reliable semi-automated method for quantifying infarcts among older adults with normal cognition (NC), mild cognitive impairment (MCI), and Alzheimer’s disease (AD).
Methods Participants included 30 individuals from the Alzheimer's Disease Neuroimaging Initiative. Individuals were randomly selected within each diagnostic group to include 10 NC, 10 MCI, and 10 AD. See Table 1 for participant characteristics.
B
Table 2. Infarct Results Infarct Number
Infarct Volume (mL)
Infarct Number False Positives
Infarct Number Inter-rater Reliability
Infarct Volume Inter-rater Reliability
NC
3.8±5.3
787.7±902
36.6±2.09
0.97±0.03
0.98±0.04
MCI
1.6±1.4
338.6±533
32.5±10.40
0.99±0.01
0.99±0.02
AD
1.0±1.2
394.8±1109
27.5±7.94
0.99±0.00
0.99±0.01
Neuroimaging data was post-processed and analyzed using FreeSurfer and FMRIB Statistical Library.
1.5T generated T1, T2, and PD weighted MRI images were coregistered and masked to the FreeSurfer identified white matter. Subcortical and periventricular regions were subtracted from the images.
Tissue abnormalities were automatically detected within white matter and defined as signal intensity two standard deviations outside the normal intensity for each region of interest across each modality (T1, T2, PD). From these defined tissue abnormalities, infarct seeds were created by applying a 3mm length threshold. Seeds were then grown to include surrounding voxels, including a lower threshold. See Figure 1 for illustration.
C
Conclusions
Resulting infarct labels were manually confirmed by two independent raters,
Data suggests our semi-automated method for infarct identification and volume
blinded to clinical information.
quantification is reliable. However, much additional work is needed to refine the method for detecting infarcts (i.e., decrease the number of false positives).
Results The automated algorithm produced a high number of false-positive findings (31.7±9.7 infarcts/participant) across all diagnostic groups (see Table 2).
Across the diagnostic groups, the raters confirmation of infarcts was highly concordant, resulting in strong inter-rater reliability for both number of infarcts (r=0.98, p