Sep 11, 2015 - 6Department of Geographical Sciences, University of Maryland,. College ... 10Department of Physics and Astronomy, Saint Mary's College of.
A Semiautomated Probabilistic Framework for Tree Cover Delineation from 1-m NAIP Imagery Using a High Performance Computing Architecture Saikat Basu1 , Sangram Ganguly2 , Ramakrishna Nemani3 , Supratik Mukhopadhyay1 , Gong Zhang2 , Cristina Milesi4 , Andrew Michaelis5 , Petr Votava5 , Ralph Dubayah6 , Laura Duncanson6 , Bruce Cook7 , Yifan Yu8 , Sassan Saatchi9 , Robert DiBiano1 , Manohar Karki1 , Edward Boyda10 , Uttam Kumar11 and Shuang Li5 1
Department of Computer Science, Louisiana State University Bay Area Environmental Research Institute/ NASA Ames Research Center 3 NASA Advanced Supercomputing Division/ NASA Ames Research Center 4 Biospheric Science Branch, NASA Ames Research Center 5 NASA Ames Research Center & University Corporation Monterey 6 Department of Geographical Sciences, University of Maryland, College Park 7 NASA Goddard Space Flight Center, Biospheric Sciences Laboratory, 8 Department of Atmospheric and Ocean Sciences, University of California at Los Angeles 9 Jet Propulsion Laboratory, California Institute of Technology 10 Department of Physics and Astronomy, Saint Mary’s College of California 11 Oak Ridge Associated Universities/NASA Ames Research Center
2
September 11, 2015
1
Abstract Accurate tree cover estimates are useful to derive Above Ground Biomass (AGB) density estimates from Very High Resolution (VHR) satellite imagery data. Numerous algorithms have been designed to perform tree cover delineation in high to coarse resolution satellite imagery, but most of them do not scale to terabytes of data, typical in these VHR datasets. In this paper, we present an automated probabilistic framework for the segmentation and classification of 1-m VHR data as obtained from the National Agriculture Imagery Program (NAIP) for deriving tree cover estimates for the whole of Continental United States, using a High Performance Computing Architecture. The results from the classification and segmentation algorithms are then consolidated into a structured prediction framework using a discriminative undirected probabilistic graphical model based on Conditional Random Field (CRF), which helps in capturing the higher order contextual dependencies between neighboring pixels. Once the final probability maps are generated, the framework is updated and re-trained by incorporating expert knowledge through the relabeling of misclassified image patches. This leads to a significant improvement in the true positive rates and reduction in false positive rates. The tree cover maps were generated for the state of California, which covers a total of 11,095 NAIP tiles and spans a total geographical area of 163,696 sq. miles. Our framework produced correct detection rates of around 88% for fragmented forests and 74% for urban tree cover areas, with false positive rates lower than 2% for both regions. Comparative studies with the National Land Cover Data (NLCD) algorithm and the LiDAR high-resolution canopy height model showed the effectiveness of our algorithm for generating accurate high-resolution tree-cover maps.
1
Introduction
An unresolved issue with medium-to-coarse resolution satellite-derived forest cover maps is their inaccuracy, particularly over heterogeneous landscapes, and the high degree of uncertainty they introduce when they are used for forest carbon mapping applications. Previous efforts have acknowledged the issues pertaining to misclassification errors in coarser resolution satellite-derived land cover products, however, limited studies are in place that demonstrate how very high resolution (VHR) land cover products at 1-m spatial resolution could improve regional estimations of Above Ground Biomass (AGB). This paper develops techniques and algorithms designed to improve the accuracy of current satellite-based AGB maps as well as provide a reference layer for more accurately estimating regional AGB densities from the Forest Inventory and Analysis (FIA). The VHR tree-cover map can be used to compute tree-cover estimates at any medium-to-coarse resolution spatial grid, reducing the uncertainties in estimating AGB density and mit2
igating the present shortcomings of medium-to-coarse resolution land-cover maps. The principal challenges in computing VHR estimates of tree cover at 1-m are associated with (a) the high variability in land cover types as recognizable from satellite imagery, (b) data quality affected by conditions during acquisition and pre-processing, and (c) corruption of data due to atmospheric contamination and associated filtering techniques. Land cover class identification is difficult even through visual interpretation owing to high variance in atmospheric and lighting conditions, and manual delineation of tree cover from millions of imagery acquisitions is neither feasible nor costeffective. Tree cover delineation can be mapped to an object recognition problem ( [1], [2], [3], [4], [5]), which can be framed in two ways: a boundary delineation problem that can be solved by perceptual grouping or a bounding box extraction problem that is addressed using a classification framework that performs a binary/multi-class classification on the bounding box. Perceptual grouping employs a segmentation module that clusters contextually related objects/object parts into a single unified region ( [6], [7], [8], [9]). On the other hand, a classification framework uses a variety of learning algorithms, such as boosting ( [10], [11]), random forests ( [12], [13], [14]), Support Vector Machines [15] and various others for performing both supervised and unsupervised classification of image patches based on visual and spectral characteristics. Our work combines both of these approaches into a unified framework that performs a classification for individual pixels using feature descriptors extracted from a neighborhood (defined on a window centered at the pixel of interest) and then performs a perceptual grouping of pixels sharing similar visual and spectral signatures. Present classification algorithms used for Moderate-resolution Imaging Spectroradiometer (MO-DIS) [16] or Landsat-based land cover maps, such as National Land Cover Data (NLCD) [17], produce accuracies of 75% and 78%, respectively. The MODIS algorithm works on 500-m resolution imagery; the NLCD works at 30-m resolution. The accuracy assessment is performed on a per-pixel basis and the relatively lower resolution of the dataset makes it difficult to analyze the performance of these algorithms for 1-m imagery. Thus, there is a pressing need for creating high resolution forest cover maps at a resolution of 1 m to improve accuracy in land cover maps and to improve several prognostic and diagnostic models that require land cover maps as input. An automated approach for tree crown delineation was proposed in [18], based on the identification of tree apexes and the maximum rate of change in spectral reflectance along transect extending outward from the tree center. The algorithm was applied to sub-meter resolution imagery (at most up to 30 cm) but its accuracy decreased consistently and non-linearly with increasing pixel spacing or decreasing sampling resolution. Other approaches for tree crown delineation based on the distribution of pixel brightness are proposed in [19] and [20]. [19] proposed 3
evaluating the brightness distribution within the radius of a circle centered on each tree, with values near the center of crown being larger than at the periphery showing a test for a 150m by 150m IKONOS image. [20] applies a similar concept with the valley forming approach of [21], which treats variation in brightness in the imagery as topography, where bright pixels are peaks (the crowns) interspersed by valleys (the darker inter-tree spaces). Also here results are reported for a small test-area of 620×550 meter and hence it is unknown how the algorithm would perform on a larger test area with higher variability. Other novel classification algorithms based on Deep Neural Networks have been used in ( [22], [23]). The framework in [22] is used for the recognition of roads in aerial images. Detecting trees is a much harder problem considering the significantly higher variability in tree-cover – trees can have various color and texture characteristics while roads have little variation in color or texture and belong to a fixed set of classes, such as concrete, mud, gravel, sand, etc. Another important feature in road detection is the incorporation of contextual information that improves accuracy of the classifier. On the other hand, a tree can be present beside another tree, a road, a building or even a water body. Thus, incorporating inter-class contextual information into our framework does not lead to significant improvements of the classification. [22] use a 64x64 detection window, which is a very large context for a tree-delineation problem in which an image patch might contain multiple classes, such as bare ground, roads, rooftops etc. and hence not suitable for the tree-classification problem. A method based on object detection using a Bayes framework and a subsequent clustering of the objects into a hierarchical model using Latent Dirichlet Allocation was proposed by [23], but accurate delineation of tree-cover areas demands the use of a different approach because of the need for higher accuracy and lack of useful contextual information (for e.g., detecting a parking lot can use the presence of multiple cars and their orientation as a useful feature, but, a tree-delineation problem lacks the presence of such contextual information encoded in neighboring objects of interest). Classification and/or Segmentation of 1-m or sub-meter resolution imagery is possible with commercial packages (ENVI, PCI Geomatica, etc.), but these tools are not scalable across millions of scenes in an automated manner. The algorithm proposed by [24] is similar to our approach, which uses a segmentation module and a Random Forest based classification module to assess tree cover in the National Agriculture Imagery Program (NAIP) data [25]. The algorithm demonstrates a viable operational tool for the classification of 1-m NAIP imagery and produces an overall accuracy of 84.8%. However, the analysis is based on the software Definiens Developer Professional [26], which affects the scalability and cost-effectiveness of the implementation to terabytes of data. Additionally, the authors limited the testing of the methodology to Pembina County in North Dakota, which covers an area of only 1,122 sq. miles as opposed to the 163,696 sq. miles in our implementation. 4
In this paper, we present an automated probabilistic framework for the segmentation and classification of 1-m VHR NAIP data to derive accurate large-scale estimates of tree cover. The results from the classification and segmentation algorithms are consolidated using a discriminative undirected probabilistic graphical model that performs structured prediction and helps in capturing the higher order contextual dependencies between neighboring pixels. A detailed description of the dataset is given in Section 2. A comprehensive summary of the proposed framework and the High Performance Computing (HPC) implementation details are provided in Section 3. Section 4 discusses the results and performance analysis for our pilot demonstration of the algorithm over California.
2
Dataset
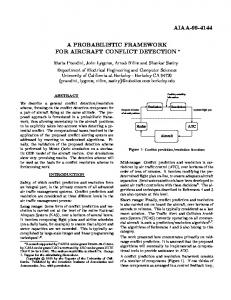
The NAIP dataset consists of a total of 330,000 scenes spanning the whole of the Continental United States (CONUS). We used the uncompressed Digital Ortho Quarter Quad tiles (DOQQs) which are GeoTIFF images with an area corresponding to the United States Geological Survey (USGS) topographic quadrangles. The average image tiles are ∼6000 pixels in width and ∼7000 pixels in height, and are approximately 200 megabytes each. The entire NAIP dataset for the Continental Unites State is ∼65 terabytes. The imagery was acquired at a 1-m ground sample distance (GSD) with a horizontal accuracy that lies within six meters of photo-identifiable ground control points [27]. The images consist of 4 bands – red, green, blue and Near Infrared (NIR). We performed the preliminary test of our algorithm and obtained tree-cover maps for the entire state of California, a total of 11,095 image tiles in the NAIP dataset. Figure 1 shows some sample image patches from the NAIP dataset containing tree and non-tree areas. The tree cover maps generated by our algorithm were validated against two high-resolution airborne LiDAR data footprints. The first set of LiDAR data (henceforth referred to as Area 1) was collected over the Teakettle Experimental Forest in the western Sierra Nevada mountain range, California. The LiDAR was flown in the summer of 2008 with the University of Florida OPTECH GEMINI ALSM unit, operating at 100-125 kHz with a maximum 25◦ scanning angle. Data were flown 600-750 m above ground, with 50%-75% swath overlap yielding an average return density of approximately 18 pts/m2 . LiDAR processing was conducted at the University of Maryland following [28]. A Digital Elevation Model (DEM) was fit to the lowest returns from the raw LiDAR returns, and smoothed to represent local topography. The elevation of the corresponding DEM pixel was subtracted from each raw LiDAR return. The maximum LiDAR height in each pixel was used to produce a Canopy Height Model (CHM) at a resolution of 0.5 m. For the purpose of validation, the LiDAR data were resampled to 1 m
5
spatial resolution. The second set of LiDAR data (henceforth referred to as Area 2) was obtained in the Chester area in California, using the NASA Goddard’s LiDAR, Hyperspectral and Thermal (G-LiHT) Airborne Imager [29]. NASA’s Cessna 206 was used for acquiring the G-LiHT data. The Cessna was fitted with the VQ-480 (Riegl USA, Orlando, FL, USA) airborne laser scanning (ALS) instrument and was flown at an altitude of 335 m. The data acquired had a swath width of 387 m and a Field of View of 60◦ . The sampling density was 6 pulses/m2 . The spatial resolution of the final LiDAR data was 1 m.
Figure 1: A sample of image patches from the NAIP dataset showing tree and non-tree areas.
3
Methodology
We have designed and implemented a scalable semi-automated probabilistic framework for the classification and segmentation of millions of scenes using a HPC architecture. The framework is robust to account for variability in land cover data as well as atmospheric and lighting conditions. Our framework consists of the following modules: (1) Segmentation, (2) Feature Extraction, (3) Classification, and (4) Labeling.
6
3.1
Unsupervised Segmentation
A segment can be considered to be any region having pixels with uniform spectral characteristics. The aim of segmentation is to find regions with uniform values for the different spectral bands representing a particular land cover class. Segmentation is performed using the Statistical Region Merging (SRM) Algorithm [30]. We use a generalized SRM algorithm that incorporates values from all four bands. The SRM algorithm initially considers each pixel as a region and merges them to form larger regions based on a merging criterion. The merging criterion that we use in this case is as follows: Given the differences in red, green, blue and NIR values of neighboring pixels that correspond to dR, dG, dB and dNIR, respectively, merge two regions if (dR