. Meead Saberi. Institute of ... Email:
. Ali Zockaie ...... Usin
A Sensitivity-Based Linear Approximation Method to Estimate Time-Dependent Origin-Destination Demand in Congested Networks Sajjad Shafiei (corresponding author) Institute of Transport Studies Monash University Room 126, Building 69, Clayton Campus Melbourne, Australia Email:
[email protected] Meead Saberi Institute of Transport Studies Monash University Room 101, Building 60, Clayton Campus Melbourne, Australia Email:
[email protected] Ali Zockaie Department of Civil and Environmental Engineering Michigan State University 428 S. Shaw Lane East Landing, MI, USA Email:
[email protected] Majid Sarvi Department of Infrastructure Engineering University of Melbourne Melbourne, Australia Email:
[email protected]
Total words: 5,100 words + 7 figures + 3 tables = 7,600 words
Revised and Re-submitted for Presentation and Publication in the Transportation Research Record: Journal of the Transportation Research Board
November, 2016
Shafiei, et.al
1 2 3 4 5 6 7 8 9 10 11 12 13 14 15 16 17 18 19 20 21 22
2
ABSTRACT This paper presents a bi-level optimization problem to estimate offline time-dependent origin-destination (TDOD) demand based on link flows and historical OD matrices. The upperlevel problem aims to minimize the summation of errors in both traffic counts and OD demand. Conventionally, OD flows are linearly mapped to link flows using the assignment matrix proportions obtained from the dynamic traffic assignment (DTA), which is typically formulated as the lower-level problem. However, the linear relationship may be invalid when congestion builds up in the network, resulting in a nonlinear relation between OD flows and link flows. The nonlinearity may lead to a converged solution that is far away from the global optimum. Therefore, an accurate solution should be able to relax the linear assumption and to consider the effect of other OD flows on the links’ traffic volumes. In this study, a solution method based on the sensitivity of assignment proportions to OD flows has been proposed and applied requiring a number of further assignments. To overcome the extra computational requirement, we propose a heuristic method to exclude the extra number of assignments and to improve the performance of the solution. The proposed algorithm is applied to multiple networks of varying size and congestion level. Results demonstrate the efficiency of the proposed method for congested networks with less computation time.
Keywords: Time-dependent Origin-Destination Demand Assignment, Bi-level Optimization, Congested Network
Estimation,
Dynamic
Traffic
Shafiei, et.al
1 2 3 4 5 6 7 8 9 10 11 12 13 14 15 16 17 18 19 20 21 22 23 24 25 26 27 28 29 30 31 32 33 34 35 36 37 38 39 40 41 42 43 44 45
3
INTRODUCTION Time-dependent origin-destination (TDOD) demand is a necessary input to simulatedbased dynamic traffic assignment (DTA) models. The TDOD demand often obtained from static demand models usually contains errors, which are transferred into the network outputs resulting in unreliable planning and operational outcomes. Therefore, the TDOD demand estimation (adjustment) problem is recognized as a critical part of DTA models calibration. Significant progress has been made towards formulating and solving the TDOD demand estimation problem in the past few decades (1–6). Various stochastic (7, 8) and deterministic (9–13) solution algorithms for solving the TDOD estimation problem have been proposed in the literature. Since the number of unknown variables is larger than the number of equations in the TDOD estimation problem, the accuracy of the initial OD demand matrix significantly affects the convergence of the solution algorithm. A few studies explored approaches to provide more reliable initial OD demand matrices taking into considerations the day of the week and weather conditions (14–16). Moreover, with the advent of new technologies for traffic data collection, a practical solution to improve the results of the TDOD demand estimation is using various types of information rather than link flows only (17, 18). Estimation of TDOD demand in congested networks is still challenging particularly for large-scale networks. This is due to the fact that congestion may exert a non-linear effect on the relationship between OD flows and link flows (19, 20). When spillback forms, link flow measurements are no longer solely dependent on demand flows; rather, supply-side characteristics become important due to link capacity constraints. This problem results in further methodological development that focuses on using stochastic solutions such as simultaneous perturbation stochastic approximation (SPSA) (21). Since methods of this type are assignmentmatrix-free, they need to compute an approximated gradient in the solution which leads to a number of additional iterations. The increased number of required iterations reduces the applicability of the methods for large-scale problems where the DTA is computationally intensive (22, 23). Recent studies by Toledo and Kolechkina (11) and Frederix et al. (24–26) stressed the need of relaxing the fixed proportional assignment assumption in mapping demand flows to link flows in congested networks. Toledo and Kolechkina (11) proposed a method based on the linear approximation of the assignment matrix. They relaxed the conventional assumption of fixed assignment proportions by considering the marginal effect of the OD flow passing through the links. Making the assignment proportions only dependent on the relevant OD flows helps to reduce the number of estimated parameters. However, this assumption may not hold in congested networks since the variation of OD flows can have significant impacts on the entire assignment proportions particularly through intersections and spillbacks. Frederix et al. (26) proposed an approach that the sensitivity of assignment proportions to OD flows are considered in the TDOD demand estimation problem, taking into account that link flows are not separable. The sensitivity analysis of assignment proportions to the OD flows requires performing extra assignments. They used the Marginal Computation (MaC) (27) technique to perform extra assignments in more efficient way. The MaC algorithm keeps the base simulation result and re-calculates only the part of the network that changes in the sensitivity analysis. By applying this method, they could substantially decrease computation time of dynamic network loading (DNL) to perform the
Shafiei, et.al 1 2 3 4 5 6 7 8 9 10 11 12 13 14 15 16 17 18 19 20 21 22 23 24 25 26 27 28 29
4
sensitivity analysis of assignment proportions. In another study (25), Frederix et al. suggested a space decomposition technique. They presented a new hierarchal approach that focuses on separating the network into congested and uncongested sub-networks. The MaC algorithm was then applied to the congested sub-network only. Since computing sensitivity for all OD pairs is computationally intensive, any proposed algorithm to be applied on real-size networks should avoid performing extra computations (28, 29). In fact, previous studies by Frederix et al.(24–26) highlighted the problem of computing sensitivity for all OD pairs in medium or large-scale networks. The authors proposed MaC algorithm to execute extra assignments more efficient. Although the idea is interesting, the proposed solution cannot be readily obtained for three reasons. First, the number of OD pairs grows rapidly in a larger network. As a result, computing the sensitivity of all OD pairs remains intractable even when an efficient DNL model is used. Second, errors from the simplification of the DNL model may considerably distract the convergence of the solution. Finally, the application of the MaC algorithm requires to improve the DNL models, which may be difficult to implement for the majority of the exiting DNL/DTA models. This paper relaxes the conventional assumption on the fixed assignment proportion in mapping OD flows to link flows in the TDOD demand estimation problem. A heuristic algorithm is proposed to compute the sensitivity of assignment proportions to OD flows more efficiently. The method considers the correlation between OD flows and link flows and applies a systematic approach to determine the OD flows that have higher tendency to vary during the TDOD demand estimation procedure. The paper demonstrates that the proposed method is applicable in real-size networks. The remaining of the paper is organized as follows. The next section describes the conventional formulation problem and the required enhancements in the TDOD demand estimation for large-scale congested networks. The third section discusses the overall steps to obtain the optimal solution. Section four summarizes the modeling results on studied networks. The last section draws some conclusions and suggests future research directions.
30
PROBLEM FORMULATION
31 32 33 34 35 36 37 38
The TDOD demand estimation problem can be formulated as a bi-level optimization problem (3) . The upper-level is the travel demand matrix estimation problem and the lowerlevel is a DTA model producing detailed dynamic traffic patterns. Traditionally, two objectives are considered in the upper-level. The first objective is to minimize the deviation between observed link flows and simulated link flows, while the second objective is to minimize the deviation between the priori demand and the estimated demand. Mathematically, this problem can be formulated as follows:
39 40 41 42
minimize Z(X) = [ 𝑤𝑤. f1 (𝑋𝑋, 𝑋𝑋�) + (1 − 𝑤𝑤). f2 (𝑌𝑌, 𝑌𝑌�)] 𝑌𝑌 = DTA(𝑋𝑋)
(1)
where 𝑓𝑓1 and 𝑓𝑓2 are deviation functions, 𝑓𝑓1 measures the error between the estimated OD demand 𝑋𝑋 and the initial OD demand 𝑋𝑋�, 𝑓𝑓2 measures the error between the estimated Y and observed link traffic counts 𝑌𝑌�. w represents the weight on the deviation from the initial matrix, and
Shafiei, et.al 1 2 3 4
5
DTA(X) represents link volumes obtained from the dynamic user equilibrium (DUE) model. The equation that connects the lower level problem to the upper level is conventionally formulated as follows: ℎ
5 6 7 8 9 10 11 12 13 14 15 16
ℎ,𝑡𝑡 (𝑋𝑋)𝑥𝑥𝑖𝑖𝑡𝑡 𝑦𝑦𝑎𝑎ℎ = � � 𝑝𝑝𝑎𝑎,𝑖𝑖
(2)
𝑡𝑡=1 𝑖𝑖∈𝐼𝐼
where 𝑦𝑦𝑎𝑎ℎ : link flow at link a during time period h, 𝑥𝑥𝑖𝑖𝑡𝑡 : flow between OD pair i departing in time period t, ℎ,𝑡𝑡 𝑝𝑝𝑎𝑎,𝑖𝑖 : proportion of 𝑥𝑥𝑖𝑖𝑡𝑡 that passes link a during time period h, X: vector of all OD flows 𝑥𝑥𝑖𝑖𝑡𝑡 , I: OD pairs set. Frederix et al. (24, 26) suggested using the Taylor approximation to specify the linear relationship of link flows at the current demand flow (𝑋𝑋 ∗ ). By substituting Eq.2 with the firstorder Taylor approximation the following equation is obtained: 𝑦𝑦𝑎𝑎ℎ
ℎ
ℎ,𝑡𝑡 (𝑋𝑋 ∗ )𝑥𝑥𝑖𝑖𝑡𝑡 + = � � � 𝑝𝑝𝑎𝑎,𝑖𝑖 𝑡𝑡=1 𝑖𝑖∈𝐼𝐼 ℎ
= ��� 𝑡𝑡=1 𝑖𝑖∈𝐼𝐼 ℎ
= ��� 𝑡𝑡=1 𝑖𝑖∈𝐼𝐼
ℎ,𝑡𝑡 (𝑋𝑋 ∗ )𝑥𝑥𝑖𝑖𝑡𝑡 𝑝𝑝𝑎𝑎,𝑖𝑖
ℎ,𝑡𝑡 (𝑋𝑋 ∗ )𝑥𝑥𝑖𝑖𝑡𝑡 𝑝𝑝𝑎𝑎,𝑖𝑖
+
d𝑦𝑦𝑎𝑎ℎ (𝑋𝑋 ∗ ) 𝑡𝑡 ∗ �𝑥𝑥𝑖𝑖 − 𝑥𝑥𝑖𝑖𝑡𝑡 �� 𝑡𝑡 d𝑥𝑥𝑖𝑖
∗
ℎ,𝜏𝜏 (𝑋𝑋 ∗ )𝑥𝑥ï𝜏𝜏 ) d(∑ℎ𝜏𝜏=1 ∑ï∈𝐼𝐼 𝑝𝑝𝑎𝑎,ï ℎ
+ �� � 𝜏𝜏=1 ï∈𝐼𝐼
d𝑥𝑥𝑖𝑖𝑡𝑡
ℎ,𝜏𝜏 (𝑋𝑋 ∗ )� d �𝑝𝑝𝑎𝑎,ï
d𝑥𝑥𝑖𝑖𝑡𝑡
∗
∗
�𝑥𝑥𝑖𝑖𝑡𝑡 − 𝑥𝑥𝑖𝑖𝑡𝑡 ��
(3)
∗
𝑥𝑥ï𝜏𝜏 � �𝑥𝑥𝑖𝑖𝑡𝑡 − 𝑥𝑥𝑖𝑖𝑡𝑡 ��
17 18 19 20 21
The second term of the Taylor approximation (Eq.3) incorporates the sensitivity of the assignment matrix to changes in the OD flows. As mentioned, computing the exact Jacobian vector in the second term is impossible in median or large-scale networks. In the next section, we propose an algorithm that estimates the second term of Eq.3 more efficiently, making it applicable for large-scale network applications.
22
METHODOLOGY
23 24 25 26 27 28 29 30
Here we propose an iterative sensitivity-based linear approximation algorithm as follows: Step 0. Superimpose an initial static OD matrix by a general time profile; Set 𝐼𝐼 ′ = {}, n=0. ℎ,𝑡𝑡 Step 1. Load demand to the network to obtain assignment matrix, 𝑝𝑝𝑎𝑎,𝑖𝑖 . Step 2. Calculate the sensitivity of all observed links to the OD pairs in set 𝐼𝐼 ′ . Step 3. Estimate the TDOD demand matrices with link volumes given by Eq.3. Step 4. Determine OD pairs that changed considerably in previous iterations and insert them in 𝐼𝐼 ′ .
Shafiei, et.al 1 2 3 4 5 6 7 8 9 10 11 12 13 14 15 16 17 18 19 20 21 22 23 24 25 26 27 28 29 30 31 32 33 34 35 36 37 38 39 40 41 42 43
6
Step 5. Update current demand, 𝑋𝑋 ∗ , with estimated demand 𝑋𝑋 𝑛𝑛 . Step 6. If the termination criteria is met, stop. Otherwise, go to step 1 and n=n+1.
An initial estimate of the OD matrix for each time interval is set in step 0. Also 𝐼𝐼 ′ ∈ 𝐼𝐼 is defined as a set containing all the OD pairs that change considerably in the previous iterations. In ℎ,𝑡𝑡 step 1, the current demand is loaded to the network resulting in the assignment matrix, 𝑝𝑝𝑎𝑎,𝑖𝑖 . Then, the second term of Eq.3 is calculated in step 2. Since computing sensitivity of all observed links for all OD flows is computationally intensive, sensitivity analysis in step 2 is only applied to the OD pairs that were included in 𝐼𝐼 ′ . In step 3 the upper-level problem is solved using a gradient decent method. In step 4, by comparing the new estimated demand 𝑋𝑋 𝑛𝑛 with the previous value 𝑋𝑋 𝑛𝑛−1 , the OD pairs that have more tendency to vary are determined and inserted to the set 𝐼𝐼 ′ . Then, in step 5, the new demand is updated. Note that in the first iteration (n=0) where the sensitivity computation cannot be performed, the new demand is not updated. The results obtained are checked in step 6 against the termination criteria and the procedure would continue if it is not met. A heuristic solution algorithm is employed to reduce the computation time for the sensitivity analysis. The following are several reasons that the variations of many OD pairs may not have a significant effect on the TDOD demand estimation: - In large-scale TDOD demand matrices, many OD pairs have small values. The impact of these individual OD pairs are insignificant on the network and hence, the sensitivity analysis for each of them is unnecessary. - Flows associated with many OD pair do not cross the congested area. As a result, the new demand can be accurately estimated using the assignment proportions as in a traditional method. - Within a few iterations a number of OD demand flows converge and would not change considerably in the subsequent iterations. Thus, these OD pairs are excluded from the sensitivity analysis. Therefore, a set of candidate OD pairs is defined on which the sensitivity analysis is applied. According to the proposed method, in iteration 0, there is no OD pair in the set 𝐼𝐼 ′ , indicating that in this iteration, Eq. 3 is simplified to Eq. 2. However, in the subsequent iterations, the qualified OD pairs based on the above identification procedure are selected and moved to the set 𝐼𝐼 ′ .
SOLUTION ALGORITHM
Here we apply the commonly used ordinary least square (OLS) approach as the functional form of the component functions 𝑓𝑓1 and 𝑓𝑓2 in Eq.1. The link traffic volumes are calculated as expressed in Eq.3 based on the assignment proportions obtained from the DTA model. Different types of exact and heuristic methods are available and can be employed to solve the optimization problem in Eq.1. Here we solve the problem iteratively using the gradient descent method. The method requires calculation of the gradient direction and step size to update the OD demand matrix in each iteration using the following equation: 𝑋𝑋 (𝐾𝐾) = 𝑋𝑋 (𝐾𝐾−1) +
∂𝑍𝑍 𝜆𝜆 𝜕𝜕𝜕𝜕
(4)
Shafiei, et.al 1 2
7
The gradient is determined as follows: 2 ∂𝑍𝑍 ∂ 𝑡𝑡 𝑡𝑡 ℎ ℎ 2 ) = �( 1 − 𝑤𝑤 � � ( 𝑦𝑦 − 𝑦𝑦 � ) + 𝑤𝑤 � �� 𝑥𝑥 − 𝑥𝑥 � � � 𝑎𝑎 𝑎𝑎 𝑖𝑖 𝑖𝑖 𝜕𝜕𝑥𝑥𝑖𝑖𝑡𝑡 𝜕𝜕𝑥𝑥𝑖𝑖𝑡𝑡 ℎ 𝑎𝑎 𝑖𝑖 𝑡𝑡 ℎ
= 2(1 − 𝜔𝜔) �� �
3 4 5
6 7 8 9 10 11 12 13 14 15 16 17 18 19 20 21 22 23 24 25 26 27 28 29 30 31 32 33
�
𝑡𝑡=1 𝑖𝑖∈𝐼𝐼 ℎ
ℎ,𝑡𝑡 (𝑋𝑋) + � � 𝑝𝑝𝑎𝑎,𝑖𝑖 𝜏𝜏=1 ï∈𝐼𝐼
ℎ,𝑡𝑡 (𝑋𝑋)𝑥𝑥𝑖𝑖𝑡𝑡 𝑝𝑝𝑎𝑎,𝑖𝑖
+��
ℎ,𝜏𝜏 (𝑋𝑋 ∗ )� d �𝑝𝑝𝑎𝑎,ï
d𝑥𝑥𝑖𝑖𝑡𝑡
ℎ
𝜏𝜏=1 ï∈𝐼𝐼 ∗
ℎ,𝜏𝜏 (𝑋𝑋 ∗ )� d �𝑝𝑝𝑎𝑎,ï
d𝑥𝑥𝑖𝑖𝑡𝑡
∗
∗
𝑥𝑥ï𝜏𝜏 �𝑥𝑥𝑖𝑖𝑡𝑡 − 𝑥𝑥𝑖𝑖𝑡𝑡 � − 𝑦𝑦�𝑎𝑎ℎ �
(5)
𝑥𝑥ï𝜏𝜏 � + 2𝜔𝜔�𝑥𝑥𝑖𝑖𝑡𝑡 − 𝑥𝑥�𝑖𝑖𝑡𝑡 �
We find the step size (𝜆𝜆) analytically by determining the moving direction in each iteration: Γ 𝑘𝑘 =
∂𝑍𝑍 𝑚𝑚𝑚𝑚𝑚𝑚 𝑍𝑍(𝑥𝑥𝑡𝑡𝑖𝑖 + 𝑡𝑡 𝜆𝜆) 𝜆𝜆 𝜕𝜕𝑥𝑥𝑖𝑖
(6)
To solve the sub-problem as shown in Eq.6, the golden section algorithm, as a line search minimization solution, is applied. NUMERICAL RESULTS In this section, different linear models relating OD flows to link flows are compared. In the conventional model (Eq.2) the assignment proportions map the two flows on each other while in the new approach, sensitivity of demand flows to link flows are also taken into account. The sensitivity analysis can be performed either by using an exact solution method or the proposed heuristic solution algorithm. The comparison is first conducted in the same network previously used in the literature (24, 26) for the sake of consistency and reproducibility. We, then, apply the method on a real network introduced as a benchmark in a recent study (2) to demonstrate its performance in more complex configurations. The algorithm is developed in Python and applied using AIMSUN simulation-based model (30). Methodology verification Figure 1 shows the study network consisting of three branches that merge in node 10. Each branch is divided into four equal one-way links with the same physical characteristics. Each link has a length of 1 km, capacity of 1,800 vehicles per hour, free flow speed of 90 km/h and jam density of 140 vehicles per kilometer. Node 1 and node 2 are origins and node 3 is the destination. The target (true) demand is depicted in Figure 1(b). After 15 minutes, due to a jump in the OD flow, a queue propagates in the left branch. The length of the queue increases till minute 95. The maximum queue length is demonstrated by a rectangle in Figure 1(a). Due to the smaller OD flow in the right branch, the queue length is quite short. In the third stage of the network, i.e. after minute 95, the OD flow decreases to the initial stage and therefore, the traffic queue gradually dissipates by the end of the simulation. The traffic volumes obtained by loading the true demand to the network are considered as target volumes, which are captured by the detectors shown in Figure 1(a) with an ‘X’.
Shafiei, et.al
8
(a)
1500
1500
Demand Flow (veh/h)
Demand Flow (veh/h)
1 2 3
(b) FIGURE 1. (a) Schematic illustration of study network. (b) Initial and true demand profiles (26)
1000
1000
500
Case A Target
0 0
30
60 90 Time (min)
120
150
500
Case B Target
0 0
30
60 90 Time (min)
1500 1000 500
Case C Target
0 0
4 5 6
150
(b) Demand Flow (veh/h)
(a)
120
30
60 90 Time (min)
120
150
(c) FIGURE 2 Comparing the estimated demand using different solution approaches. (a), (b) and (c) show the demand profiles of origin 1 to destination 3.
9
1500
Demand Flow (veh/h)
Demand Flow (veh/h)
Shafiei, et.al
1000 500
Case A Target
0 0
30
60 90 Time (min)
120
1500 1000 500
150
Case B Target
0 0
30
Demand Flow (veh/h)
(d)
120
150
(e) 1500 1000 500
Case C Target
0 0
1 2 3 4 5 6 7 8 9 10 11 12 13 14 15 16 17 18 19 20 21 22 23
60 90 Time (min)
30
60 90 Time (min)
120
150
(f) FIGURE 3 Comparing the estimated demand using different solution approaches. (d), (e) and (f) show the demand profiles of origin 2 to destination 3. The assumed initial O-D matrix profile is shown in Figure 1(b). Three different approaches are applied to solve the TDOD estimation problem for this network: Case A) Using the conventional linear model (Eq.2) Case B) Using the first order Taylor approximation (Eq.3) - computing the exact value of the Jacobian vector. Case C) Using the first order Taylor approximation (Eq.3) - computing a part of the Jacobian vector. Figure 2 and 3 show the estimated demand using different solution approaches. The target demand is also presented as a point of reference for both OD pairs. The conventional linear process (case A) underestimates the congested state of the network and overestimates demand especially for the demand flow from node 2 to node 3. The approach requires low computation time and during the estimation, the DTA model is run for a few times only. However, this approach is more suitable for uncongested networks as discussed previously. The model errors at the beginning and the end of the simulation remain small, which suggests that the model could accurately reproduce the target demand. However, by increasing the congestion in the network, the accuracy cannot be maintained. In case B, the exact sensitivity term is computed for all OD pairs during the entire simulation. The computation is intensive, however, the estimated model can capture the true demand with some noise. In case C, the results are quite
Shafiei, et.al 1 2 3 4 5 6 7 8 9 10 11 12 13 14
10
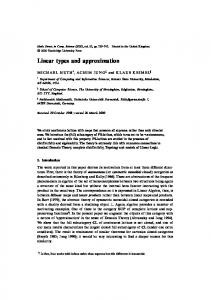
close to those in case B. The small difference is due to the simplification of the sensitivity computation in the third approach. Figure 4 shows the required number of DNL model runs for 10 iterations. In case B, the number of extra assignments remains constant in each iteration because the full sensitivity term is required to be calculated. However, in case C, the number of extra assignments varies based on the number of OD pairs in set 𝐼𝐼 ′ . In the first iteration, there is no nominated OD in set 𝐼𝐼 ′ and hence, the resulting estimated OD demands are compared with their original values. Since the values of all OD pairs are changed over 5%, they become nominated in iteration 2 and enter set 𝐼𝐼 ′ . The process continues in the next iteration where the estimated demand values are compared with their previous ones to renew set 𝐼𝐼 ′ . In iteration 4, most of the OD pairs converge and thus, are excluded from set 𝐼𝐼 ′ . The remaining OD pairs mainly belong to the time intervals where sudden changes in demand occur (around minute 15 and 90). After a few iterations, these OD pairs also converge. For the study network, the exact solution (case B) requires 600 DNL model runs while in case C this number is reduced to 164.
The number of DNL runs
70 60 50
Case B Case C
40 30 20 10 0 1
15 16 17 18 19 20 21 22 23 24 25 26 27 28 29
2
3
4
5
6
7
8
9
10
Iterations
FIGURE 4. The number of DNL runs in case (B) and (C). Methodology implementation The methodology is further applied to a larger network to gain more insights into the general performance of the proposed algorithm. The study network includes complex traffic elements such as two roundabouts and adaptive signal controls. The simulation was conducted for one hour divided into 10-min time intervals leading to six time intervals. In this numerical study, 6 links are considered to have detectors. The corresponding link flows have been derived from assignment of target (true) TDOD matrix treated as target counts. AIMSUN dynamic user equilibrium (DUE) was used. Due to the congestion or to the distance between OD pairs, the trips for vehicles that departed at a given time interval in the network are not necessarily completed within the same time interval.
Shafiei, et.al
1 2 3 4 5 6 7 8 9 10 11 12 13 14 15
11
FIGURE 5. Schematic illustration of the study network. Red links represent target links. Figure 6 illustrates the initial, target and estimated demand profiles in one hour simulation. The target demand increases in the second and third time intervals and then reduces again. This variation causes queue propagation in on-ramps and thus, the queue spills back to the adjacent links. In the last few time intervals, the congestion gradually dissipates. To explore the performance of the TDOD demand estimation process, a fixed demand pattern, as shown in Figure 6 is considered as an initial demand. The quality of the initial demand affects the TDOD demand estimation performance. The initial demand flows are obtained randomly perturbing the target matrix in the range of ±30%. A number of statistical measures can be employed to evaluate the performance of TDOD estimation approaches, measuring the estimated outputs. Mean absolute error (MAE) and root mean square error (RMSE) are used to quantify the deviation between measured and estimated link flows: 𝑁𝑁
1 𝑀𝑀𝑀𝑀𝑀𝑀 = � |𝑌𝑌𝑛𝑛 − 𝑌𝑌�𝑛𝑛 | 𝑁𝑁 𝑛𝑛=1
16 17 18 19 20 21 22 23 24 25 26 27 28 29
𝑁𝑁
1 𝑅𝑅𝑅𝑅𝑅𝑅𝑅𝑅 = � �(𝑌𝑌𝑛𝑛 − 𝑌𝑌�𝑛𝑛 )2 𝑁𝑁
(7)
(8)
𝑛𝑛=1
where N: is the number of observations, 𝑌𝑌�𝑛𝑛 : is an observation, and 𝑌𝑌𝑛𝑛 : is a simulated value at time n.
Table 1 shows the goodness of fit before and after the TDOD demand estimation process. In general, a significant reduction in RMSE and MAE values are obtained after applying TDOD demand estimation. The performance of the two methods are also compared. Although the conventional method reduced the gap between the simulated link flows and the target values, the quality of the solution in terms of the estimated link flows and demand flows obtained from the proposed algorithm is higher. For the TDOD demand estimation problem, the following termination criterion is used where k is the number of iterations: Relative gap =
𝑅𝑅𝑅𝑅𝑅𝑅𝑅𝑅𝐾𝐾 − 𝑅𝑅𝑅𝑅𝑅𝑅𝑅𝑅𝑘𝑘−1 < 0.05 𝑅𝑅𝑅𝑅𝑅𝑅𝑅𝑅𝐾𝐾
(9)
Shafiei, et.al 1 2
12
TABLE 1. RMSE of link traffic volumes for the TDOD estimation results. Initial Conventional approach (Case A) Proposed approach (Case C)
RMSE 117.9 37.3 10.5
MAE 87.8 24.6 8.3
3 Demand flow (veh/15min)
3,000 2,500 2,000 1,500 Initial Target Proposed Conventional
1,000 500 0 0
4 5 6 7 8 9 10 11 12 13 14 15 16 17 18 19 20
21 22 23 24 25
20
40
60
Time (min)
FIGURE 6. Initial, target and estimated demand profiles. To further investigate the efficiency of the proposed approach, we implement the OD estimation method on a benchmark network (2). The observed traffic data are obtained from 10 detectors in various locations across the network. The simulation study is conducted for the morning peak (8:00 AM to 9:00 AM) in 15-min time intervals. The number of OD pairs are 90 in each time interval which indicates that the total number of estimated OD pairs is equal to 360 (31). The TDOD estimation problem is applied to the network with three demand scenarios: uncongested, moderately congested, and heavily congested. The DTA model is run using the AIMSUN simulator outputting the assignment proportion matrices. Based on the obtained matrices, the bi-level problem is solved using the gradient descent method. To derive the target demand flows, a uniform random component in the range of ±40% is added to the initial demand and multiplied by three factors to produce different congestion levels, mathematically expressed as follows: 𝑋𝑋 = 0.8𝑋𝑋� . [0.6 + 0.8 ∝] 𝑋𝑋 = 1.2𝑋𝑋� . [0.6 + 0.8 ∝] 𝑋𝑋 = 1.5𝑋𝑋� . [0.6 + 0.8 ∝]
∝ ~ 𝑈𝑈(0,1) ∝ ~ 𝑈𝑈(0,1) ∝ ~ 𝑈𝑈(0,1)
(10) (11) (12)
Table 2 illustrates several performance measures of the network with different OD demands. Note that the network’s critical density can be much lower than the link critical density specifically for a heterogeneous network (32–34).
Shafiei, et.al
1 2 3 4
13
FIGURE 7. Schematic illustration of the study network. Red links represent target links. TABLE 2. Compare performance measures of the network in different congestion levels.
Flow (veh/h) Speed (km/h) Delay time (sec/km) Density (veh/km) 5 6 7 8 9 10 11 12 13 14 15 16 17 18 19
Uncongested
Moderately congested
Heavily congested
2,535.1 24 98.91 5.75
3,956.9 20.21 136.88 11.38
4,908 15.46 247.65 21.87
Table 3 shows the RMSE and MAE before and after the TDOD demand estimation process for both the conventional linear method and the proposed method. It can be seen that the performance measures are favorable when applying the conventional method to the uncongested network. By increasing the congestion level, the proposed method provides a more reliable estimation of OD demand demonstrating the applicability of the proposed method on congested networks. The termination criterion in this case study is expressed in Eq.9. Ten replications for each assignment were employed to address the stochasticity of the simulation. The DTA assignment interval was 5 minutes and all the graphical elements were closed. The models were run on a 64bit machine using 64 GB memory and an Intel Xeon 12 CPUs @ 3.5 GHz processor. The computation times for the entire OD estimation procedure were about 20, 35 and 40 minutes for the uncongested, moderately congested, and heavily congested respectively. TABLE 3. RMSE of link traffic volumes for the TDOD estimation results. Uncongested
Initial Conventional approach Proposed approach 20
RMSE 32.28 17.99 13.08
MAE 26.50 13.25 10.10
Moderately congested RMSE MAE 52.00 30.5 22.65 14.37 19.11 13.12
Heavily congested RMSE MAE 75.42 47.82 36.59 25.57 20.79 15.22
Shafiei, et.al 1 2 3 4 5 6 7 8 9 10 11 12 13 14 15 16 17 18 19 20 21 22 23 24 25 26 27 28 29 30 31 32 33 34 35 36 37 38 39 40 41 42 43 44 45 46
14
CONCLUSION The paper focuses on the bi-level dynamic OD demand estimation problem for congested networks. The conventional assumption on the linear relationship between OD flows and link flows is discussed. This assumption does not hold in congested networks due to the complex interaction of OD flows on link flows. Therefore in this study, the conventional assumption is relaxed but with a further requirement on the sensitivity analysis of all OD pairs to link flows. Since deriving the sensitivity of all OD pairs makes the approach impractical for real-size networks, a heuristic solution is proposed that can avoid the extra computation burden. The results from a toy network and two real networks suggest that the exact computation of the sensitivity matrix is inefficient. The heuristic method proposed in the study has successfully estimated the target demand, as well as the existing method in the literature but with much smaller execution time, which can be very beneficial in analyzing large scale networks. The case studies presented in the paper were implemented at the microscopic level. For mesoscopic and macroscopic simulations with thousands of links and numerous traffic zones, further computational improvements are required. One of the main advantages of the proposed approach is the high level of parallelism. The extra assignments can be conducted concurrently, which is a desirable technique to speed up the solution algorithm. In addition, relying only on the observed traffic volume can be considered as a limitation for this study. The proposed model can adapt a multi-objective framework where various types of traffic data sources can be synthesized in a large-scale congested network. A possible extension is to use multi-source data to estimate more accurate OD demand matrices particularly for highly congested networks. Another possible extension is to combine the proposed heuristic solution with more efficient DNL models to improve the computational performance in large-scale network applications. REFERENCES 1.
2.
3. 4.
5.
6.
Ziliaskopoulos, A. K. Foundations of Dynamic Traffic Assignment : The Past , the Present and the Future. Networks and Spatial Economics, Vol. 1, No. 3, 2001, pp. 233– 265. Antoniou, C., J. Barceló, M. Breen, M. Bullejos, J. Casas, E. Cipriani, B. Ciuffo, T. Djukic, S. Hoogendoorn, V. Marzano, L. Montero, M. Nigro, J. Perarnau, V. Punzo, T. Toledo, and H. van Lint. Towards a generic benchmarking platform for origin-destination flows estimation/updating algorithms: Design, demonstration and validation. Transportation Research Part C: Emerging Technologies, No. December, 2015. Cascetta, E., D. Inaudi, and G. Marquis. Dynamic estimators of origin-destination matrices using traffic counts. Transportation science, 1993. Vaze, V., C. Antoniou, Y. Wen, and M. Ben-Akiva. Calibration of Dynamic Traffic Assignment Models with Point-to-Point Traffic Surveillance. Transportation Research Record: Journal of the Transportation Research Board, Vol. 2090, No. 1, 2009, pp. 1–9. Zockaie, A., Y. Chen, and H. Mahmassani. Adaptive Drivers and Time-Dependent Origin-Destination Demand Estimation: Methodology and Application to Large-Scale Network. 2014. Lu, L., Y. Xu, C. Antoniou, and M. M. E. Ben-Akiva. An enhanced SPSA algorithm for the calibration of Dynamic Traffic Assignment models. Transportation Research Part C:
Shafiei, et.al 1 2 3 4 5 6 7 8 9 10 11 12 13 14 15 16 17 18 19 20 21 22 23 24 25 26 27 28 29 30 31 32 33 34 35 36 37 38 39 40 41 42 43 44 45 46
7.
8.
9.
10.
11.
12.
13.
14.
15.
16. 17. 18.
19. 20. 21.
22.
15
Emerging Technologies, Vol. 51, 2015, pp. 149–166. Balakrishna, R., and H. N. Koutsopoulos. Incorporating Within-Day Transitions in the Simultaneous Off-line Estimation of Dynamic Origin-Destination Flows without Assignment Matrices. Transportation Research Record, Vol. 2085, No. August, 2007, pp. 31–38. Cipriani, E., M. Florian, M. Mahut, and M. Nigro. A gradient approximation approach for adjusting temporal origin–destination matrices. Transportation Research Part C: Emerging Technologies, Vol. 19, No. 2, 2011, pp. 270–282. Lu, C. C., X. Zhou, and K. Zhang. Dynamic origin-destination demand flow estimation under congested traffic conditions. Transportation Research Part C: Emerging Technologies, Vol. 34, 2013, pp. 16–37. Shafiei, M., M. Nazemi, and S. Seyedabrishami. Estimating time-dependent origin– destination demand from traffic counts: extended gradient method. Transportation Letters, Vol. 0, No. 0, Dec. 2014, p. 1942787514Y.000. Toledo, T., and T. Kolechkina. Estimation of Dynamic Origin–DestinationMatrices Using Linear AssignmentMatrix Approximations. Ieee Transactions on Intelligent Transportation Systems, Vol. 14, No. June 2013, 2012, pp. 618–626. Tavana, H., and H. Mahmassani. Estimation of dynamic origin-destination flows from sensor data using bi-level optimization method. Transportation Research Board 80th Annual Meeting, 2001. Verbas, İ. Ö., H. S. Mahmassani, and K. Zhang. Time-Dependent Origin-Destination Demand Estimation. Transportation Research Record: Journal of the Transportation Research Board, Vol. 2263, No. 1, Dec. 2011, pp. 45–56. Zhou, X., and H. S. Mahmassani. Dynamic Origin–Destination Demand Estimation Using Automatic Vehicle Identification Data. IEEE Transactions on Intelligent Transportation Systems, Vol. 7, No. 1, Mar. 2006, pp. 105–114. Zhou, X., and H. S. Mahmassani. A structural state space model for real-time traffic origin-destination demand estimation and prediction in a day-to-day learning framework. Transportation Research Part B: Methodological, Vol. 41, No. 8, 2007, pp. 823–840. Chen, Y., and F. Street. Improving Online Network Traffic Prediction Through Data Mining and Pattern Matching for Dynamic Origin-Destination Demand Estimation. 2015. Alibabai, H., and H. Mahmassani. Dynamic origin-destination demand estimation using turning movement counts. Transportation Research Record, 2008. Abdelghany, K., A. Hassan, A. Alnawaiseh, and H. Hashemi. Flow-Based and DensityBased Time-Dependent Demand Estimation for Congested Urban Transportation Networks. Transportation Research Record: Journal of the Transportation Research Board, Vol. 2498, 2015, pp. 27–36. Yang, H. Heuristic algorithms for the bilevel origin-destination matrix estimation problem. Transportation Research Part B, Vol. 29, No. 4, 1995, pp. 231–242. Lindveld, C. Dynamic OD matrix estimation: a behavioural approach. 2003. Spall, J. C. An Overview of the Simultaneous Perturbation Method for Efficient Optimization. John Hopkins Applied Physics Laboratory Technical Digest, Vol. 19, No. 4, 1998, pp. 482–492. Cipriani, E., M. Florian, M. Mahut, and M. Nigro. Investigating the efficiency of a gradient approximation approach for the solution of dynamic demand estimation problems. Chapters, 2010.
Shafiei, et.al 1 2 3 4 5 6 7 8 9 10 11 12 13 14 15 16 17 18 19 20 21 22 23 24 25 26 27 28 29 30 31 32 33 34 35 36 37 38 39
23.
24.
25.
26.
27.
28.
29.
30. 31.
32.
33.
34.
16
Tsekeris, T., L. Dimitriou, and A. Stathopoulos. Simultaneous origin-destination matrix estimation in dynamic traffic networks with evolutionary computing. Workshops on Applications of Evolutionary Computation, 2007. Frederix, R., F. Viti, and C. M. J. Tampère. Dynamic origin–destination estimation in congested networks: theoretical findings and implications in practice. Transportmetrica, Vol. 9935, No. July 2015, 2011, pp. 1–20. Frederix, R., F. Viti, W. W. E. Himpe, and C. M. J. Tampère. Dynamic Origin– Destination Matrix Estimation on Large-Scale Congested Networks Using a Hierarchical Decomposition Scheme. Journal of Intelligent Transportation Systems, Vol. 18, No. 1, 2014, pp. 51–66. Frederix, R., F. Viti, C. Ruben, and C. M. J. Tampère. New Gradient Approximation Method for Dynamic Origin-Destination Matrix Estimation on Congested Networks. Transportation Research Record: Journal of the Transportation Research Board, Vol. 2263, 2011, pp. 19–25. Corthout, R., W. Himpe, F. Viti, R. Frederix, and C. M. J. Tampère. Improving the efficiency of repeated dynamic network loading through marginal simulation. Transportation Research Part C: Emerging Technologies, Vol. 41, 2014, pp. 90–109. Ukkusuri, S. V, and S. T. Waller. Single-point approximations for traffic equilibrium problem under uncertain demand. Transportation Research Record, Vol. 1964, No. 1964, 2006, pp. 169–175. Alibabai, H., and H. S. Mahmassani. Perturbation analysis approach to the evaluation of simulated path travel time marginals: application to system optimal dynamic network assignment. 2012. TSS-Transport Simulation System. Aimsun 8 Dynamic Simulators Users ’ Manual. No. July, 2013. Cantelmo, G., E. Cipriani, A. Gemma, and M. Nigro. An adaptive Bi-level gradient procedure for the estimation of dynamic traffic demand. IEEE Transactions on Intelligent Transportation Systems, Vol. 15, No. 3, 2014, pp. 1348–1361. Simoni, M. D., A. J. Pel, R. A. Waraich, and S. P. Hoogendoorn. Marginal cost congestion pricing based on the network fundamental diagram. Transportation Research Part C: Emerging Technologies, Vol. 56, 2015, pp. 221–238. Zheng, N., R. A. Waraich, K. W. Axhausen, and N. Geroliminis. A dynamic cordon pricing scheme combining the Macroscopic Fundamental Diagram and an agent-based traffic model. Transportation Research Part A: Policy and Practice, Vol. 46, No. 8, 2012, pp. 1291–1303. Mahmassani, H. S., M. Saberi, and A. Zockaie. Urban network gridlock: Theory, characteristics, and dynamics. Transportation Research Part C: Emerging Technologies, Vol. 36, 2013, pp. 480–497.