In addition, the sensor EMI and GPR are not compliments to each other. Therefore, its ..... lostanlen.free.fr/cv/pdf/radar99.pdf(last-accessed-on-19/Jan/06) ...
A Sensor Fusion Model for Detection and Classification of Anti-personnel Mines Baikunth Nath and Alauddin Bhuiyan Department of Computer Science and Software Engineering The University of Melbourne Australia 3010 {bnath, bhuiyanm}@csse.unimelb.edu.au
Abstract The Ground penetrating radar (GPR) and Infrared (IR) imaging have become two established sensors for detecting buried anti-personnel mines (APM) which contain no or a little metal. This chapter introduces the GPR and IR techniques briefly and describes particular situations where each technique is feasible. We discuss the GPR and IR data acquisition, signal processing and image processing methods. We also discuss the strengths and weaknesses of each of the sensors based on data capturing efficiency, overcoming environmental difficulties and sensor technology. By providing these comparisons of the two sensors we emphasize the necessity of fusion to harness the advantages of each of the methods. We propose and discuss a geometrical feature based sensor fusion framework, combining GPR and IR, as an effective technique for detection and classification of APM. The proposed sensor fusion reduces the false alarm rate significantly. We consider the basic geometrical shape descriptor features of an object and construct a feature vector for each of the objects. These feature vectors are used to train a Probabilistic Neural Network (PNN) for the classification of APMs. The method gives almost perfect detection accuracy.
1 Introduction Landmines are causing enormous problems (for example, they endanger life and make the land uninhabitable) in a large number of areas throughout the world. Based on the estimation of International Red Cross, there are about ten billion mines buried in eighty countries [1]. Detecting and classifying minimum-metal/non-metal mines buried in soil offers considerable challenges. The insidious nature of mines has stimulated significant research - spanning over more than half a century - on techniques for detecting and identifying
2
Baikunth Nath and Alauddin Bhuiyan
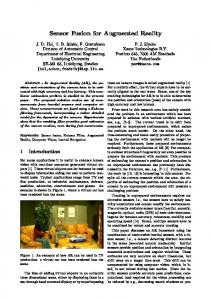
the buried-mines [2]. The most significant tools used for mine detection are GPR and IR camera. Landmines are mainly of two types, anti-tank mines (ATM) and antipersonnel mines (APM), which kill or maim people around the world. ATM is usually large in size and contains metal, so it can be detected by conventional metal detectors. APM on the other hand is smaller in size (60-120mm in diameter and 40-70mm in thickness) (Fig. 1). APM are mostly made of plastic making them more difficult to detect since the dielectric properties of their plastic content are similar to soil. For this reason, the reflected signal from the mine is usually weak and is masked by its background. Most mine detection
Fig. 1. Typical Anti-personnel mines PMN (left) and VS-50 (right).
techniques, based on sensor data and image, consist of signal processing, image processing and decision processes. We will focus our discussion on GPR and IR data acquisition, signal processing and image processing techniques and classification methods for APM. We provide a comparison between the two techniques for justifying their fusion. The proposed GPR and IR geometrical feature level fusion is likely to provide better detection and classification of APM. In recent studies [3],[4],[5],[6] single/hybrid sensors have achieved significant improvement on APM detection. However, there are limitations on soil conditions, ground penetration depth, false alarm rate, classification and orientation of the mine. Classification and orientation of the buried mine is very important for safe and efficient demining. To determine correct classification and orientation we must require better imaging technique based on GPR and IR sensors. For optimum performance, an understanding of the limitations of the sensors induced by the environment like soil type, soil structure, humidity, temperature and vegetation is necessary. Signal processing is the most essential part for GPR data as is the image preprocessing for IR. For a proper analysis of the image to help classify the target, understanding of image processing is essential for both GPR and IR techniques. We discuss particular situations where the two techniques can be most useful and emphasize that no single sensor has the potential to increase mine detection probability and decrease the false alarm rate for all types of mines. Here, we propose a multi-sensor fusion system framework to combine both GPR and IR techniques. This pro-
Sensor Fusion Model for Anti-personnel Mine Detection
3
posed system is likely to decrease the mine detection time while maintaining high probability of mine detection. The rest of the chapter is organized as follows. In Section 2, GPR based APM detection techniques are described. The use of IR imaging for APM detection is given in Section 3. The two techniques GPR and IR, are compared in Section 4 and provide the reasons for proposing sensor fusion. In Section 5, we review some of the existing sensor fusion techniques. The geometrical feature based sensor fusion model is provided in Section 6. Finally, conclusions on the fusion model are drawn in Section 7.
2 Ground Penetrating Radar Techniques In this Section we describe the GPR system, GPR data acquisition method and data processing techniques. Using GPR data we construct image for use in detecting APM. We also discuss some of the signal processing techniques on GPR data, and image processing for enhancing the constructed image to facilitate target detection. 2.1 GPR Systems GPR consists of an active sensor, which emits electromagnetic (EM) waves through a wideband antenna (Transmitter) and collects signals reflected from its surroundings (Receiver). The commonly used frequency band of the GPR, EM wave is between 100 MHz and 100 GHz [7]. However, for APM detection a center frequency of 1 to 2 GHz seem to be a good choice for most types of soil [8]. GPR imaging from data is based on three most important parameters which are the wave speed, polarization and amplitude of the propagating electromagnetic wave field. The height of the antenna above the surface is also the key factor, increasing the height influences the image quality negatively as the spatial resolution is decreased [9]. GPR provides information on both the existence and location of mines. The presence of an object is detected by checking for interruption through the round trip path of the signal. While propagating from the transmitter towards a buried object and being scattered back to the receiver, the electromagnetic waves of the GPR are subject to some losses. In particular, the deeper the object is buried, the higher the loss introduced by soil. In order to compensate for these attenuations in function of R or, more directly, of time t, a time varying gain (TVG) is introduced, by which a fixed gain of X dBs/s (/m) is added to the raw signal s, so the amplified signal in time domain is [10]: ST V G (t) = s(t)10Xt/20
(1)
The distance between the sensor and an object is measured by using the time delay, ∆t, between the emitting and receiving moments of the signal as
4
Baikunth Nath and Alauddin Bhuiyan
r=
ν ∆t 2
(2)
where ν represents the velocity of EM wave in the medium, and r the distance of the object from the GPR sensor. Since many parameters of EM waves, including the velocity, vary according to the content of soil, soil parameter should be estimated prior to taking the measurement [7]. GPR detects any object below the soil surface if it differs from the surrounding medium in the conductivity (metallic targets), the permittivity or the dielectric constant (plastic and non-conducting targets), or the permeability (ferrous metals) [10]. The penetration depth of the wave into the soil usually depends on two factors, the humidity of the soil and the wavelength of EM wave. The content of water in the soil significantly reduces the depth of penetration of a wave with a relatively shorter wavelength. Based on the reflection and penetration properties, GPR works best with low frequency EM waves in dry sand. low frequency signals, however, tend to make low resolution maps of data, which decreases the accuracy of mine detection [2]. 2.2 GPR Data Acquisition The data is generally acquired with a handheld or vehicle mounted GPR scanner by moving it along a line over the places where the mine is buried. The scanner is moved with fairly constant velocity and traces are continuously recorded. The number of traces depends on the area of the minefield or the region and a constant inline step needs to be maintained (average 1-2 cm). The positioning of the radar system is crucial as the distortion of the image takes place due to positioning error. Although, there are some recent developments of sensors which are detecting mines without imaging, we have mentioned earlier that imaging is compulsory if we want to consider the orientation of the mine. The automated data acquisition frame can be used to reduce positioning data error GPR antennas operate in transmitter and receiver pairs to cover a wide search area [11]. A, B and C-scans: GPR data can be represented in three different forms, A-scan, B-scan, and C- scan, according to the number of scanning dimensions. It can be defined with the 3D coordinate system, where the x y-plane represents the ground surface and the z-axis represents the direction into (depth) the ground. The A-scan signal is obtained by a stationary measurement after placing an antenna above a specific position. The collected signal is presented in the form of a group of signal strength versus time delay. A-scanned signal is a 1D signal. B-scan signal is obtained as the horizontal collection from the ensemble of A-scans. The collected 2D signal is presented as intensity on the plane as scan width versus time delay. C-scan signal is obtained from the ensemble of B-scans, measured by repeated line scans along the plane. The collected C-scan signal forms a 3-D signal [24]. In the 3-D coordinate system (Fig. 2), the x and y axes respectively represent the horizontal and
Sensor Fusion Model for Anti-personnel Mine Detection
5
the vertical positions in the plane of the target, and the z-axis represents the depth of the target.
Fig. 2. A 3-D coordinate system defined on a section of ground.
2.3 Preprocessing The acquired data usually has some clutter or noise due to vegetation (e.g. grass, bushes) and the local variations in the material in the ground. It is necessary to remove the clutter to enhance the quality of the data. We can distinguish three kinds of clutter, which can be approached in a different way [13]. The first type of clutter involves everything appearing on and beneath the ground. The interface between air - including the first layer of vegetation and the ground creates a second type of clutter, known as the surface clutter. The third kind, the equipment clutter, is due to the imperfections of system used. Clearly, this will vary a lot from one system to another. At present, the pre-processing step is performed in two different ways: i) signal processing of the GPR raw data (A-scan) and ii) construct an image using the GPR raw data and then enhance this image. Signal Processing The signal processing is performed by different filtering techniques and deconvolution algorithm. The following signal processing techniques are commonly used by researchers in APM detection community. Some of these techniques are briefly described for completeness. •
Application of a horizontal high pass Butterworth filter. This filter reduces the different background signals effectively, but it also modifies the diffraction hyperbola substantially, which reduces the efficiency of this method [27].
6
Baikunth Nath and Alauddin Bhuiyan
•
Application of the Discrete Wavelet transform. This transformation is applied in the horizontal direction and the coefficients of the lowest octaves (which correspond to horizontal energy) are set to zero, and then the inverse transform is applied [27]. • Windowed average subtraction. This is a version of the general average subtraction method. Here the average A-scan is not calculated over the whole B-scan, but only over the A-scans within a window around the signal being considered. This subtraction can adapt to slowly varying signals so that slightly oblique surface reflection can be eliminated [27]. • Removing DC offset and DC offset drift. During data acquisition A-scans suffer from DC (Direct Current) offset or DC offset drift which are removed by applying second order polynomials [15]. • Application of ARMA model. A system identification based clutter removal algorithm using the ARMA model that describes clutter. ARMA model basically considers abrupt changes between clutter and target signal [16]. Fig. 3 (taken from [2]) illustrates the changes in image features after clutter is removed.
Fig. 3. Parametric model background removal (left) and detected hyperbolas in mean-removed background (right).
•
•
• •
Application of Wiener filter. An adaptive version of Wiener filter (adaptive means that it calculates its parameters according to the data present locally in the image) records data which are in the form of Ascans, B-scans and C-scans and can remove the noise for each of the forms [24],[18]. Adoption of basis function. The clutter reduction method is based on basis function decomposition of the SF-GPR time-series from which the clutter and the signal are separated. Finite Impulse Response filter (FIR). FIR enhances the signal part of an A-scan and reduces the background energy [18]. Finite-Difference Time-Domain (FDTD) technique. The EM (Electromagnetic) field values of every last time step and other variables are stored. Parallel implementation of the FDTD algorithm on a using cluster of workstations (COW), which is a time domain method, produces data
Sensor Fusion Model for Anti-personnel Mine Detection
7
in the whole frequency domain by performing only one calculation in time domain [19]. When resonance frequencies are used, FDTD simulation can be applied to detect anti-personnel mine [20]. • Application of F-K filtering. F-K filter can eliminate the artifacts like high amplitude, large saddle corners, low temporal frequencies and high spatial slopes of a frequency-wave-number domain. For GPR signal processing, F-K filter is applied to remove artificial time shifts, gaps in coverage and variations in signal characters [21]. • Robust Linear Prediction (RLP) and Adaptive Shifted and Scaled (ASaS) algorithms. Both RLP and ASaS are based on a flexible data model applicable to rough ground surface clutter removal algorithm [1]. • Karhunen-Loeve Transform (KLT). KLT can eliminate the strong GPR background and enhances greatly the signal-to-noise ratio of the data [22]. • Deconvolution algorithm. Considering the received signal is a convolution of the impulse (frequency) response of transmitter and receiver (which can be estimated beforehand), the deconvolution method is applied to GPR data [23]. By applying deconvolution, the original signal is separated from the received signal that leads to feature extraction of a mine. ARMA modeling provides quantifiable improvement in feature extraction applied to the detection of non-metallic anti-personnel landmines. The Discrete Wavelet Transform and Windowed average subtraction offer the best results in eliminating the various background signals and preserving the diffraction hyperbola. The Wiener filter has been shown as one of the best filters for B-scan data processing as the background and measurement noise get completely attenuated without distorting the signal itself [18]. 2.4 GPR Image Enhancing One of the popular methods of enhancing a GPR image of buried target is to use a simple filtered time-domain back propagation algorithm. Then the inversion method is applied to retrieve more details of the inhomogeneous characters of the buried object [24]. A combination of opening and closing operations can remove noise and smooth the texture in an image. This is called the alternating sequential filter (ASF). The ASF performs well with repetition rather than a single operation. When the contrast between the background and mine target is not (usually) high enough, the Morphological contrast enhancement and Histogram equalization algorithms may be applied [7]. The dielectric properties of plastic mines are similar to the soil and the reflection from the mine is usually weak and masked by background. This is known an inverse scattering. To resolve inverse scattering problem, the inversion method, reduced-order modeling technique, the forward-backward time-stepping (FBTS) method and the gradient-based optimization method may be used [24].
8
Baikunth Nath and Alauddin Bhuiyan
2.5 GPR Image Processing and Target Classification In order to get better detection ability and more accurate indication of the position and size of the buried object, imaging algorithms may be applied on the preprocessed (contrast enhanced) images. For instance, a diffraction stack is used in the spatial and time domain based on an estimation of an image value at a certain position by stacking the data associated with appropriate arrival time for the specific location. It is a flexible technique to handle irregularly positioned data [15]. The linearized forward scattering model is used to invert preprocessed data and obtain the three dimensional distribution of the unknown dielectric permittivity contrast. There are several algorithms to obtain a three-dimensional image from GPR data such as the fast multistage effective inversion algorithm, advanced real-time algorithm and multi-component imaging algorithm [24]. We can apply Focusing algorithm when the real target responses coherently sum together in the imaging process and the non-target features do not focus coherently [25]. Mathematical morphology has been applied primarily for binary image processing. Basic of the first level functions, such as dilation and erosion, are performed by structure elements such as shape and size. Gray-scale morphology can provide more complicated processing, such as gradient extraction, contrast enhancement and region segmentation (watershed algorithm) as well as noise removal and smoothing which are typical applications of binary morphology [7]. Target detection and classification: Target detection and classification algorithms can be applied after either image enhancement or image processing algorithms or both. The APM detection and classification is based on feature extraction, segmentation and matching algorithms. For feature extraction, Karhunen-Loeve transformation (KLT) and Kitller-Young Transformation (KYT) have produced promising feature extraction results in the mine detection area [7]. The amplitudes of the reflections from mines are used as features for object classification. The final image shows a series of hyperbolic arcs from which mine classification may be possible [26]. The Semi-automatic segmentation (cue-based analysis) is another option for mine classification where the user defines the image information (cues) when a software system interprets these cues (such as distance, vector, entropy, intensity and global image parameters) to generate a list of image processing functions. These image processing functions finally enhance, segment and analyze the image for classification [24]. Target detection can also be performed in stages such as feature estimation, feature extraction, object model formulation and final classification [18],[27],[28]. Geometrical features (dimensions, orientation and center) based
Sensor Fusion Model for Anti-personnel Mine Detection
9
on morphological operations of dilations and erosion has also been used to maximize the probability of detection [29]. Feature estimation step reduces the data into a feature vector which represents the target. Feature extraction extracts out of the estimated feature vector only those features that are pertinent to the classification problem. The object model formulation stage determines a set of parametric or non-parametric models for each object class considered. The final classification step then compares the feature vector extracted out of an unknown data sample, with the different class models to determine the likelihood of being part of a mine object.
3 Infrared Imaging Techniques Infrared techniques based on Infrared Imaging and processing of those images to detect APM. Here, we describe in detail the IR image acquisition method. We analyze different image pre-processing techniques that are used for IR image enhancement. Finally, we discuss different image processing and target detection techniques. 3.1 Infrared Camera The use of thermal IR technique is based on the thermal radiation contrast of objects, with respect to their backgrounds. All objects at temperatures greater than absolute zero emit electromagnetic (EM) radiation at wavelengths from 3µm to 100µm is referred to as the thermal IR radiation. The magnitude of spectral radiations of an object depends on its temperature. For landmine detection, landmines are thought of as a thermal barrier in the natural flow of heat inside soil, which produces a perturbation of the expected thermal pattern on the surface. The detection of these perturbations (anomalies) will put into evidence the presence of potential landmine targets [30]. Infrared camera detects infrared energy (heat) difference as low as 15mK and converts it into an electronic signal, which is then processed to produce a thermal image on a video monitor and perform temperature calculations [39],[32]. The IR camera consists of detectors which are transducers and convert the energy of EM radiation into an electrical signal. There are two types of IR detectors, the photon detector and the thermal detector. The photon detector or counter essentially measures the rate of quantum absorption, whereas the thermal detector measures the rate of energy absorption [7]. The processing of images given by thermal scanners can be carried out in two ways. The first is the dynamic approach where an image sequence is processed in one batch, and the second is the static approach where the processing is performed on one individual image. Dynamic thermograph consists of processing a sequence of images of the same scene, submitted to heating or cooling (be it artificial or natural), so that the scene parts follow different
10
Baikunth Nath and Alauddin Bhuiyan
temperature curves in time due to the variability in their specific characteristics (material, volume, shape). The use of thermal infrared (IR) sensors for landmine detection has been of interest to researchers since the 1950s [30]. The Dynamic thermal IR technique has been used since 1980s for nondestructive evaluation [33]. IR images can be captured by active or passive sensing method. The passive IR system senses only natural radiation from the object, while the active IR system provides an extra heat source and receives the artificial radiation created by the heat source. The overall IR detection technique can be summarized by a sequence of steps. The first step is the acquisition of the polarimetric IR image data. The next step is preprocessing polarimetric images for contrast enhancement. Finally, image processing algorithms are applied to facilitate target detection and classification. 3.2 Acquisition of IR Image Data Infrared camera is often used in a vehicle based multi-sensor platform for landmine detection. It may also be used in airborne or in a moving platform for taking images [34],[35],[36]. Polarimetric infrared camera based on a moving platform can acquire images while moving at a constant speed and maintaining a specific angle with the target area. An automated airborne system was introduced for IR data capturing with GPS/INS for the camera positioning accuracy [35]. The polarimetric system is operated in a free running mode in which image sequences are acquired continuously. The method is described as follows. Using a laser distance meter the distance traveled by the platform along the measurement bridge is measured and recorded. Every finite distance interval the laser distance meter gives a trigger pulse. These trigger pulses are recorded along with the images. The exact position of each image in the sequence is estimated using interpolation of the trigger pulses [37]. The detection performance of Infrared camera can be enhanced by means of a Polarization filter. By using this filter not only the differences in thermal properties (for buried and surface-laid landmines) can be observed but also surface properties (for surface-laid landmines) can be acquired [38]. Another significant characteristics for Polarimetric IR is that within the visual and IR bands, polarization gives extra information about objects and their surfaces [39]. Predicting the thermal signature (the temperature differences of soil surface with mine and without mine) which is the key concept of the thermal imaging of a buried landmine requires knowledge of the heat flux into the soil, the thermal properties of the landmine, the soil above the landmine and of the soil surrounding the landmine. Inherent to the cyclic nature of the incoming solar radiation, the thermal signatures of underground anomalies follow a cyclic pattern [40].
Sensor Fusion Model for Anti-personnel Mine Detection
11
3.3 IR Image Pre-processing IR polarization filters were introduced into thermal imaging systems for improving the low target-to-clutter ratio in infrared scene [41]. However, when the contrast between the object and the background is not adequate more processing is necessary and direct segmentation does not work. Some of the significant image pre-processing algorithms are: •
•
Application of image calibration. Noise is added to the desired image because of the vibration of the camera. Camera calibration is one of the simplest ways to reduce this noise. For each angle orientation a cold and a warm calibration is performed. These two calibration sequences give the gain and offset for every pixel. The offset correction removes the reflected image, the emission from the filter and the offset of each pixel [37],[38]. Radiometric Calibration. Provides the radiometric calibrated images after which the image grey values are provided in physical units: W/m2 /sr (Watt per square metre per steradian). The Calibration procedure using two blackbodies (one heated and one at ambient temperature) with temperature sensors on two sides of IR camera, assuming the blackbodies has a uniform temperature over their full surface and has an emission coefficient of 1. The acquired images, I(x, y), are calibrated using eq. (3), after the full scan of the area has been performed [30]. Ic (x, y) = Ir1 +
I(x, y) − Ibb1 (x, y) (Ir2 − Ir1 ) Ibb2 (x, y) − Ibb1 (x, y)
(3)
With Ibb1 (x, y) and Ibb2 (x, y) are average blackbody images, for blackbody 1 and 2, respectively. Iri (i = 1, 2) are the black bodies radiances, estimated using planck’s equation (eq. (4)): Z λ2 2hc2 1 Iri = (4) hc dλ λ5 e λkT i λ1 Where, T i(i = 1, 2) are the measured blackbodies temperature; λ1 and λ2 are respectively the lower and upper bound of the wavelength of the camera. The resulting image radiance Ic (x, y), is directly related to the radiance of the scene. • Application of KLT and KYT. Karhunen-Loeve transformation (KLT) minimizes the object representation error. It selects the main axis (maximum noise component of the variance) and applies the first and second KLT transformations to reduce the noise. Use of Kitller and Young transformation (KYT) leads to an improved mine image (Fig. 4 adapted from [38]) by compensating the noise component and finally have better discriminating ability for mine [43]. • Gaussian filtering. The Gaussian filter or smoothing operator is a 2-D convolution operator that is used to ‘blur’ images. The pre-processing steps also include Gaussian filtering for removing noise in the original image [44].
12
Baikunth Nath and Alauddin Bhuiyan
Fig. 4. Infrared image (left), Karhunen-Loeve image (middle) and Kittler-Young transformed image (right).
•
Morphological filter. The morphological filter can efficiently remove noise by combining multiple morphological operations, and can also provide more complicated processing such as gradient extraction, contrast enhancement. Histogram equalization methods are also used for contrast enhancement [7]. • Application of Pixel fusion. Different IR intensity images taken from the same scene with different orientations of a polarizing filter, and applying the pixel fusion for combining the polarization information for image enhancements [41]. • Pre-whitening filter followed by a matched filter. By considering scaled 3-D Gaussian shapes of mines, while modeling the colored noise as an auto-regressive process, detection of landmines is obtained by applying a pre-whitening filter followed by a matched filter. The matched filter correlates the pre-whitened image sequence to the 3-D object model. Using the local maxima of the output position of the mine is detected [45]. • Wavelet approach. In this denoising technique, the decision whether a coefficient originates from a signal or noise is based on the comparison of its magnitude with a certain threshold [36]. • Autoregressive process. By separately estimating the parameters of the mine and the noise in an alternating fashion, the background noise can be described and eliminated by autoregressive process [46]. 3.4 IR Image Processing and Target Classification Extracting mine-like shapes from the IR sensor image is a crucial task in the mine detection process. After image pre-processing technique(s) the target/mine detection algorithms are applied. One of the most popular methods for mine detection is Tophat filtering. Tophat filtering is a morphological transform that is able to detect local maxima in an image within the region of a structuring element. Detection performance can be improved by using more relevant information in the classification process. One way to include this information is by means of features (size, shape and intensity) of regions of interest (ROI) [37]. For target classification, Nave Bayes classifier [47] and Novel classifier have been used.
Sensor Fusion Model for Anti-personnel Mine Detection
13
Hough transformation and Tophat filtering are used for feature-based detection of land mines to optimize the target features. The feature combination methods based on the Mahalanobis distance and the Fisher mapping have been used [48] for object classification. Detection and classification of mines is also possible by perturbations on the thermal pattern of the soil caused by the presence of buried objects. The procedure is based on the application of a thermal model of the soil. The presence of unexpected objects is made evident by the alterations on the expected pattern, constituting the detection stage of the procedure. Classification is possible by assuming the thermal behavior of mine targets is driven by the thermal properties of the mine explosive [49]. The watershed transformation is used in morphological image segmentation and considered as a topographic region growing method. The mine targets are considered as changes in the vegetation/soil textures. Texture parameters extraction and clustering methods are used for classification of background (vegetation, soil, etc. ) and mine-like objects [36].
4 Comparison of GPR and IR Techniques It is clear from the above sections that collecting data and creating image from the data requires more effort in employing GPR than IR. GPR data needs serious pre-processing at signal processing level to create the image. While IR does not need such type of pre-processing, rather image enhancement is necessary which also is required for GPR to perform a better detection. Since it is easier to interpret visual images than data, IR technique has been widely used for mine detection [7]. On the other hand, GPR data can be controlled by an operator as well as for processing and imaging. In case of GPR, for mine size effects on image; calibration of wavelength is necessary which is proportional to mine size. This is also true for polarization; experiments have shown that circular mine image taken with linear polarization distort the shape of the circular mine [50]. For IR only the mine size has effect on thermal imaging, the larger the mines size the clearer the thermal signatures. The height of the antennae above the surface has influence on the GPR image. As the height increases the spatial resolution decreases [9]. This ultimately causes a blurred image and increases the detection complexity. There is no such type of predicament in case of IR imaging. GPR data capturing is more complicated compared to IR imaging. In GPR technique, usually an operator performs scanning by a hand held system. Both measuring conditions and operator skills pose weaknesses for the GPR scanning method [51]. In contrast, IR imaging is highly dependent on surrounding environment conditions. It is even get biased by operator’s body temperature, and motion and vibration of the camera.
14
Baikunth Nath and Alauddin Bhuiyan
Air-soil interface has a significant effect on both GPR and IR data capturing. In GPR scanning, it introduces the air-soil interface clutter [52] and in IR imaging it causes clutter due to the uneven sunlight absorption of the surface [53]. Rough surfaces lead to distortion in signals on GPR sensing because of the irregular surface reflection. Since IR image is based only on the temperature measurement, soil surface irregularity is not a strong barrier for IR imaging. Moreover, a specialized method of dual-frequency microwaveenhanced infrared thermography (MEIT) is available to minimize the clutter, if any, due to surface irregularities [54]. Soil moisture has strong effect on GPR signals. Experiments have shown that a slight increase in water content in soil around non-metallic landmines improves detection in sand but not in clay [55]. On the other hand, soil moisture has significant positive effect on thermal signature, largest when moist and lowest for dry conditions [56]. GPR can provide object detection with shape (3D structure of the buried mine) and depth information while thermal IR gives shape features only. The additional feature for the IR imaging is that it estimates texture of background clutter and objects [57]. Migration algorithms (both in time and frequency domain) are used in GPR mine detection to give an idea of the exact physical position (depth information) and shape of the reflectors in the subsurface [27]. However, our study has shown that such a technique is not feasible in IR imaging. Wind is another consideration that does not affect GPR mine detection technique but has a significant effect on IR imaging. It has been shown that increase in wind speed decreases the strength of thermal signature which in turn decreases the mine detection rate [40]. It is established that to detect a significant thermal signature of a mine at the surface, for most soils a 10cm is the maximum burial depth [58],[59]. For the GPR based mine detection methods there is no such information available about the maximum burial depth. GPR high frequency signals can provide depth information of the buried mine, but is a limitation for the IR camera technique [60]. Both GPR and IR camera techniques have some advantages and limitations and neither of them is markedly superior to the other. It is clear that neither of them can provide effective information when used in isolation. A hybrid model combining certain features of both the GPR and IR, we believe may provide better performance for detection and classification of APM.
5 Fusion of GPR and IR No single sensor technology has the capability of reaching a good detection rate while having a low false alarm rate in all types of soil and with all types of mines. Hence it is best to use complementary sensor technologies for mine detection and to perform an appropriate sensor fusion with them
Sensor Fusion Model for Anti-personnel Mine Detection
15
[61]. Sensor fusion is the process in which information from different sensors is combined. This can be especially advantageous, when sensors measure independent physical properties: weaknesses of one sensor are compensated by inherent strengths of other sensors, resulting in good performance of the complete sensor suite in a wide variety of conditions [62]. Three fusion architectures are defined based on the amount of processing performed on the sensor data before fusion. These are data-level fusion, feature-level fusion and decision-level fusion [63]. Data-level fusion: In the data-level fusion architecture a minimal amount of processing is performed on data from each sensor before data are combined. Processing is usually limited to calibration, alignment, etc. which are essential to make data useful. The fusion operation in this architecture may comprise stacking, weighted averaging or Kalman Filtering. The mine detection decisions can be made based on the fused data or on features extracted from the fused data. Feature-level fusion: In this architecture features extracted from the raw data of each sensor are merged together to form a fused feature vector. Because feature vectors generally have a much lower dimension than the corresponding raw data, the computational demand at the fusion center and the communication bandwidth requirements can be significantly lower than those in the data-level fusion. The penalty, however, is possibly the lower accuracy of the fused decisions, because of the loss of information occurring during feature extraction at each sensor. Decision-level fusion: In the decision level fusion technique the classification decision is made individually at each sensor and then fused. A variety of techniques have been developed for decision level fusion [58], which may be binary decisions or detection probabilities. Decision-level fusion is, in principle, the least accurate because of the additional loss of information that occurs when sensor data are reduced to decisions. Nonetheless, other considerations such as communication bandwidth and low computational demand at the fusion center make the decision-level fusion attractive in situations dealing with distributed mine detection. The choice of a suitable fusion level depends on the available sensor types. When the sensors are alike, one can opt for fusion at data-level. Feature-level fusion is appropriate when features obtained from different sensors can be combined in a way that provides sufficient information for mine detection. When the sensors are very different, decision-level fusion is more suitable and also computationally more efficient [57]. The above observations show that for GPR and IR the suitable fusion methods are feature-level and decision level. The feature-level sensor fusion was applied in [64] where the processes start with the regions of interest with their features as measured by individual sensors. This includes three steps. First step is object association where the features (object area and intensities) of objects from different sensors are combined to form an associated object. The second step is to classify the features from these associated objects by
16
Baikunth Nath and Alauddin Bhuiyan
feature classification algorithms. The third and final step is the performance evaluation. The decision-level sensor fusion techniques are Bayesian approaches, application of Dempster-Shafer theory, fuzzy probabilities, rules and voting techniques [65],[66]. Here, the individual sensor results are obtained that act as confidence values and are input to the Decision-level sensor fusion algorithms. Decision-level sensor fusion can also exploit the GPR and IR advantages in sensing efficiently into different layers by surface-fusion (extension of decisionlevel sensor fusion). Thermal infrared has the limitations for adding information in the deep layer and GPR has difficulties suppressing clutter in the surface layer. So, the surface-fusion should place emphasis on the IR sensor at the surface layer and at the deep layer in GPR [57]. US Army’s new dual sensor, HSTAMIDS (handheld standoff mine detection system), which combines an electromagnetic induction (EMI) sensor and GPR, is an example of sensor fusion tools. It shows a significant improvement on low metal APM detection which is 93% in average (by experienced operators) and 80% (for trainee) in a simulated mine field (had the proximity of a real mine field) [5],[6]. But it still suffers from high false alarm rate 23%. In addition, the sensor EMI and GPR are not compliments to each other. Therefore, its performance as a sensor fusion module may be not convincing in a real mine field. MINEHOUND is another example of fusion (decision-level) developed by UK Department of International Development and ERA technology which combines MD and GPR. These sensors can work individually or together and provide audio output. At first, MD detects all metal threats and latter GPR mode confirms a present of a threat. The results of the trials showed that it is achieved 100% detection of the mines encountered and an improvement of false alarm rate of better than 5:1 compared with a basic metal detector [3],[4]. But, the concept of fusion is invalidated if we consider only APMs (with no metal). Again, its performance may be varied with high soil moisture, depth and mine size as MD and GPR will not be the compliment of one another. The above mentioned techniques of sensor fusion still need improvement, and suffer from large false alarm rate. Not any of the techniques can efficiently classify APM or provide any information about their orientation. We are proposing the geometrical feature based fusion of GPR and IR which may eliminate these limitations.
6 Sensor Fusion Model We consider the feature-level fusion of GPR and IR imaging as it is more accurate. Our proposed sensor fusion model adopts the geometrical invariant features which may eliminate some of the identified limitations of previous sensor fusion models. Our model also provide higher accuracy and low false
Sensor Fusion Model for Anti-personnel Mine Detection
17
alarm rate. The overall process of the proposed GPR and IR imaging based sensor fusion model is shown in Fig. 5.
Fig. 5. The proposed system for the detection and classification of APM.
6.1 GPR and IR Data We use the 3D GPR data adapted from the technique developed by Milisavljevic et al. [67] for the 3D visualization (Fig. 6) of mines. We simulated the IR data with the same scale as of the GPR data. Since the upper surface, edges and height are represented by different colours in the 3D visualization system, we can apply the edge detection procedure based on their grayscale value.
Fig. 6. 3D GPR image (left), its grayscale image (middle) and simulated IR image (right).
6.2 Feature Extraction Our method is based on the object edge. We applied the perceptual grouping procedure for segmenting line, circle and ellipsoidal shapes. This information is then used to determine the object shape. To achieve this, we first calculate the gradient magnitude and orientation for both GPR and IR image. Then convert these images into binary images and apply the region growing technique [68] and threshold the region with a fixed number of pixels to remove noise (Fig. 7). We search the image for a rectangular or a square shaped object
18
Baikunth Nath and Alauddin Bhuiyan
Fig. 7. Detected edge (left) and out image of region growing and pixel threshold (right).
that is measured from the length, width, height (in pixel length) and their corresponding angle. If no such object is identified, we carry on the operation to find circular or ellipsoidal object that is measured from radius, diameter or perimeter shape/pattern. We considered the IR image to improve upon the confidence value in shape analysis above, as shape is one of the key features in our algorithm. We also calculate the length, width (for rectangular shapes) and radius (circular or ellipsoidal shapes) for calculating the compactness of the object. We use Burns algorithm [69] for extracting the straight lines where pixels are grouped into line-support regions on the basis of gradient orientation and then extract from each region a straight-line segment. From this we pick the endpoints of each line segments and calculate the line length and width as well as the angle. Thus, we are able to measure the rectangular or square shape of the object. We use the Hough transform to detect circular shape object. For that we considered the binary image and fit the pixel position into circle form. For the measurement of height, we applied the colour based edge detection method [70] and find the vertical distance which is the minimum Euclidean distance between one horizontal line to the other. We applied the same procedure on the IR image. The additional feature that we calculate from the IR image is the compactness of the object, defined as the ratio of the square of the perimeter length and 4 × pi × area. Therefore, for each APM we construct a feature vector of length eleven based on the features from GPR and IR image. The features from GPR image are shape (s), length (L) (or diameter 2r), width (W) (or radius r), height (H), ratio of L and W, and ratio of L and H. The features for the IR image are shape, compactness, length (L) and width (W) and ratio of L and W. We then input these feature vectors into a Probabilistic Neural Network (PNN) for detection and classification of APM. 6.3 Probabilistic Neural Network PNN has become an effective tool for solving a variety of classification problems, because of its ease of training and a sound statistical foundation in Bayesian estimation theory. The architecture of a typical PNN [71] is shown in Fig. 8.
Sensor Fusion Model for Anti-personnel Mine Detection
19
Fig. 8. The Schematic diagram of a Probabilistic Neural Network.
The input layer unit does not perform any computation and simply distributes the input to the neurons in the pattern layer. On receiving a pattern x from the input layer, the neuron xij of the pattern layer computes its output [71] · ¸ 1 (x − xij )T (x − xij ) φij (x) = exp − (5) 2σ 2 (2π)d/2 σ d where d denotes dimension of the pattern vector x, is the smoothing parameter and xij is the neuron vector. The summation layer neurons compute the maximum likelihood of pattern x being classified into Ci by summarizing and averaging the output of all neurons that belong to the same class pi (x) =
· ¸ Ni 1 X 1 (x − xij )T (x − xij ) exp − 2σ 2 (2π)d/2 σ d Ni j=1
(6)
where Ni denotes the total number of samples in class Ci . If a priori probabilities for each class are the same, and the losses associated with making an incorrect decision for each class are also the same, the decision layer unit classifies the pattern x in accordance with Bayes’s decision rule based on the output of all the summation layer neurons ˆ C(x) = arg max{pi (x)}, i = 1, 2, ..., m
(7)
ˆ where C(x) denotes the estimated class of the pattern x and m is the total number of classes in the training samples.
20
Baikunth Nath and Alauddin Bhuiyan Table 1. Evaluation of Bifurcation Points Feature vectors GPR
Number of Classified as APM or Noise VS-50 PMN Noise 13 (VS-50) 11 0 2 13 (PMN) 0 12 1 7 (Noise) 1 3 3 IR 13 (VS-50) 10 1 2 13 (PMN) 0 12 1 7 (Noise) 2 2 3 Fusion of 13 (VS-50) 13 0 0 GPR and IR 13 (PMN) 0 13 0 7 (Noise) 0 1 6 Table 2. APM Detection Accuracy Feature No of Features No. of class Accuracy vectors APM Noise (%) GPR 26 7 3 78.8 IR 26 7 3 75.7 GPR and IR Fusion 26 7 3 96.9
6.4 Experimental Results In our experiment, we considered two types of APM: PMN and VS-50. We construct a total of thirteen vectors of length eleven (six features for GPR image and five features for IR image) for each of the mine types. Since the available data is clutter free, for our simulation we construct seven noise/clutter vectors by randomly choosing three features from GPR and two from IR image. The two class-type of APM and the generated class noise/clutter are coded into three classes. In all, we used a total of thirty-three feature vectors for our model to train and test the Probabilistic Neural Network. In Tables 1 and 2, we compare performance of the proposed sensor fusion model with individual GPR and IR feature vectors. The system is implemented using MATLAB and the cross-validation procedure is considered as our data size unfortunately is very small. The results show an average accuracy of 78.8% for GPR and 75.7% for IR, while the fused GPR and IR feature vectors achieve an accuracy of 96.9%. Clearly the results demonstrate that our technique provides better accuracy in detection and classification of APM.
7 conclusion We note that both GPR and IR have some limitations under certain conditions of environment and mine type. It is unlikely that any single technique will provide a breakthrough necessary to substantially improve mine detection effort and time. To achieve substantial decreases in mine detection time while
Sensor Fusion Model for Anti-personnel Mine Detection
21
maintaining high probability of detection and classification as well as a low false alarm rate, an efficient approach is a necessity. Rather than focusing on individual sensor operating in isolation, we have demonstrated that a design of an integrated, multi-sensor system can overcome the limitations of any singlesensor technology. A multi-sensor fusion system that combines geometrical features of GPR and IR is proposed and implemented, and is shown to be significantly better in the detection and classification of APMs.
References 1. Wu R, Liu J, Gao Q, Li H, Zhang B (2005) Progress in the research of Ground Bounce Removal for Landmine Detection with Ground Penetrating radar. Proceedings of Progress in Electromagnetic Research Symposium: 1-5 2. Vitebskiy S, Carin L, Ressler M A (1997) Ultrawideband, short-pulse GroundPenetrating Radar: Simulation and Measurement. IEE transactions on geoscience and remote sensing 35(3): 762-772 3. Daniels D J, Curtis P, Amin R, Hunt N (2006) MINEHOUND trials in Combodia, Bosnia and Angola. Proceedings of SPIE 6217: 1-10 4. Daniels D J, Curtis P, Amin R, Hunt N (2005) MINEHOUND PRODUCTION DEVELOPMENT. Proceedings of SPIE 5794: 488-494 5. Doheny R C, Burke S, Cresci R, Ngan P, Walls R (2005) Handheld Standoff Detection System (HSTAMIDS) Field Evaluation in Thailand. Proceedings of SPIE 5794: 889-900 6. Doheny R C, Burke S, Cresci R, Ngan P, Walls R, Chernoff J (2006) Handheld standoff mine detection system (HSTAMIDS) field evaluation in Namibia. Proceedings of SPIE 6217: 62172-80 7. Paik J, Lee C P, Abidi M A (2002) Image Processing-Based Mine Detection Techniques: A Review. Subsurface Sensing Technologies and Applications 3: 153201 8. Bruschini C, Gros B, Guerne F, Piece P Y, Carmona O (1998) Ground Penetrating Radar and Imaging metal detector for antipersonnel mine detection. Journal of Applied Geophysics 40: 59-71 9. Kruk J V D (2004) Three-dimensional GPR imaging in the horizontal wavenumber domain for different heights of source and receiver antennae. Near Surface Geophysics 2: 21-27 10. Milisavljevic N, Bloch I, Broek S V D, Acheroy M (2003) Improving mine recognition through processing and Dempester-shafer fusion of ground-penetrating radar data. Journal of pattern recognition society 36: 1233-1250 11. Groenenboom J, Kruk J V D, Zeeman J H (2001) 3D GPR data acquisition and the influence of positioning errors on image quality. Proceedings of 63rd Conference and Technical Exhibition: 141-144 12. Zhang J and Nath B (2004) Processing and Analysis of Ground Penetrating radar Landmine detection. Proceedings of The 17th International Conference on Industrial and Engineering Applications of Artificial Intelligence and Expert Systems (IEA/AIE 2004): 1204-1209 13. Lostanlen Y, Uguen B, Chassay G, Griffiths H (1999) Characterisation of the clutter for ultrawideband radar. Proceedings of Radar’99 http://yves. lostanlen.free.fr/cv/pdf/radar99.pdf(last-accessed-on-19/Jan/06)
22
Baikunth Nath and Alauddin Bhuiyan
14. Kempen L V, Sahli H (1999) Ground penetrating radar data processing: A selective survey of the state of art literature. Information retrieval and Interpretation Sciences http://www.etro.vub.ac.be/Publications/technical_reports. asp(last-accessed-on-19/Jan/06 15. Groenenboom J, Yarovoy A G (2005) Data processing for a landmine detection dedicated GPR. UWB technology forum http://www.uwbgroup.ru/eng/ articles/process.htm(last-accessed-on-06/July/2005) 16. Brooks J, Kempen L V, Sahli H (2000) A Primary Study in Adaptive Clutter Reduction and buried Minelike Target Enhancement. Proceedings of the SPIE, Detection and Remediation Technologies for Mines and Minelike Targets V 4038: 1409-1418 17. Zhang J, Liu Q, Nath B (2004) Image segmentation based on competitive learning. Journal of marine science and Application 3: 71-74 18. Sahli H, Nyssen E, Kempen L V, Cornelis J (1998) Feature Extraction and Classification methods for ultra-sonic and radar mine detection. Proceedings of International Multiconference on Computational Engineering in Systems Applications (CESA 98) 4: 82-87 19. Nath B and Zhang J (2004) 4-D GPR Image based on FDDT parallel technique. Proceedings (CD ROM) of the conference of International Federation of Automatic Control (IFAC) 20. Olyslager F, Fortuny J, Franchois A, Nesti G, Sieber A J (1999) Numerical and measurement based study of the resonance frequency technique to detect anti-personnel mines. Ultra-Wideband, Short-pulse Electromagnetics 4. Edited by Heyman et al., Kluwer Academic/Plenum Publishers, New York, pp. 417-424 21. Heincke B, Kruk J V D, Green A G, Horstmeyer H (2004) Processing strategy for 3-D georadar data acquired in areas characterized by rugged topography. Proceedings of Tenth International Conference on Ground Penetrating Radar: 1-4 22. Anxing Z, Yansheng J, Wenbing W (2005) Signal-to-noise Ratio Enhancement in Multichannel GPR Data via the Karhunen-Loeve Transform. Proceedings of Progress In Electromagnetic Research Symposium: 1-4 23. Savelyev T G, Kempen L V, Sahli H (2003) GPR anti-personnel mine detection: improved deconvolution and time frequency feature extraction. Proceedings of the SPIE- Detection and Remediation Technologies for Mines and Minelike Targets 5046: 232-241 24. Zhang J, Nath B (2004) Image processing techniques of landmines: A Review. Proceedings of the international Conference on Intelligent Sensing and Information Processing (ICISIP 2004): 143-148 25. Crisp G N, Hill A J (2002) Humanitarian multi-sensor hand-held mine detector: design of a GPR array. Proceedings of the SPIE- Detection and Remediation Technologies for Mines and Minelike Targets VII 4742: 1029-1037 26. Capineiri L, Falorni P, Windsor C (2002) Buried mine classification from threedimensional radar data. Insight 44(12): 759-764 27. Kempen L V, Katartzis A, Pizurica V, Cornelis J, Sahli H (1999) Digital Signal/Image processing for Mine detection. Part 2: Ground based approach. Proceedings of Euro Conference on Sensor Systems and Signal Processing Techniques applied to the Detection of Mines and Unexploded Ordnance (MINE’99): 54-59 28. Kempen L V, Nyssen E, Sahli H, Cornelis J (1999) Pattern recognition experiments for ultra-sonic and radar AP-Mine detection. Sustainable Humanitarian Demining: Trends, Techniques and Technologies: 297-304
Sensor Fusion Model for Anti-personnel Mine Detection
23
29. Alli G, Bonopera C, Sarri A, Pinelli G, Pasquale G D (2004) Data Processing for mine-detection Polarimetric Ground Penetrating Radar array. Proceedings of Tenth International Conference on Ground Penetrating Radar: 1-4 30. Cremer F, Nguyen TT, Yang L, Sahli H (2005) Stand-off Thermal IR Minefield Survey: System concept and experimental results. Proceedings of SPIE 5794: 209 - 220 31. Cremer F, Jong W D, Schutte K (2002) Infrared Polarization measurements and modeling applied to surface-laid antipersonnel landmines. Optical Engineering 41(5): 1021-1032, 2002 32. Cremer F, Jong W D, Schutte K (2001) Infrared polarization measurements of surface and buried anti-personnel landmines. Proceedings of SPIE- Detection and Remediation Technologies for Mines and Minelike targets VI 4394: 164-175 33. Nguyen T T, Hao D N, Lopez P, Cremer F, Sahli H (2005) Thermal Infrared Identification of Buried Landmines. Proceedings of SPIE- Detection and Remediation Technologies for Mines and Minelike targets X 5794: 1-12 34. Sjokvist S, Lundberg M, Gu I Y H, Ulvklo M (1999) Aspects of an Airborne System for detection of Landmines using multispectral Imaging. Proceedings of SSAB (Swedish Society for Automated Image Analysis) symposium on image analysis http://db.s2.chalmers.se/download/publications/ sjokvist_487.pdf(last-accessed-on-19/Jan/06) 35. Eisl M M, Khalili M (2005) ARC- Airborne Minefield Area Reduction. Final report of Eudem Project, 2001-2003 http://www.arc.vub.ac.be/docs/ Eudem2Scot2003_p265_ARC_1.0.pdf(last-accessed-on-15/Aug/05) 36. Pizurica V, Katartzis A, Cornelis J, Sahli H (1999) What can be expected from Computerized Image Analysis Techniques for Airborne Minefield detection?. Proceedings (CDROM) of 2nd International Symposium on Operationalization of Remote Sensing, Enschede 37. Cremer F, Jong W D, Schutte K (2003) Processing of polarimetric infrared images for landmine detection. Proceedings of 2nd International workshop on advanced ground penetrating radar (IWAGPR): 1-6 38. Cremer F, Jong W D, Schutte K, Liao W, Baertlin B A (2003) Detectibility of Surface-laid Landmines with polarimetric IR sensor. Proceedings of SPIEDetection and Remediation Technologies for Mines and Minelike targets VIII 5089: 1-12 39. Cremer F, Jong W D, Schutte K, Johnson J T, Baertlein B A (2002) Surface mine signature modelling for passive polarimetric IR. Proceedings of SPIE- Detection and Remediation Technologies for Mines and Minelike targets VII 4742: 51-62 40. Dam R L V, Boerchers B, Hendrickx J M H, Hong S (2004) Controlled field experiments of wind effects on thermal signatures of buried and surface-laid landmines. Proceedings of SPIE- Defense and security symposium, 2004 http://infohost.nmt.edu/~rvd/pdf/spie2004_thermal. pdf(last-accessed-on-20/Sep/05) 41. Gonzalez O, Katartziz A, Sahli H, Cornelis J (2001) Pre-processing of polarimetric IR images for landmine detection. Proceedings of 22nd Symposium on Information and Communication Theory: 39-45 42. Cremer F, Schavemaker J G M, Jong W D, Schutte K (2003) Comparison of Vehicle-mounted forward looking polarimetric infrared and downward-looking infrared sensors for landmine detection. Proceedings of SPIE- Detection and Remediation Technologies for Mines and Minelike Targets VIII 5089: 517-526
24
Baikunth Nath and Alauddin Bhuiyan
43. Schachne M, Kempen L V, Milojevic D, Sahli H, Ham P V, Acheroy M, Cornelis J (1998) Mine detection by means of dynamic thermography: simulation and experiments. Proceedings of Detection of abandoned landmines 458: 124-128 44. Coutsomitros C T, Kokonozi A, Andritsos F, Vakalis I, Wijk L V (1999) Target identification in Humanitarian demining using weak activation IR methods. Proceedings of Euroconference- ”Mine 99: 131-136 45. Lundberg M, Gu I Y H (2000) A 3-D Matched Filter for Detection of Land Mines using Spatio-Temporal Thermal Modeling. Proceedings SPIE- Detection Technologies for Mines and Minelike targets 2496: 179-188 46. Lundberg M (2001) Infrared Land Mine Detection by Parametric Modeling. Proceedings of IEEE International Conference on Acoustics Speech and Signal Processing (ICASSP) http://db.s2.chalmers.se/download/publications/ lundberg_849.pdf(last-accessed-on-17/Aug/05) 47. Svensson L, Lundberg M (2002) Dual-band landmine detection using a Bayesian approach. Proceedings of IEEE International Conference on Acoustics speech and signal processing http://db.s2.chalmers.se/download/publications/ svensson_1093.pdf(last-accessed-on-05/Jun/2005) 48. Messelink W A C M, Schutte K, Vossepoel A M, Cremer F, Schavemaker J G M, Breejen E D (2002) Feature-based detection of landmines in infrared images. Proceedings of SPIE- detection and remediation technology for mine and minelike targets VII 4742: 1-12 49. Lopez P, Sahli H, Cabello D (2003) Detection and Classification of Landmines from Infrared Images. Removal and Neutralization of Landmines and UXO http://www.clearfast.vub.ac.be/publications_files/ Lopez_Eudem2Scot_2003.pdf(last-accessed-on-07/Jul/05) 50. Tjuatja S, Bredow J W, Fung A K, Mitchell O R (2000) Radar Imaging of Buried Mine-Shaped Objects. Proceedings of Geoscience and Remote Sensing Symposium: 2391-2393 51. Pregowski P, Swiderski W, Walczak R T, Lamorski K (2000) Buried mine and soil temperature prediction by numerical model. Proceedings of 15th World Conference on Non-Destructive Testing: 1392-1403 52. Lostanlen Y, Uguen B, Chassay G, Griffiths H D (2000) Modelling of Air-soil Interface Clutter for Ultrawideband Radar. Proceedings of IEEE conference- Radar2000 http://yves.lostanlen.free.fr/cv/pdf/ radar00.pdf(last-accessed-on-21/May/05) 53. Lundberg M (2000) Reduction of Surface Clutter in Infrared Images with Visual Wavelength Measurements. Proceedings of the IEEE 2000 International Geoscience and Remote Sensing Symposium (IGARSS’00): 2377-2379 54. Shi T, Sauermann G O, Rappaport C M (2002) Dual-frequency micro-waveenhanced infrared thermography. Subsurface Sensing Technologies and Applications: 379-386 55. Miller T W, Hendrickx J M H, Boerchers B (2004) Radar Detection of Buried Landmines in Field soils. Vadose Zone Journal 3: 1116-1127 56. Dam R L V, Borchers B, Hendrickx J M H, Harmon R S (2003) Effects of soil water content and texture on radar and infrared landmine sensors: implications for sensor fusion. Proceedings of European Demining, 2003 http://www.ees. nmt.edu/Hydro/landmine/pub/eudem2003.pdf(last-accessed-on-19/Jan/06) 57. Schavemaker J G M, Breejen E D, Cremer F, Schutte K, Benoist K W (2001) Depth fusion for anti-personnel landmine detection. Proceedings of SPIE- De-
Sensor Fusion Model for Anti-personnel Mine Detection
25
tection and Remediation Technologies for Mines and Minelike targets VI 4394: 1071-1081 58. Dam R L V, Boerchers B, Hendrickx J M H, Hong S (2003) Soil effects on thermal signatures of buried non metallic landmines. Proceedings of SPIE- Detection and Remediation Technologies for Mines and Minelike Targets VIII 5089: 1210-1218 59. Bruschini C, GrosB (1997) A survey of Current Sensor Technology Research for the detection of landmines. Proceedings of International workshop on Sustainable Humanitarian Demining http://diwww.epfl.ch/w3lami/detec/susdemsurvey. html(last-accessed-on-21/May/05) 60. Haskett H T, Broach J T (1999) Automatic Mine detection Algorithm using Ground penetration Radar Signatures. Proceedings of the SPIE- Detection and Remediation Technologies for Mines and Minelike Targets IV 3710: 942-952 61. Gros B, Bruschini C (1996) Sensor Technologies for the detection of antipersonnel mines A survey of current research and system development. Proceedings of the International Symposium on Measurement and Control in Robotics (ISMCR’96) http://diwww.epfl.ch/w3lami/detec/artismcr96. html(last-accessed-on-19/Jan/06) 62. Cremer F, Breejen E D, Schutte K (1998) Sensor Data Fusion for Anti-personnel Land-mine Detection. Proceedings of EuroFusion98: 55-60 63. Gunatilaka A H (2000) Application of Multisensor Fusion to Improve Landmine Detection, Ph.D Thesis, The Ohio State University 64. Cremer F, Jong W D, Schutte K (2003) Fusion of polarimetric infrared features and GPR features of landmine detection. Proceedings of 2nd International workshop on advanced Ground Penetrating Radar (IWAGPR): 1-6 65. Cremer F, Schavemaker J, Breejen E D, Schutte K (1999) Detection of antipersonnel land-mines using sensor-fusion techniques. Proceedings of EuroFusion99: 159-166 66. Breejen E D, Schutte K, Cremer F (1999) Sensor fusion for anti personnel landmine detection: a case study. Proceedings of SPIE- Detection and Remediation Technologies for Mines and Minelike targets IV 3710: 1235–1245 67. Milisavljevic N, Scheers B, Yvinec Y, Acheroy M (1999) 3D Visualization of Data Acquired by Laboratory UWB GPR in the Scope of Mine Detection. Proceedings of EUROCONFERENCE ON: Sensor systems and signal processing techniques applied to the detection of mines and unexploded ordnance (Mine’99) : 24-30 68. Gonzalez R C, Woods R E, Eddins S L (2004) Digital Image Processing Using MATLAB, Prentice Hall, New Jersey 69. Burns J B, Hanson A R, Riseman E M (1986) Extracting Straight Lines. IEEE Transactions on Pattern Analysis and Machine Intelligence 8(4): 425 - 455 70. Geusebroek J M, Dev A, Boomgaard R V D, Smeulders A W M, Cornelissen F, Geerts H (1999) A scalespace approach to color invariance. Proceedings of the fifth annual conference of the Advanced School for Computing and Imaging (ASCI’99): 383-389 71. Mao K Z, Tan K C, Ser W (2000) Probabilistic Neural Network Structure Determination for Pattern Classification. IEEE Transaction on Neural Networks 11(4): 1009-1016