Psychonomic Bulletin & Review 2008, 15 (3), 638-643 doi: 10.3758/PBR.15.3.638
A similarity-based range–frequency model for two-category rating data Douglas H. Wedell
University of South Carolina, Columbia, South Carolina This research examines whether an extension of range–frequency theory (Parducci, 1965) could successfully predict context effects on discrimination between stimuli for two-category rating data. The new model proposes that similarity comparisons between stimulus values and rating category prototypes take place on an implicit range–frequency scale, and thus it entails effects of context on both mean ratings and discrimination indices. Predictions of the similarity-based range–frequency model were tested in an experiment in which the frequency distribution was manipulated by varying the range and relative frequencies of squares, with participants rating square sizes on a two-category scale. The model provided a parsimonious account of how discriminability of common stimuli increases with a decrease in stimulus range or an increase in the density of stimuli within a subrange.
A well-known feature of category ratings is their dependence on the contextual distribution of stimuli being judged. For example, a target person will receive higher ratings on such dimensions as attractiveness, likeableness, or sociability if the ratings of a recently encountered set of individuals are primarily low on those dimensions (for a review, see Wedell, Hicklin, & Smarandescu, 2007). Although these context effects are quite general and extend to judgments along abstract or complex dimensions, they have been tested most rigorously in the domain of psychophysical judgment, with its careful control of stimulus attributes and context. Such tests have demonstrated strong support for Parducci’s (1965) range–frequency theory of judgment over historically competing models based on one or two contextual referents (Niedrich, Sharma, & Wedell, 2001). Range–frequency theory proposes that two principles are responsible for contextual shifts in evaluations. According to the range principle, judgments describe the dimensional location of the target relative to the subjective minimum and maximum values of the activated contextual distribution. Thus, presenting extreme stimuli that extend the range upward or downward can have profound effects on judgment via the range principle. However, strong context effects can be achieved when the stimulus range is equated across contexts but the relative ranks are manipulated. The frequency principle accounts for these effects by positing that judgments reflect the relative rank within the activated contextual distribution. Following the frequency principle, the mean rating function tends to mimic the percentile rank function for a given distribution. Historically, tests of range–frequency theory have focused on predicting mean ratings and largely ignored predictions of category usage. One exception is Parducci’s (1965) range–frequency limen model, in which the lo-
cations of category boundaries (limens), determined by range–frequency principles, were placed within a Thurstonean categorization framework that predicted proportion of category usage. This approach assumed that range–frequency principles guided placement of category boundaries, whereas stimulus discrimination for pairs common to each context remained context independent. Although the model provided reasonable qualitative fits in early tests, subsequent quantitative tests of the model suggested its inadequacy (Parducci & Perrett, 1971), which appeared to be due largely to the model’s false assumption that discriminability is independent of context. Although one may account for context effects on judgment and discrimination through distinct theoretical mechanisms, it is intriguing to consider how a common mechanism may serve to explain both effects. The range– frequency theoretical framework offers such a mechanism if one assumes that judgment is driven by similarity comparisons on an implicit range–frequency scale. In support of this assertion, Krumhansl (1978) has demonstrated that stimulus densities can increase dissimilarity within a multidimensional space. Furthermore, Wedell (1996) demonstrated that pairwise similarity ratings for stimuli varying along a single dimension were well described by a model in which similarity was a function of the difference in range–frequency subjective values—that is, values that reflect changes in rank differences. Building on this result, I propose a similarity-based range–frequency model in which category ratings derive from comparisons of the range–frequency value of the stimulus to fixed values of category prototypes on the same range–frequency scale. This model predicts increased discriminability between pairs of stimuli common to different contexts when the subjective range is decreased or the rank differences be-
D. H. Wedell,
[email protected]
Copyright 2008 Psychonomic Society, Inc.
638
A Similarity-Based Range–Frequency Model 639 tween targets are increased. The present study tested these predictions by having participants judge sizes of squares as either “large” or “small” for four contextual distributions determined by the factorial combination of range (full or restricted) and shape (bell or U-shaped). The similarity-based range–frequency model for twocategory rating data builds on the basic range–frequency model, in which the subjective judgment of stimulus i in context k on a 0–1 scale can be expressed as follows:
Because of the simplistic categorical structure of unidimensional binary ratings, the similarity-based model can adopt a logistic form under the specific constraint that category prototypes lie outside the range of values being judged.1 For simplification, we further assume that discriminability parameters do not vary with stimulus values so a single discriminability parameter is fit to the data. The equation predicting usage of the category “large” is then as follows:
Si − SMIN , k rankik − 1 J ik = w + (1 − w ) , (1) 1 S − S N − MAX, k MIN , k k where w is the range-weighting value, the first bracketed term is the range value, and the second bracketed term is the frequency value. The range value represents the proportion of the subjective range falling below stimulus i and is given by comparing its value (Si) to minimum and maximum contextual values in context k (Smin,k and Smax,k), where S describes values on a context-independent scale (e.g., square widths for ratings of size). The frequency value represents the proportion of contextual stimuli falling below the stimulus and is calculated using stimulus ranks, where rankik is the rank of stimulus i in context k and Nk and 1 are the maximum and minimum contextual ranks. Unidimensional binary ratings produce a single psychometric function describing the proportion of times each stimulus is assigned to the higher category. A key difference between the proposed model and Parducci’s (1965) limen model concerns how responses map onto the range– frequency Equation 1. Parducci’s model simply uses the range–frequency values to define the stimulus boundaries, which in the two-category case would be the stimulus valued at Jik 5 .5. Proportional category usage is then based on the difference between the stimulus value and the boundary value on an invariant discriminability scale for stimuli common across contexts. Accordingly, if the four experimental distributions tested here produce the same category boundary value, the limen model predicts that the resulting psychometric functions should be identical. The proposed similarity-based model, on the other hand, predicts that, although the psychometric functions may have the same location in all four conditions, the slopes of the functions will differ across conditions, indicating differences in stimulus discriminability for common pairs of stimuli. Specifically, the function should be steeper when the range is narrow and when the stimuli are piled up at the middle. Increases in discriminability of pairs of stimuli common across contexts have been shown to occur with decreases in stimulus range for category ratings (Parducci & Perrett, 1971) and absolute identification (Lockhead & Hinson, 1986). The proposed model additionally predicts that discriminability of common pairs will increase as rank differences between stimuli increase. (Parducci & Perrett, 1971, reported a trend in this direction.) An important feature of the proposed model is that it predicts systematic effects of both range and frequency manipulations on discriminability of common pairs in a category-rating task without fitting separate discriminability parameters to each distribution.
p ( “large ” | Sik =1 1+β1 exp − c ( J ik − .5 , (2) where c is a general sensitivity parameter, .5 is the category boundary placed at the midpoint of the subjective scale, and β1 is the relative bias toward using the category “small.” Basically, Equation 2 states that the similarity process guiding categorization operates on the contextual judgment scale (J scale) described by range–frequency valuation rather than on a separate context-independent scale (S scale). The assumption that subjective values from the range– frequency process provide an implicit scale used in subsequent processing is consistent with the contextual effects on similarity reported by Wedell (1996). Several additional lines of research bolster the idea that distributional manipulations affect the underlying subjective stimulus values upon which other decision and judgment processes may operate. For example, Cooke and Mellers (1998) demonstrated preference reversals that are consistent with participants contextually valuing attributes on range–frequency scales before combining them for an overall evaluation of attractiveness. Stewart and his colleagues (Stewart, Chater, & Brown, 2006; Stewart, Chater, Stott, & Reimers, 2003) have developed contextual theories that are predicated on the idea that rank information provides a basis for contextual valuation that underlies judgment and choice. Thus, although the primary focus of this experiment is to test a model of category usage in a two-category rating task, the results of the present experiment have implications for several recent contextual processing models.
)
{
)}
Method Design and Participants The 183 undergraduates who voluntarily participated for course credit were randomly assigned to one of four conditions generated from the factorial combination of range (full or restricted) and distribution (bell or U-shaped), with specific values of presented stimuli shown in Table 1. Each distribution consisted of seven squares occurring with different frequencies that were presented in blocks of 11 trials, with order randomized within blocks for each participant. The four resulting contextual conditions were full-range-bell (FB), fullrange-U (FU), restricted-range-bell (RB), and restricted-range-U (RU). The dependent variable was ratings on the 2-point scale. Apparatus and Stimuli All instructions and stimuli were presented on microcomputers with 11-in. color monitors. Squares were presented in a 640 3 480 graphics mode (using square pixels) and appeared as yellow blocks on a blue background. A set of 25 squares was constructed with widths varying in 10-pixel increments from 15 to 255 pixels. Table 1 presents the values of the stimuli in the four conditions along with
640 Wedell Table 1 Stimulus Frequencies and Frequency Values for Each Block of 11 Trials Distribution Stimulus Value FB FU RB RU 1 1 . (0) 3 (.10) – – 5 1 (.10) 1 (.30) – – 7 – – 1 . (0) 3 (.10) 9 2 (.25) 1 (.40) 1 (.10) 1 (.30) 11 – – 2 (.25) 1 (.40) 13 3 (.50) 1 (.50) 3 (.50) 1 (.50) 15 – – 2 (.75) 1 (.60) 17 2 (.75) 1 (.60) 1 (.90) 1 (.70) 19 – – 1 (1.00) 3 (.90) 21 1 (.90) 1 (.70) – – 25 1 (1.00) 3 (.90) – – Note—FB, full-range-bell-shaped; FU, full-range-U-shaped; RB, restricted-range-bell-shaped; RU, restricted-range-U-shaped. Frequency values in parentheses represent cumulative proportion of the distribution below the stimulus value.
their frequency values (representing the cumulative proportion of the distribution below that stimulus value). In the full-range sets, sizes varied from 1 to 25, and in the restricted-range sets, sizes varied from 7 to 19. In each set, the seven squares were spaced equally along the size continuum, because previous research had supported a linear relationship between square width and perceived magnitude (Wedell, 1996). In the bell distribution, frequencies of the middle three squares were increased, and in the U distribution, frequencies of the two end stimuli were increased. Procedure Participants, seated at one of five terminals within a large room, were instructed to rate how large or small each square appeared using a 2-point scale (1 5 small and 2 5 large). Participants rated a set of 11 preview trials in which the seven square sizes were presented with their respective frequencies in a random order. Participants were then presented with nine more blocks of 11 trials in a blockrandomized order. A square appeared at the center of the screen until 0.5 sec after a valid rating number was entered. The screen went blank for 2 sec before the next square appeared.
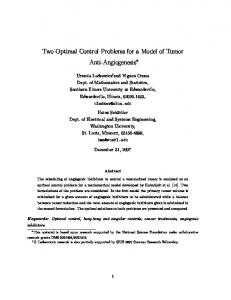
Results Category Proportions The top panels of Figure 1 present the response proportions for the stimuli from the four experimental conditions. Following the predictions of the similarity-based model, functions for bell distributions were steeper than those for U distributions and functions for restricted range were steeper than those for full range. To test the statistical significance of these effects, a repeated measures ANOVA was conducted on the arc sine transformed proportions for the three stimuli common to all four distributions (9, 13, 17), with range and distribution as between-subjects variables and target stimulus as the within-subjects variable. The main effect of stimulus was significant [F(2,358) 5 685.9, p , .001], representing a greater probability of being judged large as size increased in value. The significant interaction between stimulus and range [F(2,358) 5 21.5, p , .001] reflected the greater discriminability among these stimuli for the restricted-range conditions. The significant interaction between stimulus and distribu-
tion [F(2,358) 5 7.2, p , .001] reflected the greater discriminability among these stimuli when occurring within the bell rather than U distributions. Discriminability Measures Some caution must be exercised in generalizing the results reported for the group data to discrimination at the individual level. For example, the aggregate results could reflect a tendency for greater individual differences in locating the category boundary in the full-range and in the U-distribution conditions, with stimulus discriminability being unaffected at the level of the individual. This section presents analyses based on the standard discriminability measure, d′, calculated for individuals. Assuming the Gaussian equal variance case (Green & Swets, 1966), the standard normal deviate for each proportion represents the distance from the stimulus mean to the category boundary. Thus, d′ for a given pair of stimuli (i and j) is given by
(
)
dij′ = Zi − Z j ,
(3)
where Z is the standard normal density transformation of the proportion judged “large” for each stimulus and Si is greater than Sj so that Zi corresponds to hits and Zj to false alarms. The full and restricted sets shared a common range of stimuli, 9–17. In the restricted set, there were five stimulus values in this range, spaced at twostep intervals (9, 11, 13, 15, 17), and so d′ for a two-step comparison could be estimated for each of four adjacent pairs. In the full-range condition, there were just three stimulus values, each spaced four steps apart (9, 13, 17), and so just two estimates of d′ were available, with each divided by 2 to estimate d′ for the two-step difference. Estimates of d′ were averaged together to form a more reliable estimate of the two-step difference. Estimates in the restricted set were based on two-step rather than four-step comparisons to minimize dropping out of usable data points. Table 2 presents the mean values of d′ as a function of contextual condition. Values of d′ were submitted to a 2 3 2 factorial ANOVA. The main effect of range was significant [F(1,126) 5 39.0, p , .001], as was the main effect of distribution [F(1,126) 5 10.8, p , .01], but not their interaction. Planned comparisons of the difference in d′ across distributions were carried out for both levels of range, and each was found to be statistically significant. One problem with the reported ANOVA is that d′ could not be estimated for a substantial number of participants due to adjacent stimuli’s being perfectly discriminated. The number of missing data points were 15, 14, 6, and 18 for FB, FU, RB, and RU distributions, respectively. To test whether the discriminability results hold up when all participants are included in the analysis, the d′ measure was dichotomized into low and high groups. A cutoff of d′ 5 0.8 (close to the median of nonmissing scores) was used to classify participants. Those with missing values were assigned to the high group, since missing data indicated perfect discrimination. A log-linear analysis was then conducted on the frequency data shown in Table 3.
A Similarity-Based Range–Frequency Model 641
Proportion Rated Large
1
1
.9
c � 5.2 β1 � 1.15
.9
.8
β1,FB � 1.61
.8
.7
.7
.6
.6
.5
.5
.4
.4
.3
.3
.2
.2
.1
.1
0
0 0
5
10
15
20
25
0
1
5
10
15
20
25
1 w � .54
.9
Inferred RF Scale
U Bell
.9
.8
.8
.7
.7
.6
.6
.5
.5
.4
.4
.3
.3
.2
.2
SMIN � 6.0
.1
SMIN � 0.0
.1
SMAX � 20.0
0
SMAX � 26.0
0 0
5
10
15
20
25
0
Square Size
5
10
15
20
25
Square Size
Figure 1. Fit of the similarity-based range–frequency model to the two-category data. Top panels portray the model fit to the two-category ratings, with the underlying judgment scales used to generate predictions to data shown in the bottom two panels. Values of fitted parameters are shown in the panels.
Terms were tested by fitting the full model and then determining whether removing a given term led to a significantly poorer fit. The range 3 discriminability term was significant [χ2(1) 5 21.7, p , .01], as was the distribution 3 discriminability term [χ2(1) 5 4.9, p , .05], supporting the conclusion that discriminability increased with increased frequency and decreased range.
Table 2 Average d′ Scores for Two-Step Comparisons in the Stimulus Range 9–17 As a Function of Distribution and Range Range Full Restricted Mean
Distribution Bell U 0.749 (n 5 30) 0.529 (n 5 29) 1.477 (n 5 42) 1.043 (n 5 29) 1.113 0.786
Mean 0.629 1.260 0.945
Fit of the Similarity-Based Range–Frequency Model The similarity-based model was fit to the category proportions using a maximum-likelihood criterion (Wickens, 1982). The criterion to minimize is the statistic 2ln(L), given by
− ln( L ) = − ∑ ln N i! + ∑ ∑ ln f ij ! − ∑ f ij ln pij ,
(4)
where f ij is the observed frequency with which stimulus i was classified in category j, pij is the corresponding predicted probability from the model, and Ni is the frequency of occurrences of stimulus i. Within this framework, the test statistic, G 2 5 2[2ln(L)], is approximately χ2 distributed and can be used to assess whether freeing additional model parameters for a series of nested models provides significantly better fit. Auxiliary descriptive measures of fit included R2 as a measure of proportion of variance ex-
642 Wedell Table 3 Frequency of Participants Classified As High or Low in Stimulus Discrimination As a Function of Range and Distribution Distribution Bell
U
Range High Low Full 25 20 Restricted 44 4 Note—High, d′ $ 0.80; Low, d′ , 0.80.
High 19 34
Low 24 13
plained by the model and SSD, the sum of squared deviations of model proportions from observed proportions. Assuming invariant scale values (S ) were linearly related to square width, square width (φi) was substituted for Si, with the actual equation fit to the data as in Equation 5 (at the bottom of the page), where Fik was the frequency value (or cumulative proportional rank) corresponding to the second bracketed value in Equation 1. To meet the assumptions of the logistic form of the model, φmin,k was fixed at one square size below the actual minimum size presented, φmax,k was fixed at one square size above the actual maximum size presented, and β1k was initially fixed at 1.0, thus allowing only two parameters free to vary, w and c. This version of the model predicted that the psychometric functions would be centered at Square 13, which has a range and frequency value of .5. An examination of Figure 1, however, indicates that the functions were centered on a value closer to Square 12 than to square 13. To model this difference, the category bias parameter ( β1k) was free to vary with context. A model in which β1 was equated for all but the FB distribution did not differ significantly from a model in which β1 varied across the four contexts. As shown in the top panels of Figure 1, the separate value for the FB distribution is reflected in the lower value of the category boundary in that condition. Thus, the final version of the model fit to the data had four free parameters. The fit of this model is quite good, as shown by the close adherence of the data points to the predicted functions in the top panels of Figure 1 [2ln(L) 5 122.3, R2 5 .998, SSD 5 .009]. Note that a comparable fit to the data could be achieved with a context-independent version of the range–frequency model by allowing the c parameter to vary across the four contextual conditions along with two fitted values of β1k. However, this six-parameter model merely fits the context effects on discriminability of common pairs rather than predicts them. Discussion This experiment replicated the finding for category ratings of decreased discriminability for common stimulus pairs with increase in stimulus range (Parducci & Perrett, 1971). It demonstrated the new finding that pairwise
)
(
{
(
discriminability in a category-rating task increases with percentile rank differences, reflected in the steeper functions for bell than for U distributions. These effects on discriminability were verified to occur at the individual level. Because there is only one category boundary for a two-category rating task, models of context effects, such as Parducci’s (1965) limen model, that conceive of contextual manipulations as altering only bias parameters or boundary locations and not the perceived relationship among stimuli cannot account for these data. The proposed similarity-based range–frequency model explained these effects by assuming that comparisons that underlie categorization occur on the contextually altered J scale (i.e., the functions shown in the bottom panels of Figure 1) rather than a context-invariant S scale. Although this model in its present form applies only to two-category rating data, it can be generalized for rating data of more than two categories. More broadly, these results support the idea that the contextual distribution can alter values on which other cognitive processes operate. Thus, similarity judgments may depend on distributional properties of the context (Krumhansl, 1978; Wedell, 1996). Furthermore, preferences underlying judgments and decisions may be on a percentile rank valuation (the frequency principle) that can result in preference reversals and various decision anomalies (Cooke & Mellers, 1998; Stewart et al., 2006; Stewart et al., 2003; Wedell et al., 2007). Therefore, exploration of the implications of basing judgments, categorization, and choices on contextually altered attribute values warrants continued research. Although the proposed model is highly predictive of the two-category rating data, its underlying process assumptions need further fleshing out and testing. Why should the range–frequency scale capture discriminability relations? One possibility builds on the idea that context effects on discriminability may reflect effects of distributing attention across the range or subranges of the stimuli (Luce, Nosofsky, Green, & Smith, 1982). The range–frequency scale could summarize the allocation of this limited attentional resource. Increases in the range result in the same stimulus differences corresponding to smaller scale differences and hence reduced attention. The frequency principle then describes increased attention allocated to subranges of the scale in which ranks change quickly. Other process models that incorporate facets of the range– frequency model have been developed and used to explain a variety of phenomena (Petrov & Anderson, 2005; Stewart, Brown, & Chater, 2005), including sequential effects and absolute identification. The present model is much more limited in scope than these models and is not focused on the sequential, trial-by-trial processes. Thus, it would be interesting to determine how these other models may be applied to explain the data presented here and whether these results are sequence dependent.
p ( “large ” | Sik = 1 1 + β1k exp − c w φι − φMIN , k
) (φ
MAX , k
)
)
})
− φMIN , k + (1 − w Fik − .5 ,
(5)
A Similarity-Based Range–Frequency Model 643 Author Note This research was supported by NSF Grant SBR-9911132. Correspondence regarding this article should be sent to D. H. Wedell, Department of Psychology, University of South Carolina, Columbia, SC 29208 (e-mail:
[email protected]). References Cooke, A. D. J., & Mellers, B. A. (1998). Multiattribute judgment: Attribute spacing influences single attributes. Journal of Experimental Psychology: Human Perception & Performance, 24, 496-504. Green, D. M., & Swets, J. A. (1966). Signal detection theory and psychophysics. New York: Wiley. Krumhansl, C. L. (1978). Concerning the applicability of geometric models to similarity data: The interrelationship between similarity and spatial density. Psychological Review, 85, 445-463. Lockhead, G. R., & Hinson, J. (1986). Range and sequence effects in judgment. Perception & Psychophysics, 40, 53-61. Luce, R. D., Nosofsky, R. M., Green, D. M., & Smith, A. F. (1982). The bow and sequential effects in absolute identification. Perception & Psychophysics, 32, 397-408. Niedrich, R. W., Sharma, S., & Wedell, D. H. (2001). Reference price and price perceptions: A comparison of alternative models. Journal of Consumer Research, 28, 339-354. Parducci, A. (1965). Category judgment: A range-frequency model. Psychological Review, 72, 407-418. Parducci, A., & Perrett, L. F. (1971). Category rating scales: Effects of relative spacing and frequency of stimulus values. Journal of Experimental Psychology, 89, 427-452. Petrov, A. A., & Anderson, J. R. (2005). The dynamics of scaling: A memory-based anchor model of category rating and absolute identification. Psychological Review, 112, 383-416. Stewart, N., Brown, G. D. A., & Chater, N. (2005). Absolute identification by relative judgment. Psychological Review, 112, 881-911. Stewart, N., Chater, N., & Brown, G. D. A. (2006). Decision by sampling. Cognitive Psychology, 53, 1-26. Stewart, N., Chater, N., Stott, H. P., & Reimers, S. (2003). Prospect
relativity: How choice options influence decision under risk. Journal of Experimental Psychology: General, 132, 23-46. Wedell, D. H. (1996). A constructive–associative model of the contextual dependence of unidimensional similarity. Journal of Experimental Psychology: Human Perception & Performance, 22, 634-661. Wedell, D. H., Hicklin, S. K., & Smarandescu, L. O. (2007). Contrasting models of assimilation and contrast. In D. A. Stapel & J. Suls (Eds.), Assimilation and contrast in social psychology (pp. 45-74). New York: Psychology Press. Wickens, T. D. (1982). Models for behavior: Stochastic processes in psychology. San Francisco: Freeman. Note 1. For the two-category case, a prototype model follows the logistic form as long as the two prototypes are outside the stimulus range. A model that compares the stimulus value with each of the category prototypes can be written as follows:
{
)
(
)}
p (C2 | Sik = 1 1 + β1 exp − c Si − S1k − c S2 k − Si , where S2k and S1k are subjective values for the context defined category prototypes. Given that the values for prototypes are outside of the stimulus range, the sign of the expression inside the absolute value signs will not vary with the value of the comparison stimulus, so we can remove the absolute values signs and simplify to yield:
)
(
{
) })
p (C2 | Sik = 1 1 + β1 exp − c Si − .5 ( S1k + S2 k . This result follows the usual logistic form, with the boundary located at .5(S1k 1 S2k) and c representing the sensitivity parameter. In the similaritybased range–frequency model, the internal judgment scale is being used as a basis of comparison and prototypes are defined as 0 and 1, respectively. Thus, as long as Smin,k and Smax,k are designated as falling outside the range of stimulus values, the model reduces to Equation 2. (Manuscript received May 25, 2006; revision accepted for publication November 6, 2007.)