A Simple Algorithm for Ventilation Detection in the Capnography Signal During Cardiopulmonary Resuscitation Mikel Leturiondo1, Jesús Ruiz1, Sofía Ruiz de Gauna1, Digna M González-Otero1, José M Bastida2, Mohamud Daya3 1
2
University of the Basque Country (UPV/EHU), Bilbao, Spain Emergentziak Osakidetza (Basque Health Service), Basque Country, Spain 3 Oregon Health & Science University (OHSU), Portland OR, USA
Abstract During cardiopulmonary resuscitation, excessive ventilation rates reduce the chance of survival. We have developed a simple method to automatically detect ventilations based on the analysis of the capnography signal recorded with monitor-defibrillators. We used 60 out-of-hospital cardiac arrest episodes that contained both clean and chest compressions (CC) corrupted capnograms. The detection algorithm first identified ventilation candidates in the capnography signal. Then, it characterized every candidate by features related to inspiration and expiration durations, and finally a decision system based on static thresholds was applied in order to determine whether each candidate corresponded to a true ventilation. Sensitivity (Se) and positive predictive value (PPV) for the clean set (3905 ventilations) were 99.8% and 99.1%, respectively. With the corrupted set (6778 ventilations) Se and PPV decreased to 85.3% and 85.6%, respectively. For the whole test set (10683 ventilations) Se and PPV were 90.6% and 90.6%, respectively. Detector’s performance clearly degraded when applied to corrupted episodes, this demonstrates the need for techniques to suppress CC artefact to improve ventilation detection.
1.
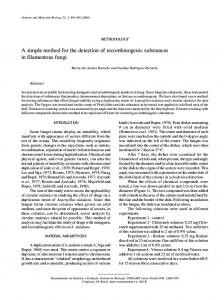
Nevertheless, hyperventilation is often reported for inhospital and out-of-hospital cardiac arrest (OHCA) interventions [2,3]. Previous animal studies revealed that excessive ventilation rates resulted in decreased coronary perfusion pressures and poor outcomes [4]. Continuous guidance of satisfactory ventilation rate is usually achieved from the analysis of the capnography signal. Figure 1 depicts two capnograms in which two ventilation cycles can be observed. Capnography signal fluctuates during ventilation because of changes in the CO2 partial pressure. The partial pressure increases during expiration (exhaled air contains more CO2) and decreases during inspiration. However, the presence of highfrequency oscillations induced by CC in the capnogram is frequent during resuscitation [5]. An example of a capnogram corrupted by CC artefact is shown in Figure 1B. Fast oscillations caused by the rhythmic compression of the chest overlap the capnogram waveform, highly distorting the signal. The presence of CC artefact may affect the reliability of capnogram-based ventilation detection [6].
Introduction
Cardiac arrest is the sudden cessation of the heart’s effective pumping function. Medical treatment of cardiac arrest involves early cardiopulmonary resuscitation (CPR) and early defibrillation. During CPR, ventilations and chest compressions (CC) provide oxygen to the lungs and help oxygenated blood circulate to the vital organs. Highquality CPR is an important factor for the successful resuscitation of cardiac arrest patients. Current resuscitation guidelines recommend providing continuous CC and ventilations with a ventilation rate around 10 per minute for intubated patients in cardiac arrest [1].
Computing in Cardiology 2017; VOL 44
Page 1
Figure 1. OHCA capnography signal segments. A) Clean waveform; B) Capnogram corrupted by oscillations induced by CC.
ISSN: 2325-887X DOI:10.22489/CinC.2017.005-072
In this study, we present a simple method for automated detection of ventilations during CPR, based on the analysis of the capnography signal acquired by monitordefibrillators during OHCA interventions.
2.
Materials and methods
2.1.
Database description and annotation
The resulting annotations were used as the gold standard to test the reliability of the automated capnogram-based ventilation detection algorithm. Clean episodes (30) were randomly and equally split into a training and a test set. Corrupted episodes were added to the test set.
2.2.
The dataset used in this study was a subset (60 episodes) of a large database collected between 2011 and 2016 maintained by Tualatin Valley Fire & Rescue (TVF&R), an advanced life support first response Emergency Medical Services (EMS) agency (Oregon, USA). Episodes were recorded using Heartstart MRx monitor-defibrillators (Philips USA) equipped with a real-time CPR feedback system (QCPR, Laerdal Medical, Norway). For each episode, we extracted three concurrent signals: the transthoracic impedance (TI) signal, acquired from the defibrillation pads; the compression depth (CD) signal obtained from the QCPR system; the capnogram, acquired using sidestream technology (Microstream, Oridion Systems Ltd., Israel). Signals were reviewed and annotated using a customdeveloped Matlab program. Capnograms were timeshifted to compensate delay with respect to CD and TI signals. Three biomedical engineers independently classified the capnograms as clean or corrupted using the CD signal. A capnogram was classified as corrupted if evident CC artefact appeared during more than 1 min of the CC time. Experts also annotated the position of each ventilation using the TI signal as the reference. TI signal was low-pass filtered (2nd-order Butterworth, cut-off frequency of 0.6 Hz) to remove oscillations caused by CC. Thus, slow oscillations caused by ventilations could be more clearly observed in the filtered TI. Figure 2 shows an example of the annotation process. Ventilations were annotated in the position corresponding to a raise in the TI, associated to the inspiration onset (Figure 2, vertical lines). Filtered TI (top panel) appears overlapped to the raw TI (where both oscillations caused by CC and by ventilations are observed).
Capnogram-based ventilation detection
Ventilations produce identifiable variations in the capnogram. A capnogram cycle is composed of a short inspiration time (starting with a CO2 rapid fall to zero) and a longer expiration time (slow raising expired CO2 followed by a plateau). The basis of the ventilation detection algorithm is the identification of the changes between inspiration and expiration phases. The flowchart of the algorithm is presented in Figure 3, and can be described in three main steps: STATE 0 (i = 1) Search upstroke of first likely ventilation (CO2 > T hamp ) tiup t Search downstroke (CO2 < T hamp ) tidw t Search upstroke of next likely ventilation ti+1 t up
ti+1 up
tidw > T hin
no
Search downstroke tidw t
yes tidw
tiup > T hex
no
i
i+1
yes Ventilation detected tv tidw
Figure 3. Flowchart of the ventilation detection algorithm. •
• Figure 2. Example of ventilation annotation.
Page 2
Candidate identification: the algorithm searches % % for abrupt upstrokes, 𝑡#$ , and downstrokes, 𝑡&' , as potential onsets of the expiratory and inspiratory phases, detected when the amplitude of the capnogram exceeds or goes below a fixed threshold, 𝑇ℎ*+$ . Feature extraction: every candidate is characterized by two features extracted from the capnogram signal:
-
•
𝐷./ : Duration of the expiratory phase of a % % ventilation, 𝐷./ = 𝑡&' − 𝑡#$ - 𝐷23 : Duration of the inspiratory phase of % %45 the next ventilation, 𝐷23 = 𝑡#$ − 𝑡&' Candidate classification: each candidate is classified as true ventilation if the computed parameters are above certain thresholds. We applied static thresholds for the expiratory phase duration (𝑇ℎ./ ) and the inspiratory phase duration (𝑇ℎ23 ).
Figure 4 provides a graphical example of the features computed by the algorithm. To take account for observed “double inhalation” effects (Figure 4B), the algorithm discards any candidate for which the inspiratory phase 𝐷23 is below 𝑇ℎ23 , and searches for the next downstroke and upstroke until 𝐷23 exceeds 𝑇ℎ23 .
and 99.0% (98.7-99.3), respectively. Table 1 summarizes Se and PPV results. For the whole test set, comprising 10683 ventilations, global Se and PPV were 90.6% and 90.6%, respectively. For the clean set (3905 ventilations) Se and PPV were 99.8% and 99.1%, respectively. However, with the corrupted set (6778) Se and PPV decreased to 85.3% and 85.6%, respectively. Table 1. Algorithm performance with the test set. n: number of annotated ventilations.
Whole set Clean Corrupted
n 10683 3905 6778
Se (95% CI) 90.6 (90.0-91.1) 99.8 (99.7-99.9) 85.3 (84.4-86.1)
PPV (95% CI) 90.6 (90.0-91.1) 99.1 (98.7-99.3) 85.6 (84.8-86.4)
Figure 5 shows some examples of algorithm’s performance. For each example, the capnogram with the detected ventilations is depicted in the top panel and the TI signal with the annotated ventilations is depicted in the bottom panel.
Figure 4. Graphical definition of the detector parameters.
2.3.
Performance evaluation
We evaluated the algorithm in terms of its sensitivity (Se) and its positive predictive value (PPV). Se was defined as the percentage of annotated ventilations that were correctly detected. PPV was defined as the percentage of detected ventilations that were correct. The maximum admissible tolerance for the position of the detection and the annotation was 500ms. We optimized the algorithm parameters with the clean training set to maximize Se while maintaining PPV above 98%. 95% confidence intervals (95%CI) were computed for both metrics.
3.
Results
The amplitude threshold 𝑇ℎ*+$ for candidate identification was fixed to 3 𝑚𝑚𝐻𝑔. Algorithm optimization was achieved for 𝑇ℎ23 = 0.11 𝑠 and 𝑇ℎ./ = 0.8 𝑠. For the training set (4614 annotated ventilations), Se and PPV were 99.7% (95%CI, 99.5-99.9)
Figure 5. Graphical examples of the algorithm’s performance. (A) Good performance; (B) Ventilation misdetection; (C) False positive; (D) Very poor performance caused by CC artefact.
Page 3
4.
Discussion
5.
Monitoring ventilation rate is one of the recommended uses of the capnogram during CPR, according to current resuscitation guidelines for advanced life support. However, the presence of high-frequency oscillations in the capnogram during CC may compromise the interpretation of the signal. Although a high incidence of this CC artefact has been reported in OHCA episodes [5], the influence of this artefact on the reliability of capnogram-based ventilation detection has not been previously studied. Our algorithm was simple and presented a very good performance with clean capnograms, not affected by CC artefact. One example of good performance was shown in Figure 5A. A few cases of misdetections (Figure 5B) or false positives (Figure 5C) had not a great impact on performance. However, Se and PPV significantly degraded when the algorithm was applied to the corrupted capnograms. CC artefact often appeared overlapping the capnogram from the plateau to the baseline and in the inspiration phase, making detection unreliable (Figure 5D). Other studies proposing alternatives for ventilation detection either with the TI signal or the capnogram have also mentioned the signal limitations due to the presence of CC artefact [6]. Our study has been the first to quantitatively characterize and measure the impact of CC artefact on OHCA capnograms. Our subsequent hypothesis is that automatic ventilation detection would improve if the artefact could be successfully removed from the capnogram. Designing filtering approaches for this aim will be our next step, exploring different alternatives. Our study has several limitations. First, the annotation of TI fluctuations was not straightforward during CPR. Some intervals were discarded because of unreliable TI signal (noise, disconnections) and filtering was needed to remove the CC artefact. The capnogram was sometimes used to confirm the presence of ventilations. No other reference signal was available to be used as an alternative gold standard. Second, ventilations delivered to patients with capnogram below the algorithm amplitude threshold (3 𝑚𝑚𝐻𝑔) cannot be detected. However, in our data this was rarely observed. Finally, data came from a single EMS system and so results may not be generalizable. We need to characterize this further with other EMS systems and monitor-defibrillators.
Conclusions
The important role of capnography waveform in ventilation rate monitoring during CPR is compromised by CC artefact superimposed on the capnogram. Further research should explore filtering techniques to suppress CC artefact in order to improve ventilation monitoring for corrupted capnograms.
Acknowledgements This work received financial support from the Basque Government (Basque Country, Spain) through the project IT1087-16 and the predoctoral research grant PRE-20161-0104. The authors thank the TVF&R EMS providers for collecting the data used in this study.
References [1] Soar J, Nolan JP, Böttiger BW, et al. European Resuscitation Council guidelines for resuscitation 2015. Section 3. Adult advanced life support. Resuscitation 2015;95:100-147. [2] O'Neill JF, Deakin CD. Do we hyperventilate cardiac arrest patients? Resuscitation 2007;73(1):82-85. [3] Maertens VL, De Smedt LE, Lemoyne S, et al. Patients with cardiac arrest are ventilated two times faster than guidelines recommend: an observational prehospital study using tracheal pressure measurement. Resuscitation 2013; 84(7):921-926. [4] Aufderheide TP, Sigurdsson G, Pirrallo RG, et al. Hyperventilation-induced hypotension during cardiopulmonary resuscitation. Circulation 2004; 109(16):1960-1965. [5] Idris AH, Daya M, Owens P, et al. High incidence of chest compression oscillations associated with capnography during out-of-hospital cardiopulmonary resuscitation. Circulation 2010;122:A83. [6] Edelson DP, Eilevstjønn J, Weidman EK, Retzer E, Hoek TLV, Abella BS. Capnography and chest-wall impedance algorithms for ventilation detection during cardiopulmonary resuscitation. Resuscitation 2010;243 81(3):317-322. Address for correspondence. Mikel Leturiondo Sota
[email protected] School of Engineering Alameda Urquijo s/n, 48013-Bilbao (Spain)
Page 4