Journal of Chromatographic Science, Vol. 47, August 2009
A Simple Method for Screening and Quantification of Ricinine in Feed with HPLC and LC–MS Zongyi Wang1,2, Defa Li1, Zhiqiang Zhou2,*, Bingying Li1, and Wenjun Yang1 1Ministry
of Agriculture Feed Safety and Bio-availability Evaluation Center, China Agricultural University, Beijing, P.R. China; of Applied Chemistry, China Agricultural University, Beijing, P.R. China
2Department
Abstract A simple high-performance liquid chromatography (HPLC) and liquid chromatography–mass spectrometry (LC–MS) method for screening and quantification of ricinine in feeds is established for use in feed quality control. Ricinine is extracted from the sample with methanol. The sample extract is directly used for screening with LC–MS and is cleaned up using solid-phase extraction for quantification with HPLC and LC–MS. A 9 min isocratic elution with 10% acetonitrile (v/v) at a flow rate of 0.2 mL/min is performed on an Atlantis dC18 column (5 µm, 2.1 × 100 mm) at ambient temperature with UV detection at 310 nm and MS in positive selective ion recording mode. Good linearity (r2 ≥ 0.99) is found in the investigated concentration ranges from 0.054 to 55.4 µg/mL for HPLC and 5 to 1000 ng/mL for LC–MS. In the final extracts, the limits of detection (LOD) and quantification (LOQ) for HPLC are 75 pg and 150 pg, respectively; the LOD and LOQ for HPLC–MS are 6 pg and 15 pg, respectively.
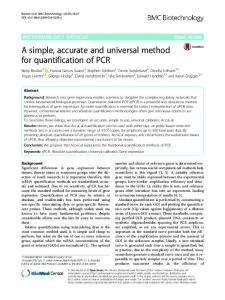
Introduction 3-Cyano-4-methoxy-N-methyl-2-pyridone (Ricinine, see Figure 1) is a toxic alkaloid present in the castor bean plant, Ricirnus communis, and is the only natural source of a cyanosubstituted pyridine compound (1,2). It has a typical LD50 in mice with 25 mg/kg body weight via subcutaneous administration and has been reported to cause major stimulation of the central nervous system (3). Ricinine is also a potent goitrogen (4). Ricinine in foodstuff arises mainly from the contamination with, or illegal (or unsuitable) use of, castor bean meal (CBM). CBM is a by-product of the castor oil industry and has a high protein content. Although many recent studies indicate that detoxified CBM can be used as a protein supplement for animals (5,6,7), this is not recommended in practice because the lethal ricin residue and other anti-nutritive factors can cause chronic poisoning in animals (8,9). Recently, we also observed that CBM can result in feather loss, decreased laying, and histopathologic changes in the ovaries of laying hens. Because it is an endogenous feed toxin, ricinine could be useful as a marker for indirectly evaluating the level of CBM in feeds as part of a toxicological diagnosis of animals. * Author to whom correspondence should be addressed: Department of Applied Chemistry, China Agricultural University, No.2.Yuanmingyuan West Road, Beijing, 100094, P.R. China; email
[email protected].
Analytical methods have been published for determination of ricinine in castor bean plant material itself (10), beverages (11), and urine (12). There are no reports of an analytical method suitable for the analysis of ricinine in feeds containing plant, animal, or mineral material. In the present study, an efficient solvent for extraction of ricinine was selected. A simple clean-up method using solid-phase extraction (SPE) was then developed. Finally, a simple screening method and a quantitative analytical method for ricinine using high-performance liquid chromatography (HPLC) and liquid chromatography– mass spectrometry (LC–MS) were established for the purpose of feed quality control and toxicological diagnosis of animals.
Experimental Reagents and materials
HPLC-grade acetonitrile was purchased from Fisher (Fair Lawn, NJ). Distilled water was purified through a Milli-Q system (Millipore, Bedford, MA). Other chemical reagents used in this study were analytical grade (Beijing Chemical Reagent Co. Beijing, China). Ricinine was purchased from Latoxan (Valence, France). CBM was purchased from Tonghua Castor Chemical Co. Ltd. (Inner Mongolia, China). The feeds used for development of the analytical method were the products of the pilot workshop of the Ministry of Agriculture Feed Industry Center (Beijing, China). The Oasis HLB 1 cc (30 mg) SPE cartridges were purchased from Waters China Limited (Beijing, China). The stock standard solution of ricinine was prepared by dissolving ricinine in methanol at a concentration of 0.5 mg/mL, and this was then stored in a refrigerator at 4ºC. The working standard solutions of ricinine were diluted from stock standard solutions with 30% methanol (v/v) according to requirements. HPLC and LC–MS
The HPLC–MS system was a Waters Associates system consisting of an Alliance 2690 Separation Module, 2487 detector, and ZQ mass spectrometer (Waters Corporation, Milford, MA). Chromatographic separation was achieved on an Atlantis
Reproduction (photocopying) of editorial content of this journal is prohibited without publisher’s permission.
Figure 1. The chemical structure of ricinine.
585
Journal of Chromatographic Science, Vol. 47, August 2009
dC18 column (5 µm particle size, 2.1 mm × 100 mm) (Waters) equipped with a Phenomenex SecurityGuard guard cartridge (4 mm × 3 mm, C18) (Phenomenex, Torrance, CA). Each run consisted of a 9 min period of isocratic elution with 10% acetonitrile at a flow rate of 0.2 mL/min. The UV-detector wavelength was set at 310 nm. Detection by MS was conducted using electrospray mode with positive selective ion monitoring (m/z 165, 138, 84, and 82). The dwell time for each ion was 50 ms. Other parameters of the mass spectrometer were as follows: capillary voltage, 3.0 kV; cone voltage, 40 V; extract voltage, 5 V; RF voltage, 0.5 V; source temperature, 110ºC; nitrogen gas temperature for desolvation, 380ºC; and nitrogen gas flow for desolvation, 400 L/h. Injection volume was 3 µL. Sample preparation for LC–MS screening
A homogenized feed sample (2.0 g) was weighed into a 50mL screw-capped centrifuge tube. After a volume of 20 mL methanol was added, the tubes were shaken on a vortex mixer until the sample was dispersed and put into a 70ºC water bath for a 4 h extraction period. The tubes were then centrifuged at 3000 rpm for 10 min. Approximately 5 mL of supernatant was
filtered through a 0.22-µm filter into an HPLC vial, discarding the initial filtrate, and was then ready for LC–MS analysis. Sample preparation for quantitative analysis
After extraction and centrifugation as described previously, the supernatant was filtered through a filter paper into 50-mL volumetric flasks, and the sediment was re-extracted with 20 mL and then 10 mL of methanol for 10 min each time. The extract was pooled in the 50-mL volumetric flasks and diluted to volume with methanol. A volume of 2 mL of the extract was evaporated under a gentle stream of nitrogen gas until it was just dry, and then reconstituted with 2 mL ammonia solution (0.1 mol/L). One milliliter of the reconstituted extract was applied to SPE cartridges for clean-up. The SPE clean-up steps were: (i) conditioning with 1 mL of methanol followed by 1 mL of water; (ii) loading; (iii) rinsing with 1 mL of water and aspirating to dryness under vacuum; and (iv) eluting ricinine with an accurate volume of 1 mL of 30% methanol (v/v) followed by complete collection of the eluent into an HPLC vial using a syringe. The eluent was then subjected to quantitative analysis.
Results and Discussion Chromatography
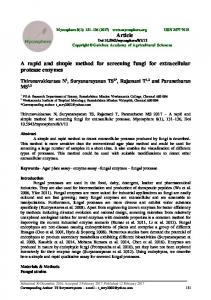
Under the optimized conditions described in the “Experimental” section, the short Atlantis dC18 column provided sufficient retention of the polar alkaloid ricinine to allow quantification. Figure 2 shows representative chromatograms for feed samples. Selection of extraction solvent
Figure 2. Representative chromatograms of ricinine in feed: chromatogram with UV-detector (A); mass chromatogram of m/z 165 (B). Peak 1, pig concentrated feed fortified with 1% CBM-H; peak 2, pig concentrated feed control; peak 3, pig concentrated feed fortified with 0.25% CBM-L; peak 4, pig concentrated feed control.
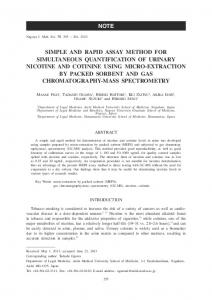
Figure 3. Effect of extraction time on the yield of ricinine.
586
In previous work (10), trichloromethane was used to extract ricinine from castor bean material, but it required a long extraction time. In this study, the solvents methanol, ethanol, dichloromethane, and trichloromethane were compared using the procedures described in the “Sample preparation” section. The efficiency of each reagent is shown in Figure 3. Compared with methanol, the other three solvents showed low extraction efficiency for ricinine. They may not have penetrated the CBM
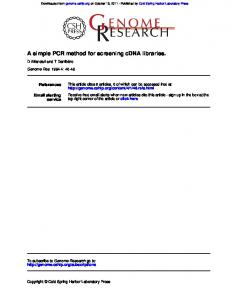
Figure 4. Comparison of ion suppression arising from feed matrices with and without SPE clean-up.
Journal of Chromatographic Science, Vol. 47, August 2009
Table I. Linearity, LOD, and LOQ in Final Extract with the HPLC and LC–MS Methods Method
Investigated range
LOD ± SD (n = 7) (pg)
LOQ ± SD (n = 7) (pg)
Slope
Intercept (Peak area)
Correlation coefficient
Regression equation*
UV MS
0.054–55.4 µg/mL 5.0–1000 ng/mL
75 ± 12.3 6 ± 0.9
150 ± 14.9 15 ± 0.7
1764.4 31601
532.73 326216
0.9992 0.9988
y = 1764.4x + 532.73 y = 31601x + 326216
* Where y is peak area and x is concentration.
could very well reconstitute the residue of sample extract left after evaporation. Acidic or neutral water, on the other hand, did not re-dissolve the residue completely. The Extrelut column (Merck, Germany) has been used for CBM Mean ± SD (mg/g) RSD (%) extraction of ricinine from water with a recovery of 95 ± 5% (10) and Strata-X solid-phase extraction cartridges (PheCBM-H 2.37 ± 0.05 2.1 nomenex) have been used for extraction of ricinine from urine CBM-L 0.31 ± 0.01 2.7 with a recovery of 82% (12). Here, a recovery of close to 100% was obtained using Oasis HLB SPE cartridges and water-based extract Table III. The Accuracy and Precision for Determination of Ricinine in Feed Samples with UV Detection (n = 6) solutions, and using the optimal procedures described in the “Experimental” section. FurTheoretical thermore, the eluent from the cartridge was CBM-H ricinine Found ± SD Recovery RSD injected directly onto the column, so the proFeed added (%) added (µg/g) (µg/g) (%) (%) cedures were simpler than those described in previous reports. Layer complete 10 237 249 ± 7.27 105 2.92 The effects of ion suppression were considfeed 5 118 124 ± 6.08 105 4.90 ered in evaluating the suitability of MS because 1 23.7 21.2 ± 0.72 89.6 3.40 it significantly affects the sensitivity and accuPig concentrated 20 473 459 ± 10.2 105 2.22 racy of quantification, especially for feed samfeed 10 237 246 ± 6.05 104 2.46 ples with complex matrices, where the external 5 118 109 ± 4.13 92.3 3.79 standard method is used. To investigate the 1 23.7 20.5 ± 0.42 86.5 2.08 effects of ion suppression, three representative Layer premix 50 1.18 × 10³ (1.25 ± 0.03) × 103 106 2.19 feeds were used. These were: layer complete 10 237 263 ± 5.52 111 2.10 feed, pig concentrate feed, and layer premix. 5 118 104 ± 1.76 88.2 1.69 The extraction solutions, with and without SPE 1 23.7 19.7 ± 4.67 83.0 2.37 clean-up, were fortified with a ricinine standard at a concentration of 50 ng/mL, and ion supeffectively. Furthermore, methanol is easy to evaporate prior to pression was compared with standard solutions at equivalent changing the solvent before clean-up. Methanol was therefore ricinine concentrations (Figure 4). After SPE clean-up, ion supused as the solvent for extraction of ricinine from the feed pression arising from matrix effects was effectively eliminated. samples because of its relative efficiency. Linearity, LOD, and limit of quantification LC–MS screen of ricinine To determine linearity for the HPLC analysis, a series of The sensitivity and selectivity of LC–MS in selective ion working standard solutions were prepared using serial two-fold monitoring mode made this a suitable method for screening of dilution of the stock standard solution (55.4 µg/mL) to yield ricinine in feed. The extract solution was suitable for direct concentrations of 27.7, 13.8, 6.92, 3.46, 1.73, 0.87, 0.43, 0.22, analysis following filtration. Although considerable ion sup0.11, and 0.05 µg/mL. For LC–MS, another series of working pression was observed, the limit of detection (LOD) of less standard solutions was prepared by serial two-fold dilution of than 50 ng/mL suggested that it was an adequate method for the standard solution (1000 ng/mL) to yield concentrations of this purpose. The simple sample preparation procedure and 500, 250, 125, 62.5, 31.2, 15.6, 7.8, 3.9, and 1.8 ng/mL. Three short elution time made it a suitable method for screening for injections of each concentration were performed. The linearity the presence of ricinine in feed. parameters are shown in Table I. Because no interference with the chromatographic peak of ricinine and no ion suppression SPE clean-up from co-eluting compounds were observed in the feed samples For further clean-up with Oasis HLB SPE cartridges, the after clean-up, linearity was good and this meant that ricinine extracted compounds needed to be transferred to an aqueous in feed samples could be quantified by HPLC and LC–MS using matrix. It was found that 0.1 mol/L of ammonium solution an external standard method. Table II. The Quantitative Results of Ricinine in CBM (n = 6)
587
Journal of Chromatographic Science, Vol. 47, August 2009
analyzed immediately after they were taken. As for the ricinine in CBM, the analyte was also noticed to be stable during the extraction with methanol at 70°C (Figure 3).
Table IV. The Accuracy and Precision for Determination of Ricinine in Feed Samples with MS (n = 6) CBM-L added (%)
Theoretical ricinine added (µg/g)
Found ± SD (µg/g)
Recovery (%)
RSD (%)
Layer complete feed
5 0.5 0.25
15.5 1.55 0.78
14.0 ± 0.63 1.49 ± 0.07 0.80 ± 0.06
90.0 96.1 102
4.50 4.70 7.50
Pig concentrated feed
5 1 0.25
15.5 1.55 0.78
15.7 ± 0.74 1.11 ± 0.08 0.59 ± 0.03
101 71.7 75.6
4.71 7.21 5.08
Layer premix
5 1 0.25
15.5 1.55 0.78
14.0 ± 0.08 0.99 ± 3.58 0.57 ± 0.03
90.2 63.9 72.7
5.71 4.04 5.26
Feed
The LOD and limit of quantification (LOQ) were estimated as the amount of compound injected that produced a signal to noise ratio (peak to peak) of no less than three and ten, respectively, by spiking feed sample extract solutions with ricinine standard. For LC–MS, the LOD and LOQ were obtained based on quantification using the m/z 165 ion. The calculated LOD and LOQ are also listed in Table I. Accuracy and precision
Because CBM is the main source of ricinine in actual feed samples, the evaluation of accuracy and precision was carried out by spiking feeds with CBM and then calculating the recoveries and relative standard deviation (RSD) of ricinine. To obtain a low level of added ricinine in feeds, the CMB was washed with boiling water for 30 min to reduce the content of ricinine and then dried at 110ºC. The concentrations of ricinine in both the CBM used for high level (CBM-H) and low level (CBM-L) ricinine fortification, were determined in advance by HPLC with UV detection as described in the “Experimental” section. SPE clean-up was not needed after extraction with methanol, and the quantitative results are listed in Table II. After chromatographic separation, samples containing high levels of ricinine were analyzed using HPLC with detection by UV, while LC–MS was used for the samples with low levels of ricinine. The recoveries and RSD are listed in Tables III and IV, respectively. It was noticed that relative lower recoveries of ricinine were found in pig concentrated feed and layer premix at low levels of ricinine fortified; Perhaps the ricinine is more difficult to extract in these matrixes at low levels, but this did not hinder applications for the purpose of feed quality control and toxicological diagnosis in animals. Stability
It was reported that ricinine is stable in urine when conditions are 95°C for 1 h and storage at 25°C, 5°C, and –20°C for three weeks (12). In this work, four levels of ricinine fortified (0.010, 0.80, 10, and 50 µg/mL) in the final extract of feed and in methanol–water (3:7, v/v) were stored in laboratory bench condition (23–28°C) for 72 h; the analyte was found stable with 95% confidence by comparing to the results
588
Conclusions The newly-developed solvent extraction LC–MS screening method for ricinine in feeds demonstrated good sensitivity and was simple and inexpensive; the new method for quantification of ricinine in feeds involving SPE clean-up followed by HPLC and LC–MS showed good linearity and precision, and acceptable accuracy. These methods will be useful for feed quality control and for toxicological diagnosis of animals.
Acknowledgment The authors would like to thank the Ministry of Agricultural Feed Industry Center for the financial funding for this study.
Reference 1. G.R. Waller and L.M. Henderson. Biosynthesis of the pyridine ring of ricinine. J. Biol. Chem. 236: 1186–1191 (1961). 2. G.R. Waller and K.S. Yang. The origin of the nitrogen atom of ricinine produced by Ricinus Communis L. Phytochemistry 6: 1637–1641 (1967). 3. A.C. Ferraz, M.E.M. Angelucci, M.L. Da Cost, I.R. Batista, B.H. De Oliveira, and C. Da Cunha. Pharmacological evaluation of ricinine, a central nervous system stimulant isolated from Ricinus Commmunis. Pharmacol. Biochem. Behav. 63(3): 367–375 (1999). 4. D.N. Pahuja, S.V. Gavnekar, D.H. Shah, V.S. Jathar, P.R. Kulkarni, and R.D. Ganatra. Goitrogenic principle from castor seeds. Biochem. Pharmacol. 28(5): 641–643 (1979). 5. S. Anandan, G.K.A. Kumar, J. Ghosh, and K.S. Ramachandra. Effect of different physical and chemical treatments on detoxification of ricin in castor cake. Anim. Feed Sci. Technol. 120: 159–168 (2005). 6. X. Cai, L. Luo, M. Xue, X. Wu, and W. Zhan. Growth performance, body composition and phosphorus availability of juvenile grass carp (Ctenopharyngodon idellus) as affected by diet processing and replacement of fishmeal by detoxified castor bean meal. Aquacult. Nutr. 11: 293–299 (2005). 7. A.K. Garg, P. Singh, V.R. Sastry, B. Sastry, and D.K. Agrawal. Replacement effect of groundnut cake with castor bean meal (Ricinus Communis) in concentrate mixture of adult sheep. Ind. J. Anim. Sci. 75(6): 688–690 (2005). 8. M.S. Rao, N.P. Purushotham, G.V. Raghavan, M.R. Reddy, and M. Mahendar. Studies on the pathology of experimental feeding of detoxified castor bean meal (Ricinus Communis) in sheep. Indian Vet. J. 63(11): 944–946 (1986). 9. J.O.A. Okoye, C.A. Enunwaonye, A.U. Okorie, and F.O.I. Anugwa. Pathological effects of feeding roasted castor bean meal (Ricinus Communis) to chicks. Avian Pathol. 16: 283–290 (1987). 10. S.M. Darby, M.L. Miller, and R.O. Allen. Forensic determination of ricin and the alkaloid marker ricinine from castor bean extracts. J. Forensic Sci. 46: 1033–1042 (2001). 11. H.-U. Melchert and E. Pabel. Reliable identification and quantification of trichothecenes and other mycotoxins by electron impact and chemical ionization-gas chromatography-mass spectrometry, using an ion-trap system in the multiple mass spectrometry mode candidate reference method for complex matrices. J. Chromatogr. A 1056: 195–199 (2004). 12. R.C. Johnson, S.W. Lemire, A.R. Woolfitt, M. Ospina, K.P. Preston, C.T. Olson, and J.R. Barr. Quantification of ricinine in rat and human urine: a biomarker for ricin exposure. J. Anal. Toxicol. 29: 149–155 (2005). Manuscript received July 2, 2007; Revision received October 5, 2007.