Hindawi Publishing Corporation BioMed Research International Volume 2014, Article ID 578698, 5 pages http://dx.doi.org/10.1155/2014/578698
Research Article A Simple Method to Estimate the Number of Autophagic Elements by Electron Microscopic Morphometry in Real Cellular Dimensions Attila L. Kovács Department of Anatomy, Cell and Developmental Biology, E¨otv¨os Lor´and University, Budapest 1117, Hungary Correspondence should be addressed to Attila L. Kov´acs;
[email protected] Received 17 March 2014; Accepted 4 June 2014; Published 3 July 2014 Academic Editor: Ioannis P. Nezis Copyright © 2014 Attila L. Kov´acs. This is an open access article distributed under the Creative Commons Attribution License, which permits unrestricted use, distribution, and reproduction in any medium, provided the original work is properly cited. Autophagic elements typically appear as spherical bodies. During their life they undergo a series of changes (e.g., fusion, degradation of content, and swelling) which influence their size in a way that may be characteristic for cell type, stage of maturation, or various experimentally manipulated parameters. A simple and time efficient method is suggested here to use exactly calculated specific surface values and estimate average diameter and number of autophagic elements in real cellular dimensions. The method is based on the easiest morphometric determination of relative surface (surface density) and volume (volume density) data by electron microscopy. A series of data from real experimental samples of liver and exocrine pancreatic cells are offered to illustrate the potential of these measurements and calculations.
1. Introduction The most frequently applied and easiest method for electron microscopic morphometry is the so-called volumetric measurement, when we determine the volume of some components within a unit of test volume [1–3]. With regard to autophagy it means the determination of the relative volume of an autophagic compartment (𝑉V ) in a unit volume of cytoplasm (𝑉𝑐 ), reasonably expressed as 𝑉V 𝜇m3 /𝜇m3 . It is also possible and easy to determine the relative surface of an autophagic compartment (𝑆V ) within the same system of measurements expressed as 𝑆V 𝜇m2 /𝜇m3 [1, 2]. In addition to traditional point counting, computer aided techniques are also available for this purpose (e.g., NIH ImageJ and Adobe Photoshop). The values that we can get by these morphometric measurements include the total size of both the surface (𝑆V ) and the volume (𝑉V ) of the autophagic elements in 1 𝜇m3 of cytoplasm, also named, respectively, as surface and volume density. 𝑉V data in articles are usually given as multiplied with 100 to show the % volume of the autophagic compartment within the cytoplasm. The theoretical background and the practical description of 𝑆V and 𝑉V measurements are beyond the scope of
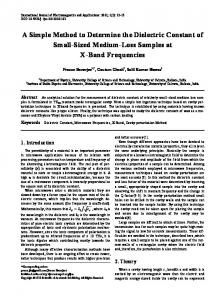
the present paper; however, they are available in a wellillustrated manner in several reviews and books like [1–3]. In short, for the determination of 𝑉V we measure areas and for 𝑆V length of limiting membranes of organelles on images from electron microscopic sections, as basic data for subsequent calculations (Figure 1). While 𝑉V is good to express the total volume of the autophagic compartment in a given volume of cytoplasm, it does not provide any information about the number of autophagic elements behind it. In many cases it would be very useful to estimate at least the approximate number of various autophagic components. These types of data could help to develop, in real cellular dimensions, better understanding of qualities of autophagy which depend on the number of objects. Methods to determine the exact number of components in a given volume (numerical density) have been worked out and are described in detail both in the older literature (based on the analysis of profile histograms [2]) and in the new era of morphometry using the disector technique [3]. However, autophagy is a special object for morphometry as autophagic elements usually comprise a rather small proportion of the cytoplasmic volume; therefore, a very large test area must be evaluated for the measurements by the histograms and
2
BioMed Research International
Figure 1: An electron microscopic picture showing a portion of a pancreatic acinar cell with an autophagosome encircled by double line and an autolysosome, encircled by single line, along their bordering membranes. Autophagosomes and autolysosomes are usually taken as two different categories of autophagic vacuoles. For 𝑉V data we measure the area within the membrane and for 𝑆V data the length of the bordering membrane separating the autophagocytosed material from the cytosol. These data are then related to the size of the surrounding cytoplasmic area during simple morphometric calculations. Scale bar 1 𝜇m.
the dissector technique. The application of these accurate methods for autophagy studies would, therefore, be too time consuming and tedious for routine use. That is the most likely reason why, to my knowledge, such publications have not appeared so far. Here I suggest a simple and efficient approach which utilizes specific surface values (𝑆𝑠𝑝 = 𝑆V /𝑉V 𝜇m2 /𝜇m3 ) for the determination of the number of autophagic elements. To illustrate its potentials I apply it to a large set of data from my previous measurements on liver and exocrine pancreatic cells with variable autophagic activity. The presented method offers approximations with a reasonable bias and can be utilized for a quick and low effort characterization of autophagy by the above parameters. The rough estimations obtained by this approach may also help to select specific cases to be evaluated by the accurate, high investment histogram and disector methods.
2. Results and Discussion 𝑆𝑠𝑝 gives us the surface of the (autophagic) compartment that belongs to a unit volume of the same (autophagic) compartment. The fact that the autophagic elements have the geometry of a sphere as a rule gives us the possibility to estimate their number with the help of their 𝑆𝑠𝑝 . The method of estimation is based on the simple geometrical fact that the surface/volume ratio of a certain sphere is exactly determined by its size. Therefore, for a homogenous population of spheres it is possible to calculate the diameter from their 𝑆𝑠𝑝 value on the base of the following formulas: 𝑆 = 𝐷2 𝜋;
𝑉=
𝐷3 𝜋 ; 6
𝑆𝑠𝑝 =
𝑆 ; 𝑉
𝐷=
6 , 𝑆𝑠𝑝
(1)
where 𝑆, 𝑉, and 𝐷 are the surface, volume, and diameter of a sphere, respectively. To illustrate the technique for the determination of numbers of spheres, let us suppose that we have a homogenous population of spherical bodies in the cytoplasm. We measure 𝑆V and 𝑉V by simple morphometry and compute 𝑆𝑠𝑝 (𝑆V /𝑉V ) with them. With the diameter (𝐷𝑐 ) calculated from 𝑆𝑠𝑝 (𝐷𝑐 = 6/𝑆𝑠𝑝 ), we can also calculate the individual volume of a single sphere in this homogenous population (𝑉𝑐 = 𝐷𝑐3 𝜋/6). As we have the total of individual volumes (𝑉V ), with a single division we can get the precise number of spheres in the unit volume containing those spheres. For example, if in a homogenous population we measure an 𝑆V and 𝑉V of 0,0351 𝜇m2 /𝜇m3 and 0,0041 𝜇m3 /𝜇m3, respectively, the 𝑆𝑠𝑝 from them will be 8,55 𝜇m−1 . This in turn gives a diameter of 0,7 𝜇m with the help of the formula 𝐷𝑐 = 6/𝑆𝑠𝑝 . The volume of a sphere with a diameter of 0,7 𝜇m is 0,180 𝜇m3 . The total volume of the population of spheres in a cell with 5000 𝜇m3 size (the approximate average size of a rat hepatocyte [4]) will be 5000 × 0,0041 = 20,5 𝜇m3 . A single division of the total by the individual volumes (20,5/0,180) will give us the number, which is 114 in this case. This calculation, as mentioned above, gives the precise number for a uniform population of spheres with equal diameter. However, the autophagic elements have variable size which causes a bias in estimating numbers with the presented method. To estimate this bias we can make model calculations with sets of data in the range of real life samples. Although it is only an approximation, for our purpose it is possible to consider the distribution of the diameter values as closely Gaussian. The typical diameter range for autophagosomes in mammalian cells, according to my own unpublished measurements and data derived from various articles [5–9], usually falls within 0,7–1,1 𝜇m. Taking data in this range we can calculate the real average volume and the volume estimated with the help of the diameter derived from the 𝑆𝑠𝑝 value based on the 𝐷𝑐 = 6/𝑆𝑠𝑝 formula (calculations are presented in the Supplementary Material available online at http://dx.doi.org/10.1155/2014/578698). The result of this probe shows an underestimation of the number by a factor of 1,06. Further analysis reveals that the error of estimation depends on the changes in size distribution. Stimulation of autophagy, transition of autophagosomes to autolysosomes, and the following fusion events result in the widening of the distribution together with an appearance of categories with bigger size. The analysis of a probe with a range of 0,7–1,4 𝜇m diameter, and a tail at the right end of the distribution, results in a 15,54% underestimation of the number (see the details of the calculations in the Supplementary Material). Volumetric analysis of autophagy by point counting electron microscopic morphometry works with rather high standard errors [10–18], and sometimes only relatively big changes can be found statistically significant. Results presented here show that although the calculation of numbers of autophagic elements from 𝑆𝑠𝑝 leads to underestimation, the error remains within a rather narrow range. In addition, if considered necessary, they might even be corrected with
BioMed Research International
3
Table 1: Approximate diameter (𝐷𝑐 ), average volume (𝑉𝑐 ), and number of autophagic elements (𝑁𝑐 ) in a cell with 5000 𝜇m3 cytoplasm, calculated from the specific surface values (𝑆𝑣 /𝑉𝑣 = 𝑆𝑠𝑝 ) from real experimental samples of liver and exocrine pancreatic cells. The details of calculation are described in the text. Experimental system and treatment Isolated hepatocytes Plus amino acid mixture 30 min Plus amino acid mixture 3 h Minus amino acid mixture 3 h 30 min Propylamine 10 mM 3 h
Category
𝑆𝑣 𝜇m2 /𝜇m3
𝑉𝑣 𝜇m3 /𝜇m3
𝑆𝑠𝑝 𝜇m2 /𝜇m3
𝐷𝑐 𝜇m
𝑉𝑐 𝜇m3
𝑁𝑐 in 5000 𝜇m3
Afs Al Afs Al Afs Al Afs Al Alam
0,0023 0,0147 0,0047 0,0367 0,0472 0,1333 0,0856 0,0563 0,2925
0,0003 0,0022 0,0006 0,0072 0,0067 0,0215 0,0124 0,0084 0,1170
7,6 6,8 7,4 5,1 7,0 5,9 6,9 6,7 2,5
0,79 0,88 0,81 1,18 0,86 0,97 0,87 0,90 2,40
0,26 0,36 0,28 0,85 0,33 0,47 0,34 0,38 7,24
6 30 11 42 102 195 180 112 81
Afs Al Db Afs Al Db Afs Al Afs Al Afs Al
0,0024 0,0040 0,0088 0,0101 0,0171 0,0079 0,0025 0,0048 0,0778 0,0648 0,0450 0,1095
0,0003 0,0005 0,0008 0,0014 0,0022 0,0008 0,0003 0,0006 0,0105 0,0086 0,0054 0,0278
7,9 7,9 11,0 7,2 7,8 9,9 8,5 8,0 7,4 7,5 8,3 3,9
0,76 0,76 0,55 0,84 0,77 0,61 0,71 0,75 0,81 0,80 0,72 1,52
0,23 0,23 0,08 0,31 0,24 0,12 0,18 0,22 0,28 0,26 0,20 1,85
7 11 47 23 46 34 8 14 189 163 138 75
Afs Al Afs Al Afs Al Afs Al Afs Al
0,0050 0,0061 0,0016 0,0024 0,0447 0,0233 0,1073 0,0401 0,3362 0,3081
0,0007 0,0009 0,0002 0,0003 0,0063 0,0034 0,0159 0,0060 0,0518 0,0517
7,2 6,8 7,9 7,8 7,1 6,8 6,8 6,7 6,5 6,0
0,83 0,89 0,76 0,77 0,85 0,88 0,89 0,90 0,92 1,01
0,30 0,36 0,23 0,23 0,32 0,35 0,37 0,38 0,41 0,53
12 12 4 6 99 48 216 79 626 484
Hepatocytes in vivo 3 h feeding
24 h fasting
Ad libitum feeding Vinblastine treatment 0,1 mg/g 2 h Leupeptin treatment 0,12 mg/g 2 h Exocrine pancreas cells in vivo 24 h fasting Ad libitum feeding Vinblastine treatment 0,1 mg/g 1 h Vinblastine treatment 0,1 mg/g 1,5 h Vinblastine treatment 0,1 mg/g 6 h
Afs: autophagosome (early autophagic vacuole), Al: autolysosome (late autophagic vacuole), Db: dense body, Alam: swollen electron-lucent amine type of autolysosome. The experimental animals were from male mice for in vivo treatments and from rats for isolated cells. The evaluated cytoplasmic area was in the range of 9–16000 𝜇m2 . For further details of electron microscopy, morphometry, and experimental systems see, for example, in [5–10].
the help of size distribution data (see Supplementary Material). Being a sensitive indicator of changes related to the size of autophagic elements, 𝑆𝑠𝑝 is a valuable parameter in itself. The derived 𝐷𝑐 and 𝑁𝑐 values also express quantitative changes with reasonably good approximation. In addition they help to depict the events during autophagy in real cellular dimensions. In the following section I illustrate the utilization of this approach in selected autophagic processes. Some of them
were previously described by volumetric (𝑉V ) evaluation. For the present purpose a review and additional measurements were made to expand our database and support the calculation of 𝑆𝑠𝑝 . Table 1 shows that 𝑆𝑠𝑝 data are characteristically different for various categories of the autophagic-lysosomal compartment. The effect of various experimental treatments is also reflected in their values. The 𝑆𝑠𝑝 is highest (9,9; 11,0) in the case of typical dense bodies resulting in small 𝐷𝑐 (0,61; 0,55 𝜇m).
4 A rather wide distribution of 𝑆𝑠𝑝 data for autolysosomes is revealed in different experimental systems and treatments. Low 𝑆𝑠𝑝 values correlate well with swelling in 3 h amino acid (5,1) or propylamine treatment (2,5) and extensive fusion in leupeptin treatment (3,9). These features are only qualitatively indicated by the simple morphological evaluation of the pictures. It is the population of autophagosomes which appears to be the least heterogeneous. 𝑆𝑠𝑝 values for autophagosomes are 6,5–8,5 which correspond to a 𝐷𝑐 range of 0,71–0,92 𝜇m. The last column of Table 1 shows the calculated number of autophagic structures in a real cellular volume of 5000 𝜇m3 , an average rat liver hepatocyte [4]. For better comparison and simplicity, I have chosen the same volume for the exocrine pancreas cells. The calculated numbers (𝑁𝑐 ) are especially valuable to give a graphic quantitative picture of the autophagic lysosomal compartment in real cellular dimensions. The total number of autophagic elements may span a range of four orders of magnitude (1–1000) in a cell depending on experimental conditions. Immediately after feeding or amino acid treatment, when autophagy and lysosomal protein degradation are minimal, the number of autophagosomes may remain under or close to 10. Autolysosomes, however, are present in the lower range and dense bodies in the middle range of the 101 order of magnitude. Fasting for 24 h in vivo increases the number of autophagosomes several times in liver cells. Nevertheless, the sum of autophagosomes and autolysosomes remains under 100. The number of dense bodies remains similar, although their size becomes bigger after fasting. Total amino acid withdrawal in vitro elevates the autophagosome number over 100 and that of autolysosomes close to 200. The analysis of vinblastine treatments further illustrates the potential of the 𝑆𝑠𝑝 values in approximate calculations of component numbers. This alkaloid disrupts microtubules and inhibits fusion of autophagosomes with endosomes and lysosomes [15, 19, 20]; in addition it also stimulates autophagosome formation [18, 19, 21]. In exocrine pancreatic cells after vinblastine treatment in vivo, we observed both the highest rate of accumulation and the total volume of the autophagic compartment [21]. After a review and additional measurements I calculated with the 𝑆𝑠𝑝 method the component numbers of the autophagic compartment for certain time points. The highest accumulation rate is seen between 1 and 1,5 h of vinblastine treatment while the highest volume at 6 h. The increase of the number of autophagic elements between 1 and 1,5 h is 148. This is the minimum number of autophagosomes generated during this 30 min. Supposing that each autophagosome is created from a single initiation event, we can calculate that the approximate frequency of initiations is 12 seconds in this case. A calculation from the 𝑆𝑠𝑝 values at the maximal volume of the autophagic compartment, 6 h after vinblastine treatment, shows that the number of autophagic elements can exceed 1000 in exocrine pancreatic cells. The increasing interest in autophagy research goes along with the need to apply complex methodological
BioMed Research International approaches. In spite of many new possibilities [20, 22], electron microscopy remains an option and in some cases may prove to be indispensable. The 𝑆𝑠𝑝 method might be a good and simple choice for solving problems where approximation of changes in size distribution and number is necessary.
Conflict of Interests The author declares that there is no conflict of interests regarding the publication of this paper.
References [1] E. R. Weibel, “Stereological principles for morphometry in electron microscopic cytology,” International Review of Cytology, vol. 26, pp. 235–302, 1969. [2] M. A. Williams, Quantitative Methods in Biology, NorthHolland Publishing, Amsterdam, The Netherland, 1977. [3] V. Howard and M. G. Reed, Unbiased Stereology: Three Dimensional Measurement in Microscopy, Bios Scientific Publishers, 1998. [4] E. R. Weibel, W. St¨aubli, H. R. Gn¨agi, and F. A. Hess, “Correlated morphometric and biochemical studies on the liver cell. I. Morphometric model, stereologic methods, and normal morphometric data for rat liver,” The Journal of Cell Biology, vol. 42, no. 1, pp. 68–91, 1969. [5] U. Pfeifer, “Functional morphology of the lysosomal apparatus,” in Lysosomes: Their Role in Protein Breakdown, H. Glaumann and F. J. Ballard, Eds., pp. 3–59, Academic Press, London, UK, 1987. [6] L. Marzella and H. Glaumann, “Autophagy, Microautophagy and Crinophagy as mechanisms of protein degradation,” in Lysosomes: Their Role in Protein Breakdown, H. Glaumann and F. J. Ballard, Eds., pp. 319–367, Academic Press, 1987. [7] P. O. Seglen, “Regulation of autophagic protein degradation in isolated liver cells,” in Lysosomes: Their Role in Protein Breakdown, H. Glaumann and F. J. Ballard, Eds., pp. 371–414, Academic Press, New York, NY, USA, 1987. [8] E. Eskelinen, “To be or not to be? Examples of incorrect identification of autophagic compartments in conventional transmission electron microscopy of mammalian cells,” Autophagy, vol. 4, no. 2, pp. 257–260, 2008. [9] E. Eskelinen, “Maturation of autophagic vacuoles in mammalian cells.,” Autophagy, vol. 1, no. 1, pp. 1–10, 2005. [10] G. E. Mortimore and C. M. Schworer, “Induction of autophagy by amino-acid deprivation in perfused rat liver,” Nature, vol. 270, no. 5633, pp. 174–176, 1977. [11] U. Pfeifer and P. Strauss, “Autophagic vacuoles in heart muscle and liver. A comparative morphometric study including circadian variations in meal-fed rats,” Journal of Molecular and Cellular Cardiology, vol. 13, no. 1, pp. 37–49, 1981. [12] E. Punnonen and H. Reunanen, “Effects of vinblastine, leucine, and histidine, and 3-methyladenine on autophagy in Ehrlich ascites cells,” Experimental and Molecular Pathology, vol. 52, no. 1, pp. 87–97, 1990. [13] C. M. Schworer, K. A. Shiffer, and G. E. Mortimore, “Quantitative relationship between autophagy and proteolysis during graded amino acid deprivation in perfused rat liver,” Journal of Biological Chemistry, vol. 256, no. 14, pp. 7652–7658, 1981.
BioMed Research International [14] P. O. Seglen and A. Reith, “Ammonia inhibition of protein degradation in isolated rat hepatocytes. Quantitative ultrastructural alterations in the lysosomal system,” Experimental Cell Research, vol. 100, no. 2, pp. 276–280, 1976. [15] A. L. Kov´acs, A. Reith, and P. O. Seglen, “Accumulation of autophagosomes after inhibition of hepatocytic protein degradation by vinblastine, leupeptin or a lysosomotropic amine,” Experimental Cell Research, vol. 137, no. 1, pp. 191–201, 1982. [16] A. L. Kov´acs, G. R´ez, Z. P´alfia, and J. Kov´acs, “Autophagy in the epithelial cells of murine seminal vesicle in vitro: formation of large sheets of nascent isolation membranes, sequestration of the nucleus and inhibition by wortmannin and 3-methyladenine,” Cell and Tissue Research, vol. 302, no. 2, pp. 253–261, 2000. [17] E. Eskelinen, A. R. Prescott, J. Cooper et al., “Inhibition of autophagy in mitotic animal cells,” Traffic, vol. 3, no. 12, pp. 878– 893, 2002. [18] J. Kov´acs, L. L´aszl´o, and A. L. Kov´acs, “Regression of autophagic vacuoles in pancreatic acinar, seminal vesicle epithelial, and liver parenchymal cells: a comparative morphometric study of the effect of vinblastine and leupeptin followed by cycloheximide treatment,” Experimental Cell Research, vol. 174, no. 1, pp. 244–251, 1988. [19] R. K¨ochl, X. W. Hu, E. Y. W. Chan, and S. A. Tooze, “Microtubules facilitate autophagosome formation and fusion of autophagosomes with endosomes,” Traffic, vol. 7, no. 2, pp. 129–145, 2006. [20] D. J. Klionsky, H. Abeliovich, P. Agostinis et al., “Guidelines for the use and interpretation of assays for monitoring autophagy in higher eukaryotes,” Autophagy, vol. 4, no. 2, pp. 151–175, 2008. [21] G. R´ez, J. Cs´ak, E. Fellinger et al., “Time course of vinblastineinduced autophagocytosis and changes in the endoplasmic reticulum in murine pancreatic acinar cells: a morphometric and biochemical study,” European Journal of Cell Biology, vol. 71, no. 4, pp. 341–350, 1996. [22] D. J. Klionsky, A. M. Cuervo, and P. O. Seglen, “Methods for monitoring autophagy from yeast to human,” Autophagy, vol. 3, no. 3, pp. 181–206, 2007.
5
International Journal of
Peptides
BioMed Research International Hindawi Publishing Corporation http://www.hindawi.com
Volume 2014
Advances in
Stem Cells International Hindawi Publishing Corporation http://www.hindawi.com
Volume 2014
Hindawi Publishing Corporation http://www.hindawi.com
Volume 2014
Virolog y Hindawi Publishing Corporation http://www.hindawi.com
International Journal of
Genomics
Volume 2014
Hindawi Publishing Corporation http://www.hindawi.com
Volume 2014
Journal of
Nucleic Acids
Zoology
International Journal of
Hindawi Publishing Corporation http://www.hindawi.com
Hindawi Publishing Corporation http://www.hindawi.com
Volume 2014
Volume 2014
Submit your manuscripts at http://www.hindawi.com The Scientific World Journal
Journal of
Signal Transduction Hindawi Publishing Corporation http://www.hindawi.com
Genetics Research International Hindawi Publishing Corporation http://www.hindawi.com
Volume 2014
Anatomy Research International Hindawi Publishing Corporation http://www.hindawi.com
Volume 2014
Enzyme Research
Archaea Hindawi Publishing Corporation http://www.hindawi.com
Hindawi Publishing Corporation http://www.hindawi.com
Volume 2014
Volume 2014
Hindawi Publishing Corporation http://www.hindawi.com
Biochemistry Research International
International Journal of
Microbiology Hindawi Publishing Corporation http://www.hindawi.com
Volume 2014
International Journal of
Evolutionary Biology Volume 2014
Hindawi Publishing Corporation http://www.hindawi.com
Volume 2014
Hindawi Publishing Corporation http://www.hindawi.com
Volume 2014
Molecular Biology International Hindawi Publishing Corporation http://www.hindawi.com
Volume 2014
Advances in
Bioinformatics Hindawi Publishing Corporation http://www.hindawi.com
Volume 2014
Journal of
Marine Biology Volume 2014
Hindawi Publishing Corporation http://www.hindawi.com
Volume 2014