Appl. Phys. B 88, 21–28 (2007)
Applied Physics B
DOI: 10.1007/s00340-007-2668-9
Lasers and Optics
n. strauß1 i. ernsting1 s. schiller1 a. wicht1,u p. huke2 r.-h. rinkleff2
A simple scheme for precise relative frequency stabilization of lasers 1
Institut für Experimentalphysik, Heinrich-Heine-Universität Düsseldorf, Universitätsstr. 1, 40225 Düsseldorf, Germany 2 Institut für Gravitationsphysik, Leibniz Universität Hannover, Callinstr. 38, 30167 Hannover, Germany
Received: 2 April 2007 Published online: 22 May 2007 • © Springer-Verlag 2007 ABSTRACT We present a simple scheme for tuneable relative frequency stabilization of lasers. A highly sensitive and accurate frequency-to-voltage converter is used to derive an error signal from the beat note between two lasers. We analyze in detail detector noise and drift, modulation detection bandwidth, and cross-talk from power modulation. The results indicate that sub-kHz relative linewidth and a locking point drift on the order of 100 Hz for times scales of 1 h are achievable. The scheme can, therefore, be applied to situations where up to now only optical PLLs could provide sufficient accuracy and precision. To demonstrate its potential for high-resolution, high-precision spectroscopy we lock a diode laser to a fs-frequency comb and find a relative linear drift of 314 Hz during a 2.8 h period. PACS 42.62.Fi;
1
42.62.Eh
Introduction
Many applications of laser physics require relative frequency stabilization of a laser to some reference at a predetermined offset frequency. Sometimes, this offset frequency has to be tunable. One example is laser cooling, where the cooling laser has to be red-detuned with respect to an atomic resonance. Highly accurate high-resolution spectroscopy can be implemented, for example, by means of locking a laser to a comb line of an absolutely stabilized fs-frequency comb at a tunable offset frequency. Experiments aiming at the investigation of atomic coherence phenomena (EIT [1], EIA [2, 3]) require multi-chromatic laser fields with accurate and stable difference frequencies. A well-known implementation of relative laser frequency stabilization is based on the transfer cavity concept [4], where two lasers are locked to different longitudinal modes of a common reference cavity. If high precision is required the cavity has to feature narrow linewidth. This limits the frequency noise detection bandwidth as well as capture range of the lock. A different approach is laser phase-locking [5], where the phase difference between the fields emitted by two lasers is stabilized to a stable rf reference signal. This method provides superior relative frequency stability. However, it is more u Fax: +49-211-8113116, E-mail:
[email protected]
challenging than any other locking scheme because it poses the most stringent requirements on frequency noise reduction. Typically, especially for applications where diode lasers have to be stabilized, phase-locking requires MHz servo bandwidths. If this cannot be provided digital phase detectors with build-in pre-scalers are used for phase stabilization, because these allow for larger residual phase errors. However, this only comes at the price of detector bandwidth reduction. Further, digital phase detectors are only suited for applications that provide an excellent rf signal-to-noise ratio. Hence, although phase stabilization provides superb stability, it will be too demanding for applications which require the frequency stability and accuracy to be at the kHz to MHz level. A very elegant and surprisingly simple locking scheme has been demonstrated by Schünemann et al. [6]. The authors implemented a Mach–Zehnder type interferometer for the rf beat note signal between two lasers. Because the two arm lengths are not equal, an rf frequency dependent phase shift arises at a mixer that comprises the output of the rf interferometer. A variation of the path length difference provides tuning of the locking point, so that difference frequencies between 10 MHz and many GHz can be implemented. Its main shortcomings are detector offset drifts, the existence of multiple locking points (at frequencies f n which satisfy ψn = 2π f n ∆l/c = (4n + 1)π/2) and the fact that the detector responsivity dU/d f ∝ dψ/d f ∝ ∆l/c and detector phase lag (δϕ = 2π f MOD ∆l/c) are proportional to another. Hence, increasing the arm length difference l provides larger responsivity but at the same time increases the number of locking points and also reduces the achievable servo bandwidth due to the corresponding increase of detector phase lag δϕ. The application of a digital frequency-to-voltage converter was described by Stace et al. [8]. However, as for phase-locked-loops based on digital phase detectors, it requires an excellent signal-to-noise ratio: in their experiment the authors could rely on a signal-to-noise ratio exceeding 60 dB in a 300 kHz bandwidth. This setup could only be operated at rf frequencies below 8 MHz and the modulation detection bandwidth was significantly smaller than 500 kHz. The latter limits the servo bandwidth achievable in a frequency stabilization setup typically to a few 10 kHz. Lately Ritt et al. [7] have demonstrated a slightly different stabilization scheme. It applies the amplitude transfer function of a steep rf low-pass filter to realize a sensitive analog frequency-to-voltage converter. The main idea is to power-
22
Applied Physics B – Lasers and Optics
split the incoming rf signal into two channels, one of which is transmitted through a low-pass filter. The outputs of the two channels are then compared with respect to their rf power level. Due to the frequency dependent transmission of the signal through the low-pass filter the power difference between the two channels varies with frequency, which provides the frequency-to-voltage conversion. This locking scheme features a single locking point. The locking point frequency is determined by the low-pass filter selection. To some degree, this scheme also overcomes problems related to the proportionality between detector responsivity and detector phase lag which are encountered in the rf interferometer locking scheme described above. We have developed a frequency-to-voltage converter which is based on the same principle. Initially, it was designed for atomic-coherence experiments [9]. We have now carefully revised its design such that for the first time a locking scheme which is based on an rf frequency-to-voltage converter can be used for highly precise, highly accurate spectroscopy in the optical domain. In this paper we discuss the performance of our “frequency detector” in detail: we compare the frequencyto-voltage conversion function for two different low-pass filter selections and analyze the frequency-to-voltage conversion function for different signal-to-noise ratios of the rf beat note signal in Sect. 3. In order to assess the detector performance as part of a frequency stabilization servo loop we estimate the detector bandwidth for frequency modulations in Sect. 4. Section 5 is devoted to the investigation of the minimum achievable beat note linewidth as determined by the detector noise. In Sect. 6 we analyze how rf power fluctuations affect the locking point, i.e., we quantify power-to-frequency cross-talk. Finally, to demonstrate the detector performance under realistic conditions, we use the frequency detector to lock a diode laser to a Ti:sapphire-based fs-frequency comb. This is discussed in Sect. 7. 2
Setup
A schematic drawing of the setup is shown in Fig. 1. The setup is based on the Analog Devices AD8302 RF/IF gain and phase detector. This chip provides a relative phase measurement between two rf input signals with a linearized phase-to-voltage conversion and is based on
a multiplier-type phase detector, which constitutes an advantage over digital phase detectors for optical PLL applications in noisy environments. Additionally, it performs a relative rf power measurement between the two rf signals with logarithmic sensitivity (30 mV/dB). This chip supports operation at rf frequencies of up to 2.7 GHz and a phase and power modulation detection bandwidth of up to 30 MHz. The rf beat note signal from two lasers is delivered to the input RF IN of the setup (Fig. 1) and is then power-split at the first directional coupler. One output port of the directional coupler serves as an input to the phase detector unit, which compares the phase of the rf signal to the phase of an rf reference signal delivered to REF IN. In this paper the phase detector unit is used to estimate the frequency modulation detection bandwidth of the frequency-to-voltage converter. The second output port of the directional coupler serves as an input to the frequency detector unit. The corresponding signal is powersplit at the second directional coupler to provide two rf signals with fixed rf power ratio. The two outputs of this coupler are then connected to the two inputs of the AD8302, which measures the relative rf power between the latter. One of the two inputs contains a steep rf low-pass filter (Mini-Circuits SCLF-series), so that this setup actually performs an rf power independent measurement of the filter’s transfer function. Because the filter’s transfer function is known, this measurement can in turn be considered an absolute frequency measurement, i.e., to provide frequency-to-voltage conversion of the rf beat note signal. The setup also contains buffers and attenuators for rf input signal and output signal conditioning. 3
Static response
The frequency detector working point is coarsely chosen by selection the low-pass filter corner frequency. The detector’s static response for two different filters (MiniCircuits SCLF-30 with f −3dB = 35 MHz, SCLF-225 with f −3dB = 250 MHz) is shown in Fig. 2. The SCLF-30 provides linear frequency-to-voltage conversion between 50 MHz and 67 MHz with a slope of 13 MHz/V. The locking point can be set to anywhere in this range. Below that range and up to about 400 MHz the detector provides at least the correct sign information (frequency too low or frequency too high), so that it can process frequency excursions of up to −45 MHz
FIGURE 1 Schematic setup. (DC) directional coupler, (A) attenuator, (F) filter, all are MiniCircuits components. (B) is a buffer. The Analog Devices AD 8302 chip is used for a relative rf power measurement and is part of the frequencyto-voltage converter that performs an absolute frequency measurement of an rf signal delivered to RF IN. The same chip is also used in the phase detector unit to support a multiplier-type phase measurement relative to an rf reference signal which is delivered to REF IN. Standard analog circuitry is used to interface the AD 8302 with the outside (SC)
STRAUSS et al.
A simple scheme for precise relative frequency stabilization of lasers
FIGURE 2 Static response of frequency detector for two different filters. Figure shows output voltage vs. signal frequency at RF IN for Mini-Circuits SCLF-30 ( f −3dB = 35 MHz; (A, B)) and SCLF-225 ( f −3dB = 250 MHz; (C, D)). The rf signal is generated by an Agilent E4281A signal generator. The rf power is −2.4 dBm for (A, C), and +15.4 dBm for (B, D)
and +350 MHz from a potential locking point at 55 MHz. A different filter, the SCLF-225, provides a linear response between 260 MHz and 390 MHz with a slope of 128 MHz/V. Correct sign information is guaranteed from below 20 MHz up to 1 GHz for a locking point frequency of 320 MHz or less [9]. Note that in the linear range the detector output does not vary notably if the rf power level is changed even by as much as 17.8 dB. In Fig. 2 an Agilent E4281A signal generator was used to mimic the rf beat note signal. Thus the figure describes the situation of an rf signal with an excellent signal-to-noise ratio (SNR). Large SNRs can be ensured even in a noisy environment, if tracking oscillators are used for active signal pre-filtering. However, a tracking oscillator constitutes an additional degree of complexity in a servo loop. We would, therefore, like to use the frequency detector also in those situations which only provide modest rf SNRs. Consequently, we have analyzed how rf noise affects the performance of the frequency detector, taking the SCLF-30 configuration as an example. In order to synthesize rf signals with an adjustable, well-defined rf SNR we mix (MiniCircuits ZLW-3) white noise generated by an Agilent 33220A AWG with the rf signal from the Agilent E4281A rf signal generator. Typical rf spectra are shown in Fig. 6. They are given for a spectrum analyzer resolution bandwidth (RBW) of 300 kHz. However, the AD8302 measures the total, spectrally integrated rf power. Therefore, rather the integrated SNR is relevant here, that is the signal-power divided by the noise power which is integrated over the noise bandwidth (35 MHz to 85 MHz). We have checked that rf noise above 85 MHz (up to 1 GHz) and below 35 MHz does not contribute significantly to the integrated noise power. For different rf SNRs, we now repeat the measurement underlying Fig. 2. The result is shown in Fig. 3. Graph A shows the detector response in case the rf signal is directly delivered to the detector input from the rf signal generator. This corresponds to a situation, where a beat note between two sufficiently powerful lasers is taken or a noisy beat note is filtered by means of a tracking oscillator. In order to reduce the effect of noise from outside the signal window, we
23
FIGURE 3 Static response of the frequency detector for various rf SNRs. SNRs are each given for the noise power integrated between 35 MHz and 85 MHz and, in parenthesis, for 300 kHz spectrum analyzer RBW. In (A, B) the Agilent E4281A directly drives the detector input. In (B) the detector input is band-pass filtered (Mini-Circuits SBP-60). For all other graphs, white noise is added to the rf signal, which is then band-pass filtered. (C) 20.9 dB (47.6 dB); (D) 13.1 dB (31.2 dB); (E) 7.2 dB (25.8 dB); (F) 1.5 dB (20.2 dB); (G) −5.4 dB (13.2 dB). Signal power is 7.6 dBm
insert a band-pass filter (Mini-Circuits SBP-60) at the input of the frequency detector. The finite bandwidth of that filter modifies the static response of the detector by adding dips at 45 MHz and 80 MHz, see B. We now add noise to the rf signal and find graphs C through G. With decreasing rf SNR the high-frequency side of the linear detector range is modified; rf noise tends to shift the working point to higher frequencies. A working point at the low-frequency side, say at 52 MHz, is unaffected by rf noise even if the integrated SNR drops down to 7.2 dB (25.8 dB at 300 kHz RBW). At very poor rf SNRs, e.g., at −5.4 dB integrated SNR (13.2 dB at 300 kHz RBW), the detector characteristic is modified qualitatively, but still provides a monotonic behavior in a 20 MHz wide window. Hence, even for very poor rf SNR the detector provides unambiguous frequency-to-voltage conversion, although the responsivity is strongly reduced and the locking point now depends on the actual rf SNR. Under these conditions the frequency detector will provide locking only with few-MHz stability and accuracy. We conclude that the frequency detector can be operated properly if the rf SNR is comparable to what is typically required for optical phase-locked loops (PLLs). 4
Dynamic response
High-quality frequency or phase stabilization of lasers requires large servo bandwidth. Especially for diode lasers this can be a severe requirement, because typically a servo bandwidth in the range of 100 kHz to 1 MHz or more is required. It is, therefore, essential to provide agile frequencyto-voltage converters which do not only provide a flat amplitude but also a flat phase response. Due to the unavailability of an rf frequency modulator with appropriate and well-known modulation transfer function we decided to characterize the dynamic response of the phase-detector rather than that of the frequency-detector. Phase and frequency detector units are very similar, the only substantial difference being the steep low-pass filter (SCLF-30) included in the frequency detector
24
Applied Physics B – Lasers and Optics
unit. In terms of all other components, i.e., buffers, couplers, attenuators, and analog signal conditioning at the detector outputs both units use the same devices. The main difference between the two units with respect to their dynamic response is therefore determined by the low-pass filter. The Mini-Circuits SCLF-30 low-pass filter introduces an rf frequency dependent group delay that corresponds to τG = 15 ns at 50 MHz, which is close to our typical working point. This group delay increases as the rf frequency decreases and is maximum at 42 MHz (58 ns). We can, therefore, estimate the frequencydetector phase response by adding the phase shift 2π fτG corresponding to the filter’s group delay to the phase response of the phase-detector. We characterize the phase detector’s dynamic response in the following way. A Hewlett Packard HP8657B signal generator delivers a 56.5 MHz reference signal to the REF IN input of the phase detector unit, while the Agilent E8241A signal generator generates a signal at frequency 56.5 MHz + f for the RF IN input of the frequency detector unit. The phase detector output then provides a saw-tooth like signal with the fundamental frequency given by the frequency difference f of the two rf signals. This signal is recorded with a digital oscilloscope (Tektronix TDS1012). Because we know the frequency difference between the two rf signals, we can easily calculate the amplitude and the phase of the Fourier component which corresponds to the rf frequency difference f . Note that the phase is measured with respect to the trigger point of the oscilloscope and hence does not have a physical meaning by itself. We now need to compare the output of the phase detector unit to the output of an ideal phase detector. Therefore, we split-off a fraction of each of the rf signals provided by the two signal generators and connect them to the RF and LO inputs of a Mini-Circuits ZLW-6 double-balanced mixer. This mixer provides an IF-signal frequency range of dc to 100 MHz and serves as a realization of an “ideal” phase detector. The IF-output of the mixer is delivered to the digital oscilloscope and is recorded simultaneously with the output from the phase detector unit. The same Fourier analysis is applied to the mixer output signal as was applied the output of the phase detector unit. By varying the frequency difference f , we can record the relative amplitude as well as the relative phase between the two detector outputs. The relative amplitude transfer function is shown in Fig. 4. It has been normalized to 0 dB at dc. The graph clearly shows that phase modulation can be detected with a bandwidth of about 10 MHz. This has to be compared to the maximum modulation detection bandwidth specified for the AD8302 gain and phase detector, which is 30 MHz. The measurement shown here corresponds to a determination of the large signal response. Hence we expect that the small signal bandwidth actually exceeds 10 MHz. As explained above, we assign the same amplitude bandwidth to the frequency detector unit. The relative phase shift between the output signal of the phase detector unit and the mixer output is shown in Fig. 5 as graph A. It describes the phase transfer function of the phase detector unit. In order to estimate the corresponding transfer function of the frequency detector unit, we follow the strategy described above and add the phase shift corresponding to the SCLF-30 low-pass filter group delay. For a working rf frequency of 50 MHz, the group delay is 15 ns. The corres-
FIGURE 4 Dynamic response of the frequency detector. Graph shows the amplitude of the phase-detector output relative to the output of a mixer (broadband phase detector) for a quasi-phase modulated rf signal. The relative amplitude was normalized to 0 dB at dc. The amplitude of the frequency detector output is estimated to show the same characteristic
FIGURE 5 Dynamic response of the frequency detector. Graph A shows the phase shift of the phase-detector output relative to the output of a mixer (= broadband phase detector) for a quasi-phase modulated rf signal. To estimate the phase shift of the frequency-detector the additional phase shift due to the SBP-60 low-pass filter (group delay: 15 ns at 50 MHz) is added in graph B. Graph C gives worst-case phase shift (group delay: 58 ns at 42 MHz) which applies if the working point is 42 MHz
Rf spectrum (RBW = 300 kHz) with well-defined rf signalto-noise ratio. A Mini-Circuits SBP-60 band-pass is used to filter the rf signal at the frequency detector input. Rf spectra are shown for different SNRs. (A) SNR = 41.7 dB (61 dB), where 41.7 dB corresponds to the signalto-integrated-noise ratio and 61 dB is measured at an RBW of 300 kHz. (B) 24.3 dB (43 dB); (C) 14.6 dB (34 dB); (D) 8.4 dB (27 dB); (E) 3.3 dB (21 dB); signal power is 7.6 dB m, signal frequency is 51.5 MHz
FIGURE 6
STRAUSS et al.
A simple scheme for precise relative frequency stabilization of lasers
25
ponding total phase shift assigned to the frequency detector is shown as graph B of Fig. 5. For rf frequencies beyond 50 MHz the phase shift due to the group delay decreases. The worst case corresponds to a working frequency of 42 MHz, where the group delay is largest (58 ns). Graph C of Fig. 5 describes this situation. The phase lag analysis clearly indicates that phase lag is limiting the dynamic response of the frequency detector. For an rf working frequency beyond 50 MHz, we expect the frequency detector to provide a phase lag of less than 45 deg for modulation frequencies of up to 4 MHz. For the worst case situation, a phase lag of 45 deg is already achieved at a Fourier frequency of 1.5 MHz. At least for working frequencies above 50 MHz the frequency detector should be able to support a servo loop bandwidth of up to 1 MHz. 5
Detector noise
An assessment of the frequency detector’s performance also includes the characterization of the apparent frequency noise, which is equivalent to the electronic noise at the detector input (equivalent frequency noise in short). For a given servo application a specific servo bandwidth is required. The equivalent frequency noise integrated over that servo bandwidth then determines the smallest relative line width between two lasers which can be achieved in a frequency-locking setup that is based on the frequency detector unit. In order to determine the equivalent frequency noise of the frequency detector we use the Agilent E8241A signal generator to deliver a fixed-frequency rf signal at +7.6 dBm to the input RF IN and record the noise at the output ∆ f , see Fig. 1. As in Sect. 3. we characterize the detector for different SNRs of the rf signal. We have already described how an rf signal with a well-defined SNR is realized by appropriately mixing white noise from an AWG with the rf signal from an rf signal generator. Again, as in a typical application, we use a band-pass filter (Mini-Circuits SBP-60) at the detector input to reject rf noise from outside the detection window (50 MHz to 75 MHz). The detector equivalent frequency noise is now characterized for six different rf SNRs. Five of the corresponding rf spectra are shown in Fig. 6. The sixth is not shown and corresponds to directly driving the frequency detector by the rf signal generator without adding noise. As explained in Sect. 3, the integrated SNR (noise power integrated over noise bandwidth) matters here rather than the SNR at some spectrum analyzer RBW. However, for convenience we also give the SNR for an RBW of 300 kHz in parenthesis in Fig. 6. The result of the noise characterization is shown in Fig. 7, which gives the square-root of the frequency noise power spectral density (PSD) vs. Fourier frequency. Graphs A through C indicate that rf noise affects the detector noise spectrum mainly at large Fourier frequencies. If, e.g., for a servo loop application, a detection bandwidth of 100 kHz or less is required, detector noise is basically unaffected by the rf noise as long as the integrated rf SNR exceeds 14.6 dB (34 dB at 300 kHz RBW). For an rf SNR of less then 14.6 dB rf noise increases the equivalent detector noise also at small Fourier frequencies. We next integrate the frequency noise PSD between 10 Hz and some upper frequency f . This determines the minimum RMS-linewidth achievable in a servo loop ap-
FIGURE 7 Detector noise equivalent frequency noise. Noise spectrum is shown for six different rf SNRs. Rf-signal power and frequency are 7.6 dBm and 51.5 MHz, respectively. O shows noise spectrum if frequency detector is directly driven by the rf signal generator. For graphs A through E rf noise is added. The rf spectra corresponding to graphs A through E together with the corresponding SNRs are shown in Fig. 6, where the same labelling is used
plication with servo bandwidth f . The result is shown in Fig. 8. We find that for a servo loop application with modest bandwidth (10 kHz) the frequency detector can provide a RMS-linewidth of 1 kHz or less, and that for high-speed applications with a servo bandwidth of 1 MHz a detectornoise limited RMS-linewidth of less than 10 kHz can be achieved. This applies to a situation with excellent rf SNR. As long as the integrated rf SNR does not drop below 14.6 dB (34 dB at 300 kHz RBW) rf noise does merely affect the RMS-linewidth for a servo bandwidth of less than 100 kHz, which is fast enough for most frequency-locking applications. As the rf noise is increased such that the integrated SNR drops below 14.6 dB, detector noise is significantly increased. However, even for the smallest rf SNR considered here (3.3 dB integrated SNR corresponding to 21 dB at 300 kHz RBW) the detector noise limited RMS-linewidth is kept below 100 kHz for applications which only require modest servo bandwidth.
FIGURE 8 Minimum RMS-linewidth as determined by detector noise for a servo loop application with servo bandwidth f . Graphs O and A through E show the noise spectra of the corresponding graphs in Fig. 7 after integration over 10 Hz to f . Rf signal power and frequency are 7.6 dBm and 51.5 MHz, respectively
26
Applied Physics B – Lasers and Optics
FIGURE 9 Minimum RMS-linewidth as determined by detector noise for a servo loop application with servo bandwidth f . Graphs O and A through D show noise spectra similar to those of Fig. 7 after integration over 10 Hz to f . Graph O corresponds to situation where no noise was added to the rf signal. The integrated rf SNRs (rf SNRs for 300 kHz) are, respectively: (A) 27.4 dB (46 dB), (B) 25.2 dB (44 dB), (C) 15.6 dB (35 dB), (D) 9.2 dB (29 dB). rf signal power and frequency are 7.6 dBm and 56.5 MHz, respectively
We have repeated the measurements discussed above for an rf working frequency of 56.5 MHz. For this frequency rf noise has a stronger impact on detector noise. This is due to the fact that less of the rf signal power is transmitted through the steep low-pass filter so that the integrated rf noise is relatively stronger. The result of this analysis is shown in Fig. 9. Now the integrated rf SNR should not drop below 25.2 dB (44 dB at 300 kHz RBW) if rf noise is not to affect the detector noise. This means that 10 dB more rf SNR is required for the 56.5 MHz working frequency. However, for sufficiently good SNR the detector can provide the same ultimate RMSlinewidth for 56.5 MHz as for 51.5 MHz working frequency. 6
Rf power variation cross-talk
Any dependence of the frequency detector output on the power level of the rf input signal can cause a systematic error or can increase the equivalent frequency noise by cross-coupling power noise present on the rf signal. A characterization of the frequency detector performance therefore has to include an analysis of cross-talk effects form a potential rf power variation. Figure 3 has already indicated that especially in the case of small rf SNR a relative increase of rf noise shifts the detector locking point. Hence, we expect that equivalently a variation of the rf signal power causes a shift of the detector locking point, and that this shift is larger for smaller rf SNR. We, therefore, decided to analyze the rf power variation cross-talk for different rf SNRs. As in the preceding sections, we generate an rf signal with well-defined rf SNR, and deliver it to the input RF IN of the frequency detector unit. As before we use a band-pass filter SBP-60 at the detector input to reject rf noise from outside the signal window. We choose the rf frequency such that for an rf signal power of 7.6 dBm the detector output ∆ f is close to 0 V. This defines the hypothetical locking point of the detector. We then vary the rf signal power by about 12 dB (±6 dB around the nominal power level of 7.6 dBm) and record the detector output voltage shift. The output voltage shift is then converted into an equivalent frequency shift. The result of this analysis is
FIGURE 10 Rf power variation cross-talk. Graph shows equivalent detector output frequency shift as a function of the rf signal power. Shift is given relative to the detector output at a nominal rf power level of 7.6 dBm. For graph A the detector input was directly driven by the rf signal generator with no rf noise added. Graphs B and C show detector output shifts for an integrated rf SNR of 25.3 dB (42 dB at 300 kHz RBW) and of 12.6 dB (31.3 dB), respectively. During the rf power level sweep the rf SNR unavoidably varies by ±4.5 dB and ±1 dB for graphs B and C, respectively. For graph A, B, and C the rf frequencies are 58.5 MHz, 57 MHz, and 56 MHz, respectively
shown in Fig. 10. For sufficiently good rf SNR the equivalent frequency shift is less than 30 kHz peak-to-peak within an rf power variation of ±6 dB, and the sensitivity typically corresponds to about 5 kHz/dB. However, if the integrated rf SNR drops below 25.3 dB (42 dB at 300 kHz RBW) the detector is more strongly affected by rf signal power variations. For an integrated rf SNR of 12.6 dB (31.3 dB at 300 kHz) the detector output shifts by about 150 kHz peak-to-peak within an rf power variation of ±6 dB, and the sensitivity corresponds to typically 20 kHz/dB. In a typical beat note measurement between two lasers the rf signal power can easily drift by a few dB, which corresponds to frequency detector drift of ±10 kHz or more. Hence, if kHz-stability is required it is necessary to use a tracking oscillator not only to increase the rf SNR but also to stabilize the rf signal power. 7
Diode laser stabilization
To demonstrate the ultimate performance of this locking scheme, we lock a diode laser to a fs-frequency comb and record the corresponding beat note. The diode laser is a grating enhanced external cavity diode laser [10] emitting at 1394 nm. Its specific design guarantees good passive short term stability and small drift. The frequency-comb is based on a Ti:sapphire fs-oscillator. It is self-referenced, and the repetition rate as well as the carrier envelope offset frequency are phase-locked to a hydrogen maser. The typical beat note signal between the diode laser and the frequency comb has a SNR of 15 dB to 25 dB for a spectrum analyzer resolution bandwidth of 300 kHz. The diode laser frequency is controlled only through a slow PZT. The corresponding servo bandwidth is estimated to be about 1 kHz (less than 5 kHz). Despite the small SNR we have been able to frequencylock the diode laser to the comb by using the rf beat note signal as the input signal to the frequency detector. However, as explained in this paper, stability, noise, and reliability of the
STRAUSS et al.
A simple scheme for precise relative frequency stabilization of lasers
27
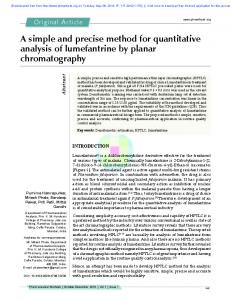
at τ = 700 s, which is in agreement with the result for the time series measurement. These measurements demonstrate that the locking scheme, in conjunction with a tracking oscillator, provides sub-kHz relative stability at time scales as short as 1 s. Up to now this performance could only be provided by optical PLLs or by ultra-stable transfer cavities which are based on well-isolated, high-Q optical resonators. The results clearly show that this locking scheme is very well-suited for high-precision, high-resolution spectroscopy aiming at kHz accuracy and precision. 8 FIGURE 11 Beat note between a diode laser and a fs-frequency comb. The diode laser is frequency-locked to the comb. We use a tracking oscillator to increase the rf SNR. The tracking oscillator frequency is counted with a dead-time free counter (Menlo Systems) at a gate time of 1 s. The linear drift during a time of 2.8 h corresponds to 314 Hz
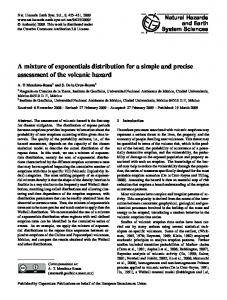
locking scheme suffer from poor SNR. Therefore we decided to use a tracking oscillator (servo bandwidth ∼ 300 kHz) to increase the rf SNR. It is phase-locked to the rf beat note, and its output signal is then used as an input signal to the frequency detector. We count the tracking oscillator rf signal at a gate time of 1 s to record a time series of instantaneous frequencies. The short-term line width of the beat note signal as recorded with a spectrum analyzer is 200 kHz to 300 kHz and is determined by the short-term stability of the frequency comb. The result of the measurement is shown in Fig. 11. Ignoring a few outliers we find a maximum modulation of about 1 kHz peak-to-peak during a 2.8 h (104 s) measurement. The linear drift during that time corresponds to 314 Hz or 1.87 Hz/min, respectively. Modulation at a time scale of ∼ 1000 s dominates the frequency variations. It corresponds to a modulation of the low-pass filter corner frequency of about 1 part in 30 000 and is attributed to changes of the ambient temperature. These findings are reflected in Fig. 12, which shows the Allan deviation corresponding to the time series of frequencies shown in Fig. 11. The Allan deviation is basically flat for τ = 1 s to 2000 s at a level of ∼ 90 Hz. A weakly pronounced maximum of 200 Hz occurs
FIGURE 12 Relative stability between frequency comb and diode laser. Graph shows Allan deviation for the time series of frequencies shown in Fig. 11
Conclusion
We have demonstrated a simple locking scheme which provides an accuracy and precision that is sufficient for most applications in high-precision, high-resolution spectroscopy. It is based on the application of the known amplitude transfer function of a steep low-pass filter. The sub-kHz accuracy presented here sofar could only be provided by optical PLLs or ultra-stable transfer cavities. While PLLs pose more stringent requirements on residual loop error and minimum servo bandwidth than the frequency detector discussed here, transfer cavities do not allow large continuous frequency tuning ranges and, depending on the requested accuracy, require more serious experimental efforts, e.g., high quality mirrors and potentially an intra-vacuum suspension of the cavity. The locking scheme presented here has recently proven its performance in a high-precision spectroscopy experiment on sympathetically cooled HD+ molecular ions [11]. In this paper we have analyzed in detail the performance and limitations of this locking scheme. We have shown that it provides relative frequency stability between two lasers at a tuneable difference frequency of 10 MHz to 1 GHz. In contrast to some alternative locking schemes it guaranties a single locking point. We have analyzed how a reduction of the rf signal SNR affects the performance. It has been found that for a SNR in excess of 45 dB measured at 300 kHz RBW the rf noise typically does not affect the locking point or detector noise significantly. For excellent SNRs (beyond 60 dB) the detector’s equivalent frequency noise √ corresponds to ∼ 10 Hz/ Hz between 10 Hz and 10 MHz. Hence, in a typical frequency stabilization loop, it can provide a noise limited beat note line width of 1 kHz or less. Rf power variations cause a drift of 5 kHz/dB. For smaller SNR (down to 20 dB) the locking scheme still supports frequency-locking, but only at the price of significantly larger detector noise and power-to-frequency cross-talk. However, sub-MHz accuracy and line width are still achievable even under these adverse conditions. We further found that the locking scheme also supports fast servo loops: for a 1 MHz frequency modulation the large signal detector phase lag corresponds to 10 deg. The amplitude bandwidth (−3 dB) exceeds 10 MHz so that this detector may also be used for frequency noise measurements up to 10 MHz. Finally, after including a tracking oscillator in the servo loop to increase the rf SNR and reduce rf power noise, we have locked a diode laser to a fs-frequency comb. Over a time of 2.8 h, we find a linear relative drift of 314 Hz. The corresponding Allan plot shows a deviation of 90 Hz for integration times
28
Applied Physics B – Lasers and Optics
up to 80 s and less than 200 Hz for integration times up to 1000 s. ACKNOWLEDGEMENTS
This work was supported by the
Deutsche Forschungsgemeinschaft.
REFERENCES 1 see, for example, M. Fleischhauer, A. Imamoglu, J.P. Marangos, Rev. Mod. Phys. 77, 633 (2005) and references therein 2 A.M. Akulshin, S. Barreiro, A. Lezama, Phys. Rev. A 57, 2996 (1998) 3 L. Spani Molella, R.-H. Rinkleff, K. Danzmann, Phys. Rev. A 72, 041 802(R) (2005)
4 P. Bouhlouli-Zanjani, K. Afrousheh, J.D.D. Martin, Rev. Sci. Instrum. 77, 093 105 (2006) and references therein 5 M. Prevedelli, T. Freegarde, T.W. Hänsch, Appl. Phys. B 60, S241 (1995) 6 U. Schünemann, H. Engler, R. Grimm, M. Weidemüller, M. Zielonkowski, Rev. Sci. Instrum. 70, 242 (1999) 7 G. Ritt, G. Cennini, C. Geckeler, M. Weitz, Appl. Phys. B 79, 363 (2004) 8 T. Stace, A.N. Luiten, R.P. Kovacich, Meas. Sci. Technol. 9, 1635 (1998) 9 P. Huke, Diploma thesis, Universität Hannover (2004) 10 A. Wicht, M. Rudolf, P. Huke, R.H. Rinkleff, K. Danzmann, Appl. Phys. B 78, 137 (2004) 11 J.C.J. Koelemeij, B. Roth, A. Wicht, I. Ernsting, S. Schiller, Phys. Rev. Lett. 98, 173 002 (2007)