Feb 13, 2015 - [14] Robert M. Haralick and Linda G. Shapiro, Computer and Robot Vision, vol. 2, pp. 316â317, Addison-Wesley,. 1992. [15] J. P. Lewis, âFast ...
A simple user interface system for recovering patterns repeating in time and frequency in mixtures of sounds Zafar Rafii, Antoine Liutkus, Bryan Pardo
To cite this version: Zafar Rafii, Antoine Liutkus, Bryan Pardo. A simple user interface system for recovering patterns repeating in time and frequency in mixtures of sounds. IEEE International Conference on Acoustics, Speech and Signal Processing (ICASSP), Apr 2015, Brisbane, France. 2015.
HAL Id: hal-01116689 https://hal.inria.fr/hal-01116689 Submitted on 13 Feb 2015
HAL is a multi-disciplinary open access archive for the deposit and dissemination of scientific research documents, whether they are published or not. The documents may come from teaching and research institutions in France or abroad, or from public or private research centers.
L’archive ouverte pluridisciplinaire HAL, est destin´ee au d´epˆot et `a la diffusion de documents scientifiques de niveau recherche, publi´es ou non, ´emanant des ´etablissements d’enseignement et de recherche fran¸cais ou ´etrangers, des laboratoires publics ou priv´es.
A SIMPLE USER INTERFACE SYSTEM FOR RECOVERING PATTERNS REPEATING IN TIME AND FREQUENCY IN MIXTURES OF SOUNDS Zafar Rafii1
Antoine Liutkus2
Bryan Pardo3
1
Gracenote, Media Technology Lab, Emeryville, CA 94608 USA 2 Inria, Villiers-L`es-Nancy, 54600 France 3 Northwestern University, EECS department, Evanston, IL 60202 USA ABSTRACT Repetition is a fundamental element in generating and perceiving structure in audio. Especially in music, structures tend to be composed of patterns that repeat through time (e.g., rhythmic elements in a musical accompaniment), and also frequency (e.g., different notes of the same instrument). The auditory system has the remarkable ability to parse such patterns by identifying repetitions within the audio mixture. On this basis, we propose a simple user interface system for recovering patterns repeating in time and frequency in mixtures of sounds. A user selects a region in the log-frequency spectrogram of an audio recording from which she/he wishes to recover a repeating pattern masked by an undesired element (e.g., a note masked by a cough). The selected region is then cross-correlated with the spectrogram to identify similar regions where the underlying pattern repeats. The identified regions are finally averaged over their repetitions and the repeating pattern is recovered. Index Terms— Constant Q Transform, normalized 2-d cross-correlation, median filter, audio source separation 1. INTRODUCTION Audio editors have come a long way by letting everyday users manipulate their favorite recordings in a number of ways. However, they still lack tools to allow for the separation of sounds, a valuable means that would help for applications such as audio restoration, song remixing, or noise reduction. A few researchers have proposed user interface systems which can allow a user to edit an image of an audio recording (typically, a spectrogram) in order to perform source separation, relying on methods such as a pitch detection algorithm or Non-negative Matrix Factorization (NMF) [1–3]. However, such systems still depend on heavy and intricate manual annotations from the user, which would be tiresome and distract the user from the creative function of such tools. Recently, a number of researchers have demonstrated the importance of repetition for audio structure analysis, and developed simple and efficient methods for audio source separation [4–9]. Their approach is supported by recent find-
ings in cognitive psychology that showed that human listeners also use repetition as a cue to identify and separate a same sound that repeats through different mixtures, even without prior knowledge of the sounds or the mixing process [10]. On this basis, we propose a simple user interface system for recovering patterns repeating in time and frequency in mixtures of sounds. The idea is to leverage repetition to perform source separation, by allowing a user to select a rough region from which she/he wishes to recover a pattern and letting the system figure out what the pattern of interest should be. This leads to a more intuitive system that requires only a minimum input from a user, so she/he can still enjoy manipulating her/his favorite audio recordings. The rest of the article is organized as follows. In Section 2, we present our system. In Section 3, we list few applications. In Section 4, we conclude this article. 2. SYSTEM 2.1. Constant Q Transform The system first transforms an audio recording into a timefrequency representation known as the spectrogram. Instead of the usual Fourier transform, we chose to use the Constant Q Transform (CQT) [11, 12], as the CQT has a logarithmic frequency resolution, mirroring the human auditory system and matching the notes of the Western music scale, so that pitch variations conveniently correspond to frequency translations. We used a recently proposed CQT toolbox1 which features a very welcome inverse transform that gives an efficient reconstruction [13]. We use the default parameters, i.e., a number of 24 frequency bins per octave, a minimum frequency of 27.50 Hz (corresponding to the note A0), and a maximum frequency of half the sampling frequency. 2.2. Normalized 2-D Cross-Correlation Once the CQT is computed, the system presents its corresponding magnitude spectrogram to the user in the form of a simple interface. The user then selects a region from which 1 http://www.cs.tut.fi/sgn/arg/CQT/
she/he wishes to recover a repeating pattern masked by an undesired element (e.g., a note masked by a cough). The system then cross-correlates the selected region with the spectrogram in order to identify similar regions at different times and/or frequencies, where the underlying pattern repeats. We used the normalized 2d cross-correlation to measure similarities between the selected region and the rest of the spectrogram, as it is typically used in image processing to find templates in an image [14, 15]. Equation 1 shows the computation of the normalized 2-d cross-correlation. P (S(i−1+x, j−1+y)−S i,j )(R(x, y)−R) x,y C(i, j) = P P 1 ( (S(i−1+x, j−1+y)−S i,j )2 (R(x, y)−R)2 ) 2
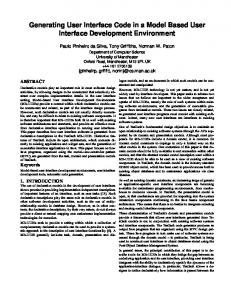
to identify and separate a same sound that repeats through different mixtures, even without prior knowledge of the sounds or the mixing process [10]. The approach has also parallels in image processing with non-local means, an algorithm typically used for image denoising [16]. The system finally adds the phase of the original CQT to the magnitude spectrogram with the final filtered region, and inverts the result back to the time-domain where the undesired element has been removed. Figure 1 shows an overview of the system.
x,y
x,y
• S is the log-spectrogram and S i,j is the mean of S under R • R is the selected region and R is the mean of R • i = 1 . . . n,
n is the number of frequency channels in S
• j = 1 . . . m,
m is the number of time frames in S
• x = 1 . . . h,
h is the frequency height in R
• y = 1 . . . w,
w is the time width in R (1)
The system then identifies in the normalized 2d crosscorrelation, peaks that correspond to time and frequency indices of regions in the spectrogram that are similar to the selected region. We define the following parameters for the peak picking: the maximum number of repetitions (i.e., peaks) and the minimum time and frequency differences between similar regions (i.e., adjacent peaks).
Fig. 1. Overview of the system. (1) An audio recording with an undesired element is transformed into a log-frequency spectrogram. (2) The user selects the region of the undesired element in the spectrogram. (3) The selected region is cross-correlated with the spectrogram to identify similar regions where the underlying pattern repeats. (4) The identified regions are averaged over their repetitions and the repeating pattern is recovered. (5) The filtered spectrogram is inverted back to the time-domain with the undesired element removed.
2.3. Median Filter Once the time and frequency indices of the similar regions are identified, the system computes the median between all the similar regions, for all the time-frequency bins. This helps to recover the repeating pattern by removing outliers, provided that the pattern of interest repeats sufficiently, and that the undesired element does not repeat as much [4–9]. The system then takes the minimum between the resulting filtered region and the original selected region, for all the time-frequency bins. This is to ensure that the former one does not have oddly more energy than the latter one. Equation 2 shows the computation of the final filtered region.
3. APPLICATIONS Instead of a large-scale evaluation, we propose to list realworld applications and provide concrete visual and audio examples, along with performance measures (the reader will find the audio examples online2 ). 3.1. Recovering a Melody Masked by a Cough
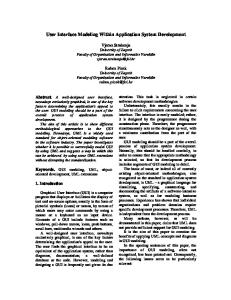
Figure 2 shows the log-spectrogram of a piano melody with a cough masking the first note. A user selected the region of the cough (solid line) and the system identified similar regions where the underlying note repeats (dashed lines). Note that P (x, y) = min{median{S(I(k)−1+x, J(k)−1+y)}, R(x, y)} k=1...p the note not only repeats at different times, but also at different frequencies. We used a maximum number of 5 repetitions • I is the vector of the time indices of the repetitions and minimum time and frequency differences of 1 second and • J is the vector of the frequency indices of the repetitions 1 semitone between similar regions. • k = 1 . . . p, p is the number of repetitions Figure 3 shows the log-spectrogram of the same piano (2) melody with the first note recovered. The system averaged the identified regions over their repetitions and filtered out the The approach has support in cognitive psychology, where 2 http://www.zafarrafii.com/repet.html it was shown that human listeners also use repetition as a cue
cally considered high, which implies good separation performance. The audio files were downloaded from Freesound4 .
recovered note extracted cough
SDR 8.70 5.91
SIR 13.44 6.55
SAR 13.56 11.90
Table 1. Separation performance for the recovered note, and the extracted cough (in dB).
3.2. Recovering an Accompaniment Masked by Vocals Fig. 2. Log-spectrogram of a melody with a cough masking the first note. The user selected the region of the cough (solid line) and the system identified similar regions where the underlying note repeats (dashed lines). cough from the selected region. In practice, the whole process only takes a fraction of a second, as the system involves efficient algorithms (fast CQT [12] and fast normalized 2-d cross-correlation [15]) and simple operations (peak picking and median filtering).
Figure 4 shows the log-spectrogram of a song excerpt with female vocals masking a guitar accompaniment. The user selected the region of the first measure (solid line) and the system identified similar regions where the underlying accompaniment repeats (dashed lines). Note that the accompaniment repeats at periodic times, and stays at the same frequency. Here, we used a maximum number of 7 repetitions.
Fig. 4. Log-spectrogram of a song with vocals masking an accompaniment. The user selected the region of the first measure (solid line) and the system identified similar regions where the underlying accompaniment repeats (dashed lines). Fig. 3. Log-spectrogram of the melody with the first note recovered. The system averaged the identified regions over their repetitions and filtered out the cough from the selected region. Table 1 shows the separation performance for the recovered note, and the extracted cough (in dB). We used the BSS Eval toolbox3 which features the Source-to-Distortion Ratio (SDR) which measures the overall separation performance, with the Source-to-Interference Ratio (SIR) which measures the degree of separation between the sources and the Sourceto-Artifacts Ratio (SAR) which measures the quality of the separation of the estimates [17]. The values shown are typi3 http://bass-db.gforge.inria.fr/bss_eval/
Figure 5 shows the log-spectrogram of the same song excerpt with the first measure of the accompaniment recovered. The system averaged the identified regions over their repetitions and filtered out the vocals from the selected region. Table 2 shows the separation performance for the recovered accompaniment, and the extracted vocals (in dB). The audio files were downloaded from SiSEC5 . 3.3. Extracting a Speech Masking a Noise Figure 6 shows the log-spectrogram of a male speech masking an alarm noise. The user selected the region of the first 4 https://www.freesound.org/ 5 https://sisec.wiki.irisa.fr/tiki-index.php
Fig. 5. Log-spectrogram of the song with the first measure of the accompaniment recovered. The system averaged the identified regions over their repetitions and filtered out the vocals from the selected region.
recovered accompaniment extracted vocals
SDR 9.01 10.77
SIR 10.71 24.95
Fig. 6. Log-spectrogram of a speech masking a noise. The user selected the region of the first sentence (solid line) and the system identified similar regions where the underlying noise repeats (dashed lines).
SAR 14.34 14.32
Table 2. Separation performance for the recovered accompaniment, and the extracted vocals (in dB). sentence (solid line) and the system identified similar regions where the underlying noise repeats (dashed lines). Here, we used a maximum number of 5 repetitions. Figure 7 shows the log-spectrogram of the same male speech with the first sentence extracted. The system averaged the identified regions over their repetitions and extracted the speech from the selected region. Note that, here, we recovered the non-repeating pattern (i.e., the speech) instead of the repeating pattern (i.e., the noise). Table 3 shows the separation performance for the extracted speech, and the filtered noise (in dB). The audio files were downloaded from Freesound. extracted speech filtered noise
SDR 6.01 9.28
SIR 15.64 10.31
SAR 7.83 15.44
Table 3. Separation performance measures for the extracted speech, and the filtered noise (in dB).
4. CONCLUSION We have proposed a simple user interface system for recovering patterns repeating in time and frequency in mixtures of sounds. Applications include recovering a melody masked by a cough, an accompaniment masked by vocals, or even a speech masking a noise.
Fig. 7. Log-spectrogram of the first sentence of the speech extracted. The system averaged the identified regions over their repetitions and extracted the speech from the selected region. There is a number of directions in which we would like to take this work. First, we would like to develop a functional graphical user interface for everyday users to easily and rapidly manipulate their favorite audio recordings. Then, we would like to extend the method for recovering multiple repeating patterns within a same region, by identifying multiple modes between similar regions. Finally, we would like to incorporate the use of other criteria in addition to repetition, as cognitive psychology has shown that listeners use different cues for auditory scene analysis [18], and recent works in audio source separation have demonstrated the advantage of modeling individual sources through their inherent regularities within the mixture [19, 20]. This work was supported in part by National Science Foundation Award 1420971.
5. REFERENCES [1] Jean-Louis Durrieu and Jean-Philippe Thiran, “Musical audio source separation based on user-selected f0 track,” in Latent Variable Analysis and Signal Separation, Fabian Theis, Andrzej Cichocki, Arie Yeredor, and Michael Zibulevsky, Eds., vol. 7191 of Lecture Notes in Computer Science, pp. 438–445. Springer Berlin Heidelberg, 2012. [2] Augustin Lef`evre, Francis Bach, and C´edric F´evotte, “Semi-supervised NMF with time-frequency annotations for single-channel source separation,” in 13th International Society for Music Information Retrieval, Porto, Portugal, October 8-12 2012. [3] Nicholas J. Bryan, Gautham J. Mysore, and Ge Wang, “ISSE: An interactive source separation editor,” in ACM Conference on Human Factors in Computing Systems, Toronto, ON, Canada, April 26-May 1 2014, pp. 257– 266. [4] Zafar Rafii and Bryan Pardo, “REpeating Pattern Extraction Technique (REPET): A simple method for music/voice separation,” IEEE Transactions on Audio, Speech, and Language Processing, vol. 21, no. 1, pp. 71–82, January 2013.
[10] Josh H. McDermott, David Wrobleski, and Andrew J. Oxenham, “Recovering sound sources from embedded repetition,” Proceedings of the Natural Academy Science of the United States of America, vol. 108, no. 3, pp. 1188–1193, January 18 2011. [11] Judith C. Brown, “Calculation of a constant Q spectral transform,” Journal of the Acoustical Society of America, vol. 89, no. 1, pp. 425–434, January 1991. [12] Judith C. Brown and Miller S. Puckette, “An efficient algorithm for the calculation of a constant Q transform,” Journal of the Acoustical Society of America, vol. 92, no. 5, pp. 2698–2701, November 1992. [13] Christian Sch¨orkhuber, Anssi Klapuri, Nicki Holighaus, and Monika D”orfler, “A Matlab toolbox for efficient perfect reconstruction time-frequency transforms with log-frequency resolution,” in AES 53rd International Conference on Semantic Audio, London, UK, January 27-29 2014. [14] Robert M. Haralick and Linda G. Shapiro, Computer and Robot Vision, vol. 2, pp. 316–317, Addison-Wesley, 1992. [15] J. P. Lewis, “Fast template matching,” in Vision Interface, Quebec City, QC, Canada, May 15-19 1995, pp. 120–123.
[5] Antoine Liutkus, Zafar Rafii, Roland Badeau, Bryan Pardo, and Ga¨el Richard, “Adaptive filtering for music/voice separation exploiting the repeating musical structure,” in 37th International Conference on Acoustics, Speech and Signal Processing, Kyoto, Japan, March 25-30 2012.
[16] Antoni Buades, Bartomeu Coll, and Jean-Michel Morel, “A non-local algorithm for image denoising,” in IEEE Computer Society Conference on Computer Vision and Pattern Recognition, San Diego, CA, USA, June 20-25 2005, vol. 2, pp. 60–65.
[6] Zafar Rafii and Bryan Pardo, “Music/voice separation using the similarity matrix,” in 13th International Society for Music Information Retrieval, Porto, Portugal, October 8-12 2012.
[17] Emmanuel Vincent, R´emi Gribonval, and Cedric F´evotte, “Performance measurement in blind audio source separation,” IEEE Transactions on Audio, Speech and Language Processing, vol. 14, no. 4, pp. 1462– 1469, July 2006.
[7] Derry FitzGerald, “Vocal separation using nearest neighbours and median filtering,” in 23nd IET Irish Signals and Systems Conference, Maynooth, Ireland, June 28-29 2012. [8] Zafar Rafii and Bryan Pardo, “Online REPET-SIM for real-time speech enhancement,” in 38th International Conference on Acoustics, Speech and Signal Processing, Vancouver, BC, Canada, May 26-31 2013. [9] Zafar Rafii, Antoine Liutkus, and Bryan Pardo, “REPET for background/foreground separation in audio,” in Blind Source Separation, Ganesh R. Naik and Wenwu Wang, Eds., Signals and Communication Technology, chapter 14, pp. 395–411. Springer Berlin Heidelberg, 2014.
[18] Albert S. Bregman, Auditory Scene Analysis, Press, Cambridge MA, 1990.
MIT
[19] Antoine Liutkus, Derry FitzGerald, Zafar Rafii, Bryan Pardo, and Laurent Daudet, “Kernel additive models for source separation,” IEEE Transactions on Signal Processing, vol. 62, no. 16, pp. 4298–4310, August 2014. [20] Derry FitzGerald, Antoine Liutkus, Zafar Rafii, Bryan Pardo, and Laurent Daudet, “Harmonic/percussive separation using kernel additive modelling,” in 25th IET Irish Signals and Systems Conference, Limerick, Ireland, June 26-27 2014.