A simulation-based optimisation approach to control nitrogen discharge by activated sludge under winter seasonal peak load J-M Choubert1*, Y Racault1, A Grasmick2, J-P Canler3 and A Heduit4
CEMAGREF, Water Quality Research Unit, 50 avenue de Verdun, 33612 CESTAS, FRANCE 2 Process Engineering Laboratory, Université Montpellier II, CC024, Place E. Bataillon, 34095 MONTPELLIER Cedex 05, FRANCE 3 CEMAGREF, Water Quality Research Unit, 3 bis quai chauveau - CP 220, 69336 LYON cedex, FRANCE 4 CEMAGREF, Hydrosystems and Bioprocesses Research Unit, Parc de Tourvoie - BP 44, 92163 ANTONY Cedex, FRANCE 1
Abstract Wastewater treatment systems located in cold areas are under increasing pressure to remove nitrogen from their wastewater. As constraining operating conditions like dramatic influent load increases exacerbated by cold temperatures can occur (e.g. winter tourist resorts, ski resorts), specific technical treatment solutions have to be adapted. The objective of this research is to determine the maximal magnitude of load variation which can be applied in winter to an activated sludge treatment system. It aims at analyzing the effects of high influent load variations on the nitrogen removal capacity. Two operating strategies are investigated by dynamic simulations performed with ASM1: • A fixed aeration tank volume with a fixed MLTSS concentration • A variable aeration volume tank with a variable MLTSS concentration It is demonstrated that the variable aeration tank volume strategy is more efficient than the fixed volume strategy to face longterm peak load. To meet an effluent ammonia nitrate concentration of below 10 mgN·ℓ-1, a maximum input load increase by a factor 2 should be applied with the first strategy; whereas with the second strategy a load increase by a factor 4 should be applied (with constant oxygen presence time). If the oxygen presence time can be increased by 50% the maximum input load increase could reach a factor 6.
Keywords: activated sludge, ASM1, dynamic simulation, nitrification, variable loading rate
Nomenclature COD F/M NH4-N NO3-N
Chemical oxygen demand (mg O2·ℓ-1) Organic carbon loading rate (kgBOD5.kg MLVSS-1·d-1) Output ammonia nitrogen concentration (mg N·ℓ-1) Output nitrates+nitrites nitrogen concentration (mg N·ℓ-1) MLTSS Concentration of sludge suspended solid (mg TSS·ℓ-1) Si Soluble inert COD concentration (mg COD·ℓ-1) SND Soluble biodegradable organic nitrogen concentration (mgN·ℓ-1) SNH Ammonia concentration (mgN·ℓ-1) SRT Sludge retention time or sludge age (day) Ss Rapidly biodegradable COD concentration (mg COD⋅ℓ-1) ta Duration necessary for the autotrophic biomass concentration to reach its initial value (d) th Duration necessary for the heterotrophic biomass concentration to reach its initial value (d) TKN Concentration of total organic nitrogen concentration (mg N·ℓ-1) TSS Concentration of total suspended solid (mg SS·ℓ-1) VSS Concentration of volatile suspended solid (mg VSS·ℓ-1) WWTP Wastewater treatment plant * To whom all correspondence should be addressed. +33 4 72 20 87 87; fax: +33 4 78 47 78 75; e-mail:
[email protected] Received 19 May 2006; accepted in revised form 10 July 2006.
Available on website http://www.wrc.org.za ISSN 0378-4738 = Water SA Vol. 32 No. 4 October 2006 ISSN 1816-7950 = Water SA (on-line)
X B,A X B,H X ND
Concentration of autotrophic biomass (mg COD·ℓ-1) Concentration of heterotrophic biomass (mg COD·ℓ-1) Slowly biodegradable organic nitrogen concentration (mg N·ℓ-1)
Introduction The activated sludge process operated at an F/M ratio of lower than 0.10 kgBOD5·kgMLVSS-1·d-1, with intermittent aeration, is a solution commonly used in France to treat nitrogen from domestic wastewater. It performs biological nitrification and denitrification at low temperature and provides treated water quality in agreement with the European Union Directive 91/271 (1991). This system provides complete nitrification even under rain event conditions where input load increases by a factor 2 (Lagarde, 2003; Stricker et al., 2003). But for higher input load increase, very little information can be found in the literature. Wastewater treatment systems located in tourist resorts are under increasing pressure to remove nitrogen from their wastewater. In winter, the received wastewater volume can represent 70% of the annual effluent volume discharged (Tonkovic and Jeffcoat, 2002) which can lead to long-term deterioration of water quality without treatment. In these areas, high daily inflow variations are observed between the off-season period (few inhabitants, huts and restaurants closed, 8 months a year) and peak-season period (commercial activity and tourists in lodges, 4 months a year). The organic load (both carbon and nitrogen) usually increases by a factor 6 during the last week of December (Christmas days and New Year), to reach a factor 10 within two months during the February school vacations (Canler et al., 2002). To achieve carbon pollution removal, trickling filters at
561
small sewage plants (Schreff et al., 2000), or high-load activated sludge systems with physicochemical primary settlers for larger cities, have been built. For nitrogen removal upgrades with high load variation, submerged biofilters are often proposed (Canler et al., 2002), but this solution can only be utilised in large treatment plants, as it requires skilful operation, and significant operating costs. The ability of activated sludge plants to handle peak loads is poorly documented in the literature, and rather vague design data are available for designers (Schreff et al., 2000). Nevertheless, recent studies suggest that activated sludge systems could be boosted to cope with peak loads. In order to ensure a temperature of approximately 10°C necessary for biological reactions, one of the precautions taken is to cover the activated sludge aeration tanks (building closed with a roof). Different solutions for nitrification capacity enhancement have been reported as follows: external addition of nitrifying biomass (Kos, 1998; Salema et al., 2003), application of effluent enriched with nitrogen (for example alkali) to increase the nitrogen volumetric loading rate (Horan and Azimi, 1992; Canler et al., 2002; FNDAE_25, 2002), manipulation of the aerobic volume to adapt the aeration supply to satisfy the oxygen demand from on-line sensors (Brouwer et al., 1998; Isaacs and Thornberg, 1998; Ekman et al., 2006). Unfortunately, a significant start-up lag-time due to biological activity is required for the two first solutions; the third solution is adapted for an unexpected rapid variation of the loading rate. The activated sludge process is interesting as it requires only reasonable skill and cost to be properly operated. However, common design at peak load causes difficult off-season operating conditions due to low loading rate conditions: high energy demand for endogenous oxygen demand, risk of filamentous bacteria and clarification problems, slow start-up period to reach peak season state. The technical solutions comprising the use of a small aeration tank volume at off-season, and a higher one at peak season, would provide several advantages, such as a buffer for transient hydraulic load increase, improvement in the separation of sludge from water, and energy savings during offseason (8 months a year) by adapting the aeration capacity to the demand. The variation of volume can be increased whereas the daily load applied is increased (off-season to peak-season due to the tourists’ arrival). The objective of this work concerns the evaluation of a dynamic operating strategy with a variable aeration tank volume to remove nitrogen from wastewater under peak load variations (ski resorts). To reach this objective, this solution was compared to the common French conventional operating strategy using a constant aeration tank volume designed at peak load (full-season period). For this purpose, dynamic simulations were performed with the Activated Sludge Model No1, previously calibrated and validated at low temperature (11°C). The effects of high influent load variations on the nitrogen removal capacity are described first and subsequently the maximal magnitude of load increase is determined to identify the best operating strategy which should be tested on a full-scale wastewater treatment plant.
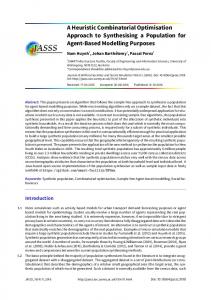
Materials and methods Operating strategies In order to improve nitrogen removal during long-term winter peak loads, two types of operating strategies were evaluated and compared: a conventional one with a constant aeration tank volume, and a dynamic one with a variable tank volume (Fig. 1).
562
Aeration tank Clarifier
Treated water
Wastewater
Recycling loop
Sludge withdrawal
Aeration tank
Clarifier
Treated water
Wastewater
Recycling loop
Sludge withdrawal
Figure 1 Schematic representations of the WWTP [(i) Single aeration tank for the fixed aeration tank volume strategy; (ii) Two aeration tank configurations for the variable aeration tank volume strategy]
•
•
Fixed aeration tank volume strategy One aeration tank designed for F/M ratio of lower than 0.10 kgBOD5·kgMLVSS-1·d-1 (SRT > 15 d). When the organic load starts increasing, the sludge wastage flow is increased so as to maintain a constant MLTSS concentration in the reactor. Consequently, the F/M ratio is increased and the sludge retention time is decreased. Nitrification is maintained due to the increase in the aeration duration. Variable aeration tank volume strategy Two parallel aeration tanks and a clarifier: A small one designed for off-season periods and a bigger one designed for full-season periods. For both, the F/M ratio should be of lower than 0.10 kgBOD5·kgMLVSS-1·d-1 (SRT > 15 d). At off-season periods, the load is applied to the small tank. When the organic load starts increasing (towards full-season period), the load is applied to both parallel aeration tanks. An accumulation period is applied with no sludge withdrawal, in order to hold the produced sludge until the MLTSS concentration has recovered its initial value. When the sludge wastage is re-started, the F/M ratio will have reached its initial value (0.10 kgBOD5·kgMLVSS-1·d-1 with an oxygen presence time of 11 h·d-1).
Both strategies were operated at intermittent aeration to achieve nitrification and denitrification in the same tank. For the clarifier, it was considered that no hydraulic load limitation had occurred (settling velocity < 0.6 m·h-1). For the operating strategies the magnitude and the duration of the alteration of the effluent quality (nitrogen concentrations) were determined. The simulation tool The Activated Sludge Model No 1, ASM1 (Henze et al., 1987), was used to provide the reaction rates in the aeration tank, and
Available on website http://www.wrc.org.za ISSN 0378-4738 = Water SA Vol. 32 No. 4 October 2006 ISSN 1816-7950 = Water SA (on-line)
mg· ℓ 60.8 40.7
-1
ASM1 N-fractionation Xnd (Xnd/TKN) 15.2 (25%) Snd (Snd/TKN) 5.5 (9%) Snh (Snh/TKN) 40.7 (65%)
the output concentrations of the process. For the clarifier, a 10-layer non-reactive 1D-settling model (Takacs et al., 1991) was used. These equations were run on GPS-X® Simulation Software 3.0 produced by Hydromantis, Inc. For the ASM1, the kinetic parameter values used (growth and decay rates, half-saturation or inhibition substrate constants) were the ones previously obtained on an alternating nitrification/denitrification municipal wastewater laboratory treatment plant (150 ℓ) operated at low temperature (11°C) at an F/M ratio in the range 0.05 to 0.15 kgBOD5·kgMLVSS-1·d-1 (Choubert et al., 2005). These conditions are similar to the simulation case studies. Besides, they have provided correct simulation of experimental values, contrary to the ones obtained with the default values proposed by Henze et al.(1987) at 10°C. Input for dynamic simulations To conduct the dynamic simulations, a COD-fractionation of the influent of a ski resort has to be determined. Because the load increase at a large ski resort is mainly caused by the population increase (with no industry), the COD-fractionation data obtained with a test performed on the influent of a conventional municipal WWTP were used. The results were obtained with a 40 d COD degradation method with continuous aeration (Stricker et al., 2003) and was performed once. It comprised the monitoring of the total and the 0.45 µm filtered COD (standardised analysis techniques, triplicates analysis) at time = 0 d, 10 d, 32 d, 36 d, 39 d of biodegradation. The results obtained (Si, Ss, Xi, Xs) are presented in Table 1. Considering the results of off-season load for the initial conditions of simulations the simulations were run over 3 SRTs. In order to draw comprehensive graphs, the results of 40 d were represented: For the initial load applied (off-season period), the results are presented for 5 d (=results obtained by simulations after 3 SRT). On day 5, the load was increased by a factor 1.4, 2, 3, 4 or 6, by modifying the daily inflow rate (full-season load). This altered inflow rate was then maintained (stepfeed increase). The results of simulations are presented for 35 d because no variations occurred after that. The intermittent aeration was applied so that the oxygen concentration was above 3 mgO2·ℓ-1 when it was turned on. When the F/M ratio was changed, the duration of oxygen presence had to be adapted to ensure the total nitrification of the ammonium (Table 2).
Results and discussion For each operating strategy, dynamic simulations were conducted to determine the time variations of the biomass concentrations in the biological aeration tank (autotrophic: X B,A, heterotrophic: X B,H, sludge: MLTSS), and the nitrogen concentrations in the
Available on website http://www.wrc.org.za ISSN 0378-4738 = Water SA Vol. 32 No. 4 October 2006 ISSN 1816-7950 = Water SA (on-line)
20
NO3-N
10
NH4-N 0
Load 10 increase
0
20
30
40
Time (days)
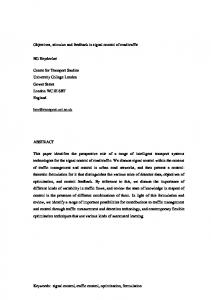
Figure 2a Predicted treated water concentrations with fixed aeration tank strategy (F/M ratio increase from 0.075 to 0.15 kgBOD5 ·kg MLVSS -1 ·d-1) MLTSS
4000
XB,H
XB,A
200
MLTSS 180 3000
XB,H
160
2000
140 120
1000
XB,A
Load increase
0 0
100
Autotrophic biomass (mg COD.l-1)
ASM1 COD-fractionation Xi (Xi/COD) 42 (6%) Xs (Xs/COD) 455 (65%) Si (Ss/COD) 45.5 (6.5%) Ss (Ss/COD) 157.5 (22.5%)
Parameter Total TKN NH4-N
Daily average effluent concentrations (mg N.l-1)
mg· ℓ 700 203
-1
Heterotr. biomass (mg COD.l-1)
Parameter Total COD Soluble COD
[NH4-N]out
[NO3-N]out
Sludge conc. (mg TSS.l-1)
TABLE 1 Concentrations of wastewater used for the simulations
80 10
20
30
40
Time (days)
Figure 2b Predicted aeration tank concentrations with fixed aeration volume strategy (F/M ratio increase from 0.075 to 0.15 kgBOD5 ·kg MLVSS -1 ·d-1)
TABLE 2 Applied oxygen presence time vs. F/M ratio to maintain nitrification F/M ratio kgBOD5.kgMLVSS -1.d-1
0.05 0.075 0.10 0.15 0.20
SRT d
42 24 16 10 7
Applied oxygen presence time hr / d
6.50 9.75 11 16 24
treated effluent vs. time (NH4-N, NO3-N). When an alteration of the nitrogen removal performances was observed, its magnitude and its duration were determined. Operating trends, in particular the maximum magnitude of load increase, were deduced for a given predicted maximum effluent ammonia nitrate concentration of 10 mgN·ℓ-1. Fixed aeration tank volume with an adapted aeration duration A typical response of the system to an increase in the influent load is presented in Fig. 2a and Fig. 2b in the case of a factor 2
563
3
4 factor 5 6 2
7
40
8 factor 9 10 11 12 3 factor 4 30
0.2
20 0.1
NH4-N
-1
10 mgN.� limit (in effluent)
10
0
NO3-N
Load 10 increase
30%
factor 2
factor 3
XB,H increase
0% XB,A decrease
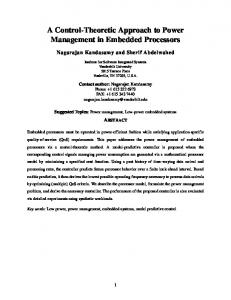
-30% Figure 3b Evolution of predicted biomass concentration for the fixed aeration volume strategy
(F/M increase from 0.075 to 0.15 kgBOD5·kgMLVSS-1·d-1). For this example, the oxygen presence time was increased from 9.75 to 16 h·d-1 (Table 2). At the plant output (treated effluent), the ammonium concentration was maintained at lower than 2 mgN·ℓ-1 (Fig. 2a), but the nitrate concentration increased to 18 mgNO3-N·ℓ-1 within 2 d at this F/M ratio (0.15 kgBOD5·kgMLVSS-1·d-1). The choice of a complete nitrification removal induced a partial denitrification which could lower clarifier settling efficiency because of the endogenous denitrification causing N2 production at this concentration (Henze et al., 1995). In the aeration tank, an increase in the heterotrophic biomass concentration, and a decrease of the autotrophic biomass concentration, are observed. Two weeks (about one SRT) are necessary to reach the new equilibrium values induced by the load increase, and 90% of these final values are reached after 10 d. The heterotrophic concentration increases by 20% which means that the time for auto-oxidation of sludge should have decreased, even if the efficiency of COD removal is the same. As a consequence, the net yield coefficient (produced MLVSS by eliminated COD) should have increased. For this reason, the autotrophic biomass concentration decreases by 20% (Fig. 2b). Six scenarios were simulated: 1 scenario for a factor 1.4, 3 for a factor 2 (for initial F/M ratio = 0.05, 0.075 and 0.10 respectively); 1 scenario for a factor 3, and 1 scenario for a factor 4. The magnitude of load increase (including initial and final value), and the nitrate concentrations simulated are presented in Fig. 3a.
MLTSS
4000
factor 4
Sludge conc. (mg TSS.l-1)
factor 60% 1.4
20
40
30
Time (days)
Figure 4a Predicted treated water concentrations with variable aeration volume strategy (Case D)
Figure 3a Predicted results for the fixed aeration tank volume strategy
Relative evolution (%)
NH4-N
10
0
0
564
20
0
Heterotr. biomass (mg COD.l-1)
F/ M ratio (d-1)
factor 1 2 1.4
[NH4-N]out
[NO3-N]out
XB,H
XB,A
200
MLTSS XB,H
3000
2000
150
100
XB,A
1000
50
0 0
Load 10 increase
Autotrophic biomass (mgCOD?l-1)
0.3
final value initial value
Daily average effluent concentrations (mg N.l-1)
NO3-N increase
N in effluent (mgN.�-1)
F/M ratio increase
0 20 Time (days)
30
40
Figure 4b Predicted aeration tank concentrations with variable aeration volume strategy (Case D)
In all scenarios, the ammonium concentration was maintained at lower than 2 mgN·ℓ-1 due to the increase in oxygen presence time when the loading rate was increased. For an F/M ratio of over 0.15 and 0.20 kgBOD5 ·kgMLVSS-1·d-1, the complete nitrification objective induced predicted nitrate concentrations higher than 18 mg NO3-N·ℓ-1 in the treated effluent. In the aeration tank, the predicted autotrophic biomass concentration, and thus the maximum nitrification rate, decreases by 20% for a loading rate increase of a factor 2, by 30% for a factor 4 (Fig. 3b). About 10 d are necessary to reach 90% of their respective final values (Fig. 2b). For a given concentration of 10 mgN·ℓ-1 for ammonia nitrate in treated effluent at 11°C, the F/M ratio should not be higher than 0.10 kgBOD5·kgMLVSS-1·d-1 (Fig. 3a). The maximum load increase which can be treated with this operating strategy depends on the F/M ratio applied before the load increase (at off-season). For the average F/M ratio generally measured on French biological nutrient removal WWTP (0.07 kgBOD5·kgMLVSS-1·d-1) a maximum load increase by a factor 1.4 should be applied. For an initial F/M of 0.05 kgBOD5·kgMLVSS-1·d-1, an increase by a factor 2 could be accommodated. Variable aeration tank volume with a constant aeration duration A typical response of the system to the biological volume tank increase at constant oxygen presence time is presented on
Available on website http://www.wrc.org.za ISSN 0378-4738 = Water SA Vol. 32 No. 4 October 2006 ISSN 1816-7950 = Water SA (on-line)
ta
th
�XB,A(t0)
�XB,A(th)
XB,H (t) XB,A (t)
Fig. 4a and Fig. 4b for a load increase by a factor 6 (Case D - F/M = 0.10 kgBOD5·kgMLVSS-1·d-1). Contrary to the previous strategy, an NH4-N increase in the effluent is observed (partial alteration of the nitrogen removal). Three successive phases can be observed to describe the dynamic response of the system: • Phase 1: MLTSS and biomass concentrations decrease in the reactor immediately after the load and volume increase; in the effluent, the ammonium concentration dramatically increases and the nitrate concentration decreases (Fig. 4a). An autotrophic bacteria mass lower than the one necessary to nitrify the nitrogen available at peak-season is responsible for the degradation of the effluent quality. It could be counter-balanced by the increase in the oxygen presence duration (i.e. aeration time increase). • Phase 2: As no sludge wastage is performed, the produced sludge is accumulated in the system to reach the initial MLTSS value. The heterotrophic and autotrophic biomass, and the maximum nitrification rate, increase during th= 9 d (Fig. 4b). The ammonium concentration in the treated effluent decreases and the nitrate concentration increases. • Phase 3: As soon as the MLTSS has recovered its initial value (th ≈ 10 d), the sludge wastage is re-started to maintain a constant sludge mass. At this time (th), a lack of autotrophic biomass concentration is observed (-30% for the example shown), as it has not yet reached its initial value. In the effluent, the ammonium (respectively nitrate) concentrations have not reached their equilibrium values. It keeps decreasing (respectively increasing) for ta= 40 d towards its initial values. To analyse the dynamic response of activated sludge at varying load increases, the parameters characterising the magnitude and the duration of Phases 2 and 3 were calculated for each input load increase factors. Figure 5 illustrates the following definitions: • The durations necessary for the autotrophic (ta) and heterotrophic (th) concentrations to reach their initial values • The magnitude of variations of the biological variables [∆X B,A(th)] which is the difference between the autotrophic concentration at t0 and at th [X B,A(th)- X B,A(t0)], and the proportion of the autotrophic biomass absent of the system when the sludge wastage is re-started at th -[= 1 � �XB, A(th) ]. �XB, A(t0)
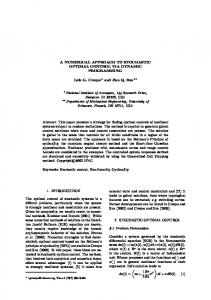
The simulation results obtained for the variable aeration tank strategy are presented in Fig. 6a (magnitude) and Fig. 6b
Available on website http://www.wrc.org.za ISSN 0378-4738 = Water SA Vol. 32 No. 4 October 2006 ISSN 1816-7950 = Water SA (on-line)
Figure 6a Predicted ammonia concentrations in treated effluent with the variable aeration volume strategy for each load increase factor 50 th & ta (days) % missing autotrophic bacteria
Figure 5 Definitions of the characteristics (magnitude and duration) of the dynamic situations
th ta
Lacking autotophic bacteria at tH
40
oxygen presence time increase to16 h/d
oxygen presence time : 11 h/d
30 20 10 0 1
2
Case A
3
Case B
4
Case C
5
6
7
Case D & E
Factor of load increase
Figure 6b Dynamic response characteristics with the variable aeration volume strategy for each load increase factor (simulations)
(duration): the factor 2 corresponds to Case A, factor 3 to Case B, factor 4 to Case C, and factor 6 to Cases D and E. Cases A to D were obtained with a constant oxygen presence duration (11 h·d-1), whereas Case E was obtained with a 50% higher oxygen presence duration (16 h·d-1). An input load increase by a factor 2 (Case A) increased the ammonium concentration to 4 mg NH4-N·ℓ-1 in the effluent during one week. When the sludge wastage was re-started (at th= 9 d), the autotrophic biomass concentration reached its initial value. So the untreated nitrogen flux discharged in the receiving bodies would represent no more than 5% of the total nitrogen flux applied. For an input load increase by a factor 3 or 4 (Cases B and C), the effluent ammonia concentration increased to 7 and 9 mg NH4-N·ℓ-1. Respectively 20 and 30 d were necessary to reach the initial ammonia concentration in the effluent. When the sludge wastage was re-started (after a delay of th = 8 to 9 d), 6 to 8% of the autotrophic biomass was unaccounted for. The untreated nitrogen flux discharged in the receiving bodies would represent 8 and 10% of the total nitrogen flux applied. For a load increase by a factor 6 (Case D), the effluent ammonia concentration increases to 12 mg NH4-N·ℓ-1, and 45 d were necessary to reach the initial ammonia concentration in the treated effluent. 22% of the total nitrogen flux applied was discharged into the receiving body. This discharge was due to a 30% loss in autotrophic biomass once the sludge wastage had been re-started.
565
To cope with a load increase by a factor 6, a two-week 50% increase in the aeration duration was tested by simulation (Case E). It is shown that nitrogen removal performances could be improved significantly: 7 mg NH4-N·ℓ-1 (instead of 12 mg NH4-N·ℓ-1) was the maximum discharged ammonia concentration, and 20 d (instead of 45 d) would be necessary to reach the initial ammonia concentration in the effluent. In this case, the nitrate concentration in the treated effluent should be monitored to prevent the development of clarification problems in the process. For a given concentration of 10 mgN·ℓ-1 for ammonia nitrate in the treated effluent, the simulation results demonstrate that the maximum F/M ratio attainable at 11°C is a factor 4 at constant oxygen presence time, and a factor 6 if a 50% increase of the oxygen presence time is applied. In order to provide a validation of the simulation results obtained for the variable aeration tank volume strategy, a preliminary investigation (2 weeks) was conducted last winter at the WWTP of Les Ménuires ski resort (France, Alpin Moutain), 10.000 PE. The loading rate increase by a factor 4 was tested: To handle this increase the aeration tank volume was increased by a factor 4, and no sludge was withdrawn for 2 weeks. One day after this increase, an ammonia concentration of 9 mg NH4-N·ℓ-1, with 1 mg NO3-N·ℓ-1 (daily average composite sample), was observed (Perret and Canler, 2005). For this load increase (equivalent to Case D), the predicted values are very similar to the observed concentrations. At this time, these observed values are the only available data. A validation at full-scale biological nutrient removal WWTP of the simulation results is needed for other load increase factors.
Conclusions This work reports the evaluation of two operating strategies of activated sludge systems to cope with the increase in the carbon and nitrogen loading rates generally observed on wastewater treatment plants located in winter resorts. Dynamic simulations were performed with ASM1 operated with previously calibrated kinetics parameters. With a fixed aeration tank volume strategy, the F/M ratio applied must not exceed 0.10 kgBOD5·kgMLVSS-1·d-1 to maintain an effluent ammonia nitrate concentration of below 10 mgN·ℓ-1 (with 11 h·d-1 of oxygen presence time). The maximum load variation depends on the initial loading rate. A load increase over a factor 2 should not be applied. With a variable aeration tank volume strategy, it was demonstrated that up to a load increase by a factor of 4, an effluent ammonia nitrate concentration of below 10 mgN·ℓ-1 could be maintained. If the oxygen presence time could be increased by 50%, the maximum input load increase could reach a factor 6. It can be concluded that the second operating strategy (variable aeration tank volume) provides efficient nitrogen removal at higher long-term peak load than the ones provided by the first operating strategy. These conclusions mainly drawn from simulations (preliminary confirmation by only one experiment) should now be validated at full-scale biological nutrient removal WWTP.
566
Acknowledgements The authors would like to thank Anne-Emmanuelle Stricker (Centre Technique des Eaux Usées, Hamilton Canada) and Christian Beck (Ecole Nationale du Génie de l’Eau et de l’Environnement, Strasbourg France) for their advice.
References EUROPEAN DIRECTIVE 91/271/EEC URBAN WASTEWATER TREATMENT (1991) http://europa.eu.int/comm/environment/ water/water-urbanwaste/directiv.html (Accessed on 1st July 2006). BROUWER H, BLOEMEN M, KLAPWIJK B and SPANJERS H (1998) Feed forward control of nitrification by manipulating the aerobic volume in activated sludge plants. Water Sci. Technol. 38 (3) 245-254. CANLER JP, PERRET JM, LENGRAND F and IWEMA A (2002) Nitrification in biofilters under variable load and low temperature. Water Sci. Technol. 47 (11) 129-136. CHOUBERT JM, RACAULT Y, GRASMICK A, BECK C and HEDUIT A (2005) Nitrogen removal from urban wastewater by activated sludge process operated over the conventional carbon loading rate limit at low temperature. Water SA 31 (4) 503-510. EKMAN M, BJÖRLENIUS B and ANDERSSON M (2006) Control of the aeration volume in an activated sludge process using supervisory control strategies. Water Res. 40 (8) 1668-1676. FNDAE_25 (2002) Traitement de l’azote dans les stations d’épuration biologique des petites collectivités. FNDAE edition, Document Technique n°25. 96 pp. http://www.eau.fndae.fr/documentation/ numero_25.htm (Accessed on 1 st July 2006). HENZE M, GRADY CPL, GUJER W, MARAIS GR and MATSUO T (1987) Activated sludge model N°1. IAWQ Scientific and Technical Report. 33 pp. HENZE M, HARREMOËS P, LACOUR JANSEN J and ARVIN E (1995) Wastewater Treatment - Biological and Chemical Processes. Springer, Heidelberg. 383 pp. HORAN NJ and AZIMI AA (1992) The effects of transient nitrogen loadings on nitrifying activated sludges in completely mixed and plug-flow reactors. Water Res. 26 (3) 279-284. ISAACS S and THORNBERG D (1998) Rule based control of a periodic activated sludge process. Water Sci. Technol. 38 (3) 281. KOS P (1998) Short SRT (Solid Retention Time) nitrification process/ flowsheet. Water Sci. Technol. 38 (1) 23-29. LAGARDE F (2003) Optimisation du traitement de l’azote et du carbone par boues activées en temps de pluie à basse température. Créteil (France, 94), Université Paris XII - Val de Marne, Ecole doctorale SIMME, 138. PERRET JM and CANLER JP (2005) Suivi de la station d’épuration des Ménuires (73) - résultats de mesure.Cemagref Lyon QEPP, Technical report. 23 pp. SALEMA S, BERENDSB DH, HEIJNENA JJ and VAN LOOSDRECHT MC (2003) Bio-augmentation by nitrification with return sludge. Water Res. 37 (8) 1794-1804. SCHREFF D, ECHTERBRUCH A and WILDERER PA (2000) A case study on the performance of trickling filter plants in Alpine regions: Influence of seasonal variations. Water Sci. Technol. 41 (1) 155-162. STRICKER AE, LESSARD P, HEDUIT A and CHATELLIER P (2003) Observed and simulated effect of rain events on the behaviour of an activated sludge plant removing nitrogen. J. Environ. Eng. Sci./Rev. Gen. Sci. Env. 2 (6) 429-440. TAKACS I, PATRY GG and NOLASCO D (1991) A dynamic model of the clarification-thickening process. Water Res. 25 (10) 1263-1271. TONKOVIC Z and JEFFCOAT S (2002) Wastewater reclamation for use in snow-making within an alpine resort in Australia - Resource rather than waste. Water Sci. Technol. 46 (6-7) 297-302.
Available on website http://www.wrc.org.za ISSN 0378-4738 = Water SA Vol. 32 No. 4 October 2006 ISSN 1816-7950 = Water SA (on-line)