[Popek85] produced key research necessary to make an optimistically ... What are the major issues in the design of a simulation framework that can answer the preceding ... Modern computing trends increasingly emphasize cooperative data sharing and .... presented in this paper use periodic reconciliation only, with no fast ...
A Simulation Framework for Evaluating Replicated Filing Environments � An-I A. Wang, Peter L. Reiher, and Rajive Bagrodia Department of Computer Science University of California, Los Angeles
Abstract Optimistic replication of data is becoming increasingly popular in distributed systems. However, the performance characteristics of such systems are not well understood. We have developed a flexible and extensible simulation framework to investigate the operating costs and service quality of optimistic replication for file systems. This paper describes the simulator and presents the results of a validated, trace-based performance study using the simulator. The results give us new insights into many aspects of optimistically replicated file systems. First, we demonstrate that existing metrics for the service quality of optimistic replication are fragile, and propose alternative metrics. Second, the operational costs deduced from simulation indicate that high quality of replication service can be economically achieved. Third, we demonstrate that optimistically replicated systems scale well; the service quality is self-regulated by the percentage of active users in a large distributed system. Finally, we evaluate the impact of the data exchange method, data propagation topology, and data synchronization frequency on the operating costs and service quality of optimistically replicated file systems.
1
Introduction
Optimistic data replication is an increasingly important technology in many databases and distributed applications. Optimistic replication has advantages over more conservative replication methods. First, it gives users fast access to fully functional copies of the data. Second, it provides resiliency to network failures and partitionings. Third, it offers portable computer users full data access under frequent disconnection, since each laptop can have a fullfunction replica. Fourth, optimistic replication supports cooperative work among multiple users, since the users can simultaneously access their replicated data locally. Oracle 7, Bayou, Ingres, Lotus Notes, Microsoft Brief Case, and Concurrent Versions System are popular examples of existing applications that use optimistic replication methods [Daniels94, King94, Terry95]. The early research on optimistic replication was largely done in the context of file systems. This research primarily focused on proving the correctness and the practicality of the method. The Locus Operating System [Popek85] produced key research necessary to make an optimistically replicated file system practical, including the concept of version vectors [Parker83]. The first practical optimistically replicated file system that achieved general popularity was Coda [Satyanarayanan89]. This system leveraged limited optimistic replication capabilities in the Andrew File System [Kazar88] to offer not only optimistic replication, but support for disconnected operation. Coda also produced the seminal research on client/server optimistic replication, one of the two major approaches to optimistic replication. Coda’s early results have been validated by years of actual use of the system by large numbers of users. Later systems, like Ficus [Guy90], have offered further evidence of the practicality of optimistic replication. Coda, Ficus, and other projects have demonstrated that concurrent modifications can be correctly resolved without data loss [Kumar95, Reiher94]. They also showed that optimistic replication can be used in real environments by deploying their systems among substantial numbers of real users [Heidemann95, Kistler92, Nobel94]. However, much less is known about important performance characteristics of such systems, such as the effects of scaling, the methods used for exchanging updates, operating costs, and the quality of service provided. We use simulation to explore that wide range of optimistic replication issues. These issues are difficult and expensive to measure experimentally and do not seem likely to be sufficiently tractable for mathematical analysis. The scope of this study encompasses performance issues that are of interest to a variety of groups including end-
This work was sponsored by the Defense Advanced Research Project Agency under contract DATB63-94-C-0080.
The authors can be reached at the Computer Science Department, UCLA, Los Angeles, CA 90095, or by email to {awang, reiher, rajive}@cs.ucla.edu.
users, replicated system designers, and performance analysts. Some of the key questions that we would like to answer about optimistic replication include the following: • • • • •
What are the appropriate metrics to evaluate optimistic replication systems? What are the costs paid for the greater availability and reliability offered by optimistic replication? How does the observed file access pattern affect the performance of an optimistic replication system? What are the costs and impact on the service quality of the data exchange method, data propagation topology, data synchronization interval, and scaling in number of replicas? What are the major issues in the design of a simulation framework that can answer the preceding questions and investigate a wide range of issues in optimistic replication?
The next section is an overview of optimistic replication. Following that, Section 3 discusses the simulation framework design. Section 4 details the experiments we ran with the simulation. Section 5 presents the resulting knowledge gained about optimistic replication systems. Section 6 relates our work to other performance analyses of optimistic simulations, and Section 7 offers our conclusions.
2
Background
2.1
Motivation for Optimistic Replication
Modern computing trends increasingly emphasize cooperative data sharing and mobile computing, which introduces two major challenges: • •
Many users working on different machines need to share the same data. Portable computers are often disconnected or poorly connected, so data access for such machines is limited to their local disk.
Replication is a good technique for providing high availability to users sharing data across machine boundaries, since each user can have his own local copy of the data. Two styles of replication are possible. Conservative replication attempts to provide the same semantics as having a single copy of the data. Unfortunately, if partitions or disconnections are common, preserving these semantics requires limiting access to some or many of the replicas. For banking applications, reservation systems, and mobile file accesses, operation in the face of failures and disconnections is vital. In addition, conservative replication schemes pay a penalty on every update to prevent concurrent updates to data that might not occur or have harmful effects. Such replication schemes typically use tokens, voting, or primary site methods to ensure that no concurrent updates occur. Conservative schemes often pay a heavy penalty merely to determine that there is no concurrency present, and many concurrent updates are not harmful [Guy93]. Consider a calendar application. Two users can schedule meetings concurrently if the meetings are not at the same time. Most updates to directories also cause no concurrency problems, and many other common types of updates can be performed concurrently. The other replication alternative, optimistic replication, does not have these problems. Optimistic replication allows immediate access to any available replica of a data item, thus avoiding problems with partitionings and reducing the costs of performing updates to replicated data. The cost of optimistic replication is that it may permit concurrent update. In many cases, this cost is tolerable, for three reasons. First, most files have a single writer, particularly over a short time period. Thus, allowing writes to any data replica will rarely result in concurrent updates. Second, a large class of applications can work well with slightly out-of-date information. For example, a slightly aged library database system can still deliver meaningful service in most of the cases. Therefore, immediate propagation of new updates to all replicas is often not vital. Third, for many applications, the majority of concurrent data modifications can be performed in parallel. With proper handling, the modifications can be later merged automatically or manually without data loss. Directories are an important example. Independent file creations can be applied to two replicas of a directory without causing problems, because the differing directory replicas can be easily merged into a single directory.
2.2
Optimistic Replication Algorithms
Optimistic replication permits copies of data to become temporarily inconsistent, so the algorithm must be able to bring differing replicas into synchronization. Sometimes the updates can be propagated to other replicas immediately, but the advantage of allowing updates to a fully partitioned replica carries with it the disadvantage of being unable to propagate those updates as they occur. Therefore, the replication system must also be able to propagate them later. Typically, replicas are brought into synchronization by a process called reconciliation, which compares differing replicas at some convenient time (such as when portable computers are temporarily connected to the network) and applies the updates from each to the others. Optimistic replication is resilient to network failures, partitioning, and frequent disconnection, at the cost of requiring reconciliation mechanisms and sometimes permitting improper concurrent accesses. A reconciliation process, in general, involves finding recent updates for the sites involved in the process (typically using either logging [Satyanarayanan89] or scanning [Guy90, Ratner96]), exchanging the updates, and detecting improper concurrent accesses. Improper concurrent accesses occur when multiple users update different replicas of the same file after the last reconciliation process. A well-designed replication system must detect all such conflicts, and never falsely signal a conflict when no improper concurrent access occurred. Typically, optimistic replication systems use application-specific libraries to automatically resolve the majority of inconsistencies resulting from conflicts. Conflicts that are not automatically resolved require user intervention [Kumar95, Popek90, Reiher94]. Consider an example of optimistic replication using a file treated as an append-only log, with each log entry containing a timestamp as part of its record, and with records ordered by timestamps. If two replicas of this log receive independent updates, the optimistic replication system will allow each of them to append a new record to the end of an otherwise identical log. When reconciliation between these replicas occurs, the conflict will be detected and automatically resolved by creating a log consisting of the common parts, followed by the new records in timestamped order. Either the system or users of the log file would provide a resolver program that could examine the conflicting versions of the file and produce the proper merged version. The optimistic replication system would provide tools for accessing the different replicas and indicating when and how the conflict should be resolved.
2.3
Complexities of Optimistic Replication
While optimistic replication overcomes some of the disadvantages of conservative replication, it has its own difficulties. Optimistic replication introduces many unknown factors into system configuration. The service quality of such a system might be sensitive to user access patterns. Optimistic replicated systems might have scaling constraints based on the number of data copies, or replication factor. The degree of data consistency might be affected by data synchronization frequency (interval), data propagation path (topology), and data exchange method (protocol). This paper studies the performance of optimistically replicated file systems using simulation. Understanding the results of the simulation requires some understanding of the character of the factors affecting optimistic replication. As noted earlier, all optimistic system must be able to apply updates to replicas after the update has occurred, sometimes long afterwards. Reconciliation frequency, therefore, is an important factor in replication system performance. The more frequently reconciliation is run, the closer the synchronization of the replicas, but the more overhead is paid for maintaining that synchronization. In most systems, reconciliation is performed periodically to bring a local replica into synchronization with a remote replica [Ratner96, Satyanarayanan89]. Some systems also provide fast update propagation to all replicas available at the time of the update [Guy93]. The results presented in this paper use periodic reconciliation only, with no fast propagation at update time. The simulation could support fast propagation, but none of our results reflect that option. In our simulation, a reconciliation process is periodically initiated for each replica based on a reconciliation interval specified for the replica. If there are more than two replicas, the reconciliation process could be initiated with different choices of partners. Most existing replication systems reconcile two replicas at a time, though multi-way reconciliation strategies are possible. This simulation uses only pair-wise reconciliation. Given this choice, the replica initiating replication can choose any of a number of other replicas as its partner. The initiating replica selects the target replica based on a specified reconciliation topology. Our framework supports flexible specification of reconciliation topology, and the results presented cover several of the more popular topologies used in real systems, including those that force reconciliation only between pre-defined pairs of partners.
Some optimistic replication systems use a client/server model, in which one (or several) of the replicas are servers, while the rest are clients. Client sites may only propagate their updates to servers. (Often, updates can only be propagated from a given client to a particular server.) Servers may propagate their updates more freely. Alternately, all replicas can be peers. In this kind of replication system, any replica can trade updates with any other replica. The peer model is strictly more powerful than the client/server model, conceptually, as any client/server model can be emulated by use of an appropriate reconciliation topology. For example, a system with a single server machine and multiple clients can be emulated by a peer system using a star reconciliation topology, with the server at the center and the clients attached to the server. From an implementation standpoint, there are other important differences between client/server and peer-model replication systems, but a simulation can ignore those differences, encapsulating any that have performance impacts in the general costs of performing reconciliation. This study uses a peer model, but some of the experiments presented here emulate a client/server system. Reconciliation can be a one-way process (one replica receives updates from its partner), or a two-way process (both replicas trade updates). One-way reconciliation shortens the time spent in a single reconciliation, but two-way reconciliation may provide more globally efficient propagation of updates, in terms of both time spent by all parties and the speed with which updates propagate. Our framework supports both one-way and two-way reconciliation. One-way reconciliations can be performed either as a push (one site pushes its updates to the other), or a pull (one site pulls updates from the other). Pulling gives control over the amount of data transfer to the side receiving the updates, while pushing gives control to the side sending them. In many cases, flow control and overall control over the amount of work to be done is better situated in the receiver than in the sender. Our simulation supports both push and pull one-way reconciliation options. Another factor of importance is replication granularity. This factor controls the level at which replication is applied. Possible granularities include the individual file, the directory, or sub-trees of a file hierarchy (typically called a volume). Machines usually determine which data items they will replicate at the granularity offered by the system. Fine granularities offer easy control over what data is stored at each machine, but have high overheads due to meta-data stored for each replicated item. Coarse granularities lower these overheads, but offer less flexibility in controlling the data storage of each machine. The simulation system described here offers many choices for granularity, but the results presented in this paper use the coarsest possible granularity: each machine stores a complete replica of all files. Since reconciliation for large granularities is a heavy-duty process, typical real installations of optimistic replication systems ensure that at most one reconciliation process is in progress at any point at a given machine. This reconciliation locking constraint prevents the reconciliation traffic from overloading the CPU. Our framework enforces this constraint, by default. Practically, this constraint implies that if a site is participating in one reconciliation, the site will deny requests from other sites. All denied reconciliation requests are aborted, and the frequency of service denial is referred as the abortion rate.
3
System Architecture for Simulation Framework
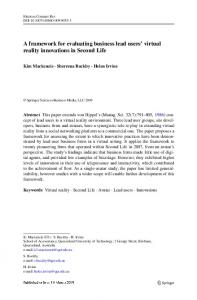
The goal of the simulator is to provide a sufficiently general and powerful framework to support the evaluation of replicated file systems on large-scale heterogeneous distributed systems. The simulator was built using Maisie, a Cbased discrete-event simulation language that supports sequential and parallel simulation [Bagrodia94]. Although the model has been designed for eventual execution on a parallel architecture, this paper does not address any issues that pertain to parallel simulation; rather its focus is on the use of the simulator in evaluating the performance of optimistically replicated file systems. Figure 1 illustrates the top-level view of the simulation framework. Since our simulation needs to accommodate a wide range of model specifications, we designed a hierarchical input language and a dedicated front end to parse the input specifications. To facilitate future parallel execution of the simulation, the centralized modules—front end and simulation driver—are responsible only for initializing servers and their interconnections for network communication; no centralized coordination is required after the simulation is launched. This simulation supports multiple servers, one for each simulated machine.
Configuration Files (Input Language)
Front End (Scanner & Parser)
Simulation Driver
Server File Reference Generator Rumor Reconciliation File System Physical Resources
Figure 1: Simulation Structural Diagram The front end is used to specify the configuration of each server, the server interconnections, and the replication parameters as described subsequently. Each server contains a file reference generator to model the user behavior on that server. The reconciliation model simulates the core algorithms of the replication system being studied. The file system model keeps track of the data modifications, and the physical resource model simulates the delay characteristics of the various hardware components and the network interconnections.
3.1
Simulation Front End
The simulation front end (scanner and parser) is used to set up the experimental scenario and initialize various system parameters such as the network interconnections for servers, the reconciliation topology, and user access patterns for the file reference generator (Figure 7). The front end was implemented in grammar-encoded languages, Lex and Yacc, to provide an extensible and flexible interface to the simulator. The front end provides a number of features to specify a very large, heterogeneous interconnection of servers, including nested file inclusion, lexical scoping, and version numbering. Figure 2 illustrates the use of the specification language in specifying a two-level construction of an Ethernet network that includes two different types of machines; the specified configuration is depicted pictorially in Figure 3. A complete description of the input language is beyond the scope of this paper; we mention a few key features. For example, hierarchical abstraction of components can be used for model construction and extension using libraries. Input file A contains a library of disk modules, and input file B contains a library of CPU modules. Input file C contains a variety of server modules, which consist of various combinations of disk and CPU modules specified in files A and B. Implementing this concept requires the support of nested file inclusion, allowing specifications to be stored in separate files. Since module names may potentially be duplicated across the files, various scoping levels are introduced to detect naming collisions. Version numbering eliminates the confusion of mismatched simulation version and configuration files. Commenting enhances the readability and maintainability of the specifications. Inheritance of top-level parameters provides a global specification of homogeneous parameters such as simulation duration.
# sim.rsim # lines started with “#” are comments RSim1.0 include “server.rsim” serverType include “cluster.rsim” clusterType # a cluster of two pentium machines cluster roomA { server inst serverType:pentium aldrin server inst serverType:pentium bean } # a cluster of two sparc machines with two sub-clusters # connected by an Ethernet cluster ficus channel inst channelType:ethernet10Mb ethernet { server inst serverType:sparc5 dover cluster inst roomA roomA server inst serverType:sparc5 thetford cluster inst clusterType:roomB roomB } # simulate the ficus cluster with a random seed number # for a duration of 576 hours. sim ficus { seed 19238483 sim 576 hr }
Figure 2: Sample Input Specification
ficus (cluster) ethernet (channel) thredford (sparc5)
roomA (cluster)
aldrin (pentium)
dover (sparc5)
bean (pentium)
roomB (cluster) (cluster.rsim)
Figure 3: Hierarchical Model Construction
3.2
Traffic Generator
The traffic generator produces file references derived from traces. Our preliminary experiments indicated that the behavior of optimistic replication is highly dependent on the pattern of file accesses generated by users. Extensive trace analysis showed four characteristics of file access patterns that were important in evaluating optimistically replicated file systems—how users share files, what operations are performed on files, rate of file access, and how much activity is generated by each user. To obtain realistic distributions for the preceding characteristics, we examined a data trace of file access patterns at Locus Computing Corporation gathered over the course of three months [Kuenning94]. This trace consists of the real activities of software developers. The traced system did not use replication, but had large numbers of users and machines connected by a LAN, performing both local and remote file accesses. To some extent, the results presented are dependent on the characteristics of this workload. However, this dependency is inescapable, and the workload selected is realistic and representative of a large class of real users. Future work may examine the performance of optimistic replication systems under other important file access workloads. Since concurrent update statistics are highly sensitive to the degree of file sharing and the number of updates, our experiments adopt a fine-grain decomposition of the file sharing and operation patterns, as shown in Figure 4. File references fed to the model are divided into read-only accesses and accesses to read/write files. File references to the read-only files do not affect most of the results in the simulation, except by contributing to the total
number of read accesses. Read/write file accesses are partitioned into accesses to shared files and non-shared files. Assuming each user always accesses a particular replica, updates to non-shared files will never create conflicts and always contain the most up-to-date data, since only a single replica is used for access to such files. Shared files are further broken down into files shared between exactly two users and files shared among more than two users (e.g., three-way shared and three-plus-way shared). As the degree of file sharing increases, the percent of write accesses decreases according to the trace data. Without this fine-grained characterization of file sharing, the percent of write accesses is often overestimated for files with a high sharing factor, and the growth rate of conflicts is potentially exponential [Heidemann95]. Examples of counting conflicts are illustrated in Figure 10 and Figure 11 of Section 5.1. File Access Read/Write Access Read-Only Access
Non-Shared Access
Shared Access 2-Way Sharing
Read Access
Write Access
2+Way Sharing (
Read Access
Write Access
(Further Splitting)
Figure 4: File Access Categorization To enhance realism, additional statistics were extracted from the trace analysis. Each sub-category described in Figure 4 is associated with a corresponding probability of file reference. The trace data is also divided into hourly intervals. Within each interval, the inter-arrival rate is described by an exponential distribution with parameters for the particular sub-category. Examination of the trace revealed file access patterns changed dramatically during the course of a day, so the entire trace was collapsed into a 24-hour piece-wise continuous function. Each piece was described by an exponential distribution with the mean equal to the expected number of file references in that category during that hour. The trace analysis further indicated that the users have a nonuniform access distribution, with only a few of the users contributing the majority of the file references. The simulation captures this skewing of the access distribution across users by distribution mapping.
3.3
Physical Resource Module
The physical resource module models the physical delays in the system. Sub-modules are defined to model the primary machine components, including a CPU model, disk system model, network interface model, and network model. The degree of detail of the preceding components is determined primarily by its significance to the reconciliation process. For instance, consider the network model. Our experiments assume that machines in a cluster are connected using an Ethernet, a popular network medium. Pilot runs indicate that the typical bandwidth of an Ethernet (10Mb) far exceeds the requirements of the reconciliation process. Consequently, we used an analytical model to develop an abstract representation of the Ethernet delay characteristics. The validation results indicate that this model is sufficiently accurate when the network is lightly loaded. The disk module simulates the seek delay, rotational delay, and data transfer delay. Although the disk is not the current bottleneck, this level of detail is required to capture the fixed overhead costs of the file system scans performed by the reconciliation process. The CPU appears to be the current bottleneck in the reconciliation process. However, a detailed simulation of the CPU is very costly. For the purpose of the application level investigation, we chose to compose an analytical model of the CPU utilization rate via direct measurement on an operational replication system. The measurement involves instrumentation of timing system calls in the source code of a particular replication system, the Rumor Replicated File System (RRFS) [Ratner96], running on a particular platform. The results are thus specific to the hardware and the operating system we chose. In this case, we measured RRFS running on Dell Latitude XP 486 100 MHz laptops with 12 Mbytes of memory and a Linux 2.0.x operating system. The resulting analytical model is a function of system attributes—the number of files and directories, the volume size, the number of replicas, the number of updates, and the number of conflicts. The validation of the analytical model is described in Section 3.6.
3.4
File System Module
The file system module models a replicated file system that supports the common operations (e.g., open, read, write, create, directory create, and directory delete) in the context of a specific file system (e.g., UNIX). The time for each operation is estimated mainly by using the disk model described earlier. The CPU overheads for those operations are negligible compared to the disk access time. The caching effects are not modeled because our measurements indicated that caching does not work well with the measured system for two plausible reasons. First, since RRFS is non-kernel invasive, detecting data modifications requires linear scanning of the replicated files. The scanning process has low locality. Second, the replicated volume size in our experiment (~220 Mbytes) is much larger than the memory size (12 Mbytes), and the reconciliation process effectively flushes the cache during the file system scanning phase of the algorithm. For other styles of replicated file systems, more detailed handling of the CPU overhead might be required. One major design issue of the file system is its simplification from a hierarchical name space to a flat name space. Since our file reference generation is essentially probabilistic, if some high-level directory nodes are deleted, the result of the remaining simulation can be hard to interpret. Both the disk and the CPU modules are adjusted to reflect this simplification. The resulting file access cost in a flat name space is the weighted sum of file and directory costs in a hierarchical name space, and the weights are based on the directory-to-file ratio of the trace data. Both the file and directory operations are mapped to read and write operations. Due to the simplification of name space and file operations, all the conflicts are caused by concurrent updates. (In real systems, other kinds of conflicts are possible due to file deletion, file creation, and file renaming.) The model can be extended to support a hierarchical name space, if necessary. The replication-specific attributes of the file system are currently modeled after the RRFS file system. For example, the storage overhead is empirically measured from the operational RRFS system. These measurements are used to develop a parameterized analytical model to deduce the storage overhead of the specific simulated file system. However, the modular nature of the design allows simple replacement of this model by the characteristics and functionality of another replicated file system.
3.5
Reconciliation Simulation
Finally, the reconciliation module simulates the reconciliation process described in Section 2. A reconciliation process is periodically initiated at each simulated server based on the interval specified for the experiment. The initiator selects the target site based on the reconciliation topology. The following steps are involved in simulating a one-way pulling reconciliation protocol by using the appropriate module in the simulator: 1. 2. 3. 4. 5. 6.
Scan the local replica for new updates (using file system and disk modules) Scan the remote replica for new updates (using file system and disk modules) Obtain file states from the remote site (using the network module) Compare local states to remote states (using the CPU module) Transfer updated files (if any) from the remote site (using the network module) Resolve any conflicts (using the file system, disk, and CPU modules)
This protocol can be extended to the two-way reconciliation protocol with minor variations. One inefficient approach is to concatenate two one-way reconciliations in opposite directions. A more efficient and complicated approach can parallelize the reconciliation.
3.6
Validation
More than 400 physical system runs were conducted to validate the following system attributes: • • • •
number of files and directories volume size, number of replicas number of updates number of conflicts
Each of the preceding attributes was initially validated in isolation. For each attribute, the predictions made by the simulation model were compared with measurements on the operational RRFS system, and the results were used to refine the model as necessary. Figure 5 compares the physically measured reconciliation time against the simulated reconciliation time as a function of replication factor. Figure 6 presents the quality of linear regressions in each of the preceding attributes. Subsequently, the experiments were extended to incorporate multiple model attributes simultaneously to determine the degree of independence among the selected attributes. The model is further refined by again comparing the model predictions and experimental measurements. The model was deemed sufficiently accurate when the predicted reconciliation completion time was found to be within 5% of the actual completion time on the selected hardware and operating system. P hysical vs. S im ulated Reco nciliation Time 500 450 Phys ical Elaps ed Time 400 350 Simulated Elaps ed Time
300 250 200
Rec onc iliation Time ( s ec ) 150 100 50
24
22
20
18
16
14
12
8
10
6
4
2
0
Number of Replic as
Figure 5: Physical vs. Simulated Reconciliation Time
R2
file 0.9958
directory 0.9991
replica 0.9995
volume size 0.9727
updates 0.9963
conflicts 0.9809
Figure 6: Coefficient of Determination for Various Linear Regressions (fraction of variance explained by the linear regression)
4
Experiments
The major goal of our experiments is to identify significant trends in both the cost and quality of service for optimistic reconciliation and to locate the region of parameter space where replication costs are near minimal. The primary independent variables investigated include user access pattern, scaling, reconciliation frequency, reconciliation protocol, and the logical update propagation topology used by the reconciliation process. The quality of service is initially measured with the common metric of conflict rate, by counting the number of conflicts detected by the replication mechanism. Other quality of service metrics are also investigated. The costs of the reconciliation are measured using reconciliation time and the computational and communication overhead introduced by the reconciliation expressed in terms of CPU cycles and network bandwidth. More than 2000 pilot runs were conducted over a large parameter space (1- to 168-hour reconciliation interval, 2 to 64 replicas1) and various resolutions to locate the regions of high variability for further investigations. The parameter space and resolutions were reduced when necessary to accelerate the data collection process. For this experiment, we used a parameter space where the number of replicas ranged from 2 to 50, and the frequency of reconciliation ranged from 4 to 44 hours.2 The reconciliation protocols used were one-way pulling and two-way 1
The limit of 64 replicas is imposed by the trace. The minimum reconciliation interval is based on the maximum reconciliation time (2.6 hours) in the selected range of parameters. It is not practical to set a reconciliation interval shorter than the time required to complete a reconciliation process, since reconciliation requests made before the completion of the current reconciliation are aborted.
2
protocols. The user access pattern is either trace-based or synthetic. For the trace-based user pattern, the entire trace is collapsed into a 24-hour piece-wise continuous function, with each piece described by an exponential distribution with the mean equal to the expected number of file references during that hour. The synthetic user pattern has the mean equal to the expected number of file references averaged during the entire course of the trace. The percentage of file accesses to the shared files in the synthetic pattern varies from 13% (from the trace) to 54%. The ratio of shared file accesses to the number of shared files is unchanged; the total number of file references in the system also remains unchanged. The three selected topologies are variants of commonly used tree topologies—ring, star, and tree with fan-out of five.3 The ring topology can be viewed as a linear tree with connected ends, and the star topology is a tree with minimal depth. To simplify the problem domain, we assume that all the files are replicated under a single volume, and the volume is fully replicated across the servers. Each server only contains one replica of the volume, and the single replica is accessed by only one local user. We also assume the constraint of reconciliation locking, defined in Section 2. Remote accesses and failures are not modeled for this initial study, but will be addressed in Section 7. Major simulation parameters are summarized in the following table (Figure 7):
Major Simulation Parameters Environment Configuration Simulation duration Calibrated hardware platform Calibrated OS platform Network channel Physical topology
576 hours Dell Latitude XP 486 100 Mhz (12 Mbytes of memory) Linux 2.0.x 10Mb Ethernet Single-level Ethernet-connected servers
System Configuration: File-sharing pattern User access skewing function Number of files File size distribution
Trace data based Distribution mapped from the trace data 10150 files (from the trace) Trace data based
Independent Variables: Number of replicas Reconciliation topology Reconciliation interval Reconciliation protocol File access interval distribution Percents of file accesses to shared files4
2, 10, 20, 30, 40, 50 replicas Ring, star, tree 4 hour to 44 hours with an 8-hour step One-way pulling, two-way Trace-data based, synthetic 13% (from the trace), 27%, 40%, 54%
Figure 7: Major Simulation Parameters
5
Results
The performance and cost characterization of the replicated file system domain are intricate due to the interdependencies of numerous parameters and metrics. The results will be presented with various cost and service quality metrics defined in Figure 8. The reconciliation time metric indicates the anticipated running time of a successful reconciliation process. The CPU overhead captures the CPU consumption for both successful and failed reconciliations. Both reconciliation time and CPU overhead heavily depend on the selected hardware, operating system environment, and the number of files. The transmission metrics characterize the network bandwidth expenditures in transferring data and meta-data related to updates. Our simulation does not keep track of the disk storage cost due to its ease of analytical derivation, given the knowledge of implementation and the information of files being replicated. However, we do include analytically deduced disk storage cost as a part of our results.
3
The fan-out of five includes the parent node. Pilot runs indicate that tree reconciliation topology with a fan-out of five performs at near minimal cost, assuming all the cost factors are equally weighted. The fan-out factor is specific to the weights applied to various cost curves, input traffic patterns, and certain simulation configuration parameters. 4 This variable uses synthetic distribution only.
Conflicts are only generated during reconciliation processes. A stale read or a stale write occurs whenever a user reads or writes an out-of-date replica of a file. The results of our experiments are organized into seven sub-sections targeted at readers with various interests on the performance of optimistic replicated filing systems. The first two subsections address the service quality and impact of user behavior. The subsequent subsections explore configuration options for optimistic replicated systems—replication factor, reconciliation protocol, reconciliation topology, and reconciliation interval. The last subsection describes the costs of replication service specific to RRFS, as guidance for the optimistic replication system designers.
Metrics Cost Metrics Reconciliation Time
CPU Overhead Transmission Volume Per Replica Aggregate Transmission Volume Storage Quality of Service Metrics Conflict Rate Stale Read Rate Stale Write Rate
Definitions elapsed time from the moment at which a replica requests reconciliation to a remote replica to the moment at which all files in the local replica are reconciled, excluding aborted sessions5 percent CPU utilization per replica due to reconciliation process, including the aborted sessions bandwidth required per replica for conducting periodic reconciliations global bandwidth required for all replicas to perform periodic reconciliations storage required per replica to keep track of the replicated states
number of conflicts per replica per hour number of stale reads per replica per hour number of stale writes per replica per hour
Figure 8: Definitions of Various Metrics
5.1
Quality of Service—Conflict Rate
The standard metric that is currently used to quantify the service quality of optimistic replication is conflict rate. Conflict rate measures the frequency with which concurrently updated files are detected; detection takes place during a reconciliation process. However, we discovered that the conflict rate metric is fragile in several ways. First, it is very sensitive to the effect of reconciliation frequency (). Since detection and recording conflicts only occur during a reconciliation process, at one extreme one can reduce the number of conflicts to zero by never reconciling, resulting in no updates ever being propagated anywhere. Clearly, the conflict rate alone cannot fully capture the service quality of optimistic updates.
5
The time spent for aborted sessions is the elapsed time from the moment at which a replica requests reconciliation to a remote replica to the moment at which the replica receives the rejection message from the remote replica.
A ve rag e C onflict Rate 0.003-0.0035 0.0025- 0.003 0.002-0.0025 0.0015- 0.002 0.001-0.0015 0.0005- 0.001 0-0.0005 50 0.0035 0.003
40
0.0025 Conf licts Per Replic a Per Hour
0.002
30
0.0015 0.001
20
0.0005
Number of Replic as
0 10
4 12 20 28 Rec onc iliation Inter v al
2
36 44
Figure 9: Conflict Rate With Varying Reconciliation Intervals and Replication Factors Further, resolving a conflict may involve the possible creation of a new version of data that combines the old versions, and this new version can cause subsequent conflicts as it propagates. Depending on the order in which the reconciliation events are generated, the total number of conflicts can vary significantly. Figure 10 and Figure 11 present two sequences of reconciliation events to merge three different versions of data, located on three different servers. These two figures show that the total number of conflicts does not entirely depend on number of data versions [Heidemann95]. In addition, the variance of conflict rate is potentially high.
Current Versions Server 1 Server 2 Server 3 A B C AB B C AB B ABC AB ABC ABC
Events Server 1 pulls data from server 2 Server 3 pulls data from server 1 Server 2 pulls data from server 3 Server 1 pulls data from server 2
Server 1 AB AB AB ABC
Next Versions Server 2 Server 3 B C B ABC ABC ABC ABC ABC
Total Conflicts 1 2 2 2
Figure 10: A Reconciliation Sequence to Merge Three Different Versions of Data Current Versions Server 1 Server 2 Server 3 A B C AB B C AB BC C AB BC ABC ABC BC ABC
Events Server 1 pulls data from server 2 Server 2 pulls data from server 3 Server 3 pulls data from server 1 Server 1 pulls data from server 2 Server 2 pulls data from server 3
Server 1 AB AB AB ABC ABC
Next Versions Server 2 Server 3 B C BC C BC ABC BC ABC ABC ABC
Figure 11: Another Reconciliation Sequence to Merge Three Versions of Data
Total Conflicts 1 2 3 4 4
During the course of our experiments, we proposed an alternative pair of metrics to measure the service quality of replication—stale read rate and stale write rate. A stale read or a stale write occurs whenever a user reads or writes an out-of-date replica. This basic observation is that optimistic replication can cause a user to access a file version older than the most current version in the overall system, because reconciliation has not yet propagated the newest update to the accessed replica. These metrics are difficult to measure in real systems, but can be accurately captured in a simulation. We combined the use of both the conflict rate and stale access rate to give a truer picture of service quality of optimistic replication environment (Figure 9, Figure 12, Figure 13). A verage S tale W rite Rate
A verage S tale Read Rate
0.02-0.025
0.003-0.004
0.015-0.02 0.002-0.003 0.01-0.015 0.001-0.002 0.005-0.01 0-0.001
0-0.005
50
50
0.004
0.025 40
0.003 30
Stale Writes Per Replic a 0.002 Per Hour
0.015
20
Number of Replic as
0
30
Stale Reads Per Replic a Per Hour
0.001
40
0.02
0.01 20
0.005
Number of Replic as
0 10
4
10
4 12
12 20
20 28
Rec onc iliation Interv al
28
2
36
Rec onc iliation Interv al
44
Figure 12: Average Stale Write Rate With Varying Reconciliation Intervals and Replication Factors
2
36 44
Figure 13: Average Stale Read Rate With Varying Reconciliation Intervals and Replication Factors
The stale access curves (Figure 12 and Figure 13) are smoother than the conflict curve (Figure 9)—an indication of lower variance and higher stability of stale access metrics. Also, stale access rates comply with the intuition that service quality should degrade as reconciliation interval and replication factor increase. Figure 14 summarizes the service quality results of the RRFS. The median6 conflict rate is 0.0016 conflicts per replica per hour, or 1 conflict every 26 days. The median for stale read and stale write rates is 0.011 stale reads per replica per hour and 0.0030 stale writes per replica per hour, or 1 stale access every four days. From the trace analysis, 2.1% of files are shared files; 85% of shared files have a sharing factor of two and receive 85% of shared accesses, and the majority of the shared files are document files. Those numbers depict a working environment where the majority of joint documentation efforts is done in pairs, and remaining replicas often wait for the propagation of the most up-to-date information. The trace analysis and the low frequency of the conflict rate indicate that updates are infrequent and mostly compatible; optimistic replication is the appropriate solution for this type of working environment. Service Quality Metrics Conflict Rate Stale Read Rate Stale Write Rate
Service Quality 0.0016 conflicts/replica/hr 0.011 stale reads/replica/hr 0.0030 stale writes/replica/hr
Figure 14: Service Quality of RRFS The analysis of service quality of optimistic replication also involves many other dimensions—user access pattern, resource costs, replication factor, reconciliation topology, reconciliation protocol, and reconciliation interval. We will visit each in turn.
6
The median values are used due to the skewing of the data curves. The values correspond the simulation environment with 25 replicas with tree reconciliation topology, reconciling at 24-hour interval using one-way pulling protocol. The file access distribution is trace-based.
5.2
Impact of User File Access Pattern
Most of the results presented in this paper use the trace-based workload described in the previous section. In addition, we also used a synthetic workload to predict the impact of different user access patterns on the service quality and cost metrics of optimistic replication. The synthetic workload has the same mean arrival rate as the trace, but the arrivals are assumed to be distributed uniformly. Figure 15 shows the results for the trace-based and synthetic file reference patterns. As seen from the figure, the resource cost metrics show no noticeable differences, but the service quality differed by almost one order of magnitude. Metrics Cost Metrics Reconciliation Time (minutes) CPU Overhead (during the reconciliation time) Transmission Volume Per Replica (Mbytes/hr) Aggregate Transmission Volume (Mbytes/hr) Storage (Mbytes/replica)
Costs (trace based)
Costs (synthetic)
19-130 27-100% 0.27-3.4 0.54-160 12-27
19-140 29-100% 0.29-3.6 0.60-170 12-27
Quality of Service Metrics Conflict Rate (conflicts/replica/hr) Stale Read Rate (stale reads/replica/hr) Stale Write Rate (stale writes/replica/hr)
0.0016 0.011 0.0030
0.012 0.11 0.026
Figure 15: Impact of Trace-Based vs. Synthetic File Access Pattern Given that the primary difference between the two generators was that the synthetic one used a uniform arrival rate, whereas the trace-based generator had wide variations in the mean arrival rate, the preceding results offer the following lessons: 1) The service quality of the optimistic replication is highly sensitive to the user pattern; a significant amount of attention should be devoted to trace analysis and the modeling of the user traffic. 2) The insensitivity of resource costs toward service quality metrics indicates that the replication costs are mostly attributed to the overhead of maintaining the replicated file system database. Given that shared files only account for 2.1% of the total replicated files, such overhead can be significantly reduced by only replicating data that needs to be shared [Ratner95]. 3) Optimistic replication benefits from the cyclic nature of user access patterns. During the busy hours, each reconciliation process effectively carries more updates from one replica to another; the system as a whole achieves a higher level of synchronization, compared to a system with a uniform distribution of file access traffic. We also investigated the impact of varying the percentage of file accesses that are directed at shared files in the synthetic generator. The trace indicated that accesses to the shared file were restricted to only about 13% of total files. In our experiments, we artificially increased the percentage of shared file accesses and measured the impact on both cost and service quality metrics. Our results indicate that the replication costs again are not sensitive toward service quality metrics for reasons similar to those cited above. However, as seen in Figure 16, Figure 17, and Figure 18, conflict, stale read, and stale write rates display near linear growth as the percentage of file references to the shared files is increased.
C onflict Rate unde r D ifferent P e rcents of S hared F ile A cces ses 0.009
0.008
0.007
0.006
0.005
0.004 Conf licts Per Replic a Per Hour
0.003
0.002
0.001
0 13
27
40
54
Perc ents of Shar ed File A c c ess es
Figure 16: Conflict Rate With Varying Percents of Shared File Accesses S tale W rite Rate under D ifferent P ercents of S hared File A ccesses
S tale W rite Rate under D ifferent P ercents of S hared F ile A ccesses 0.035
0.0 12
0.03 0.0 1
0.025 0.0 08 0.02 0.0 06 0.015 Stale Wr ites Per Replic a Per Hour
Stale Reads Per Replic a Per Hou r
0.0 04
0.01
0.0 02
0.005
0
0 13
27
40
54
Perc ents of Shared File A c c es s e s
Figure 17: Stale Write Rate With Varying Percents of Shared File Accesses
5.3
4
12
20
28
Per c ents of Shar ed File A c c es s es
Figure 18: Stale Read Rate With Varying Percents of Shared File Accesses
Impact of Scaling
Our scaling experiment varied the number of replicas of a volume, while the number of files within the replicated volume remained constant. Most of the metrics varied in a near-linear or sub-linear manner as the number of replicas was increased. Reconciliation time demonstrates near-linear scaling (Figure 19). Each reconciliation process incurs a fixed overhead traversing the replicated volume and spends additional time processing the RRFS database. The reconciliation CPU overhead scales sub-linearly due to the reconciliation locking constraint defined in Section 2 (Figure 20). Increasing the replication factor lengthens the reconciliation time and increases the chance of aborting reconciliation due to reconciliation locking. This abortion mechanism prevents the reconciliation process from fully occupying the CPU. The same mechanism causes a negative sub-linear impact on the transmissionvolume-per-replica metric under small reconciliation intervals. This mechanism also slows the growth rate of transmission volume per replica metric under large reconciliation intervals (Figure 21). The transmission volume metric at the aggregate level displays exponential growth as the replication factor increases. However, the levels of the transmitted volumes are far below the bandwidth of typical local area network bandwidths (Figure 22).
A ve rag e Reconciliation Time
A ve rag e C P U Utilization
2.5 4-hr rec on interv al 12-hr r econ interv al 20-hr r econ interv al 28-hr r econ interv al 36-hr r econ interv al 44-hr r econ interv al
0.35 4-hr rec on interv al 12-hr r econ interv al 20-hr r econ interv al 28-hr r econ interv al 36-hr r econ interv al 44-hr r econ interv al
2
1.5
0.3
0.25
0.2
0.15 1 Rec onc iliation Time ( hr )
Perc ent Utiliz ation 0.1 0.5 0.05
0
0 2
10
20
30
40
50
2
10
20
Replicas
Figure 19: Average Reconciliation Time With Varying Replication Factors
40
50
Figure 20: Average CPU Utilization With Varying Replication Factors
A ve rag e Tra nsmission Rate P er Replica
A ve rag e A gg rega te Transm issio n Ra te 140
3.5 4-hr rec on interv al 12-hr r econ interv al 20-hr r econ interv al 28-hr r econ interv al 36-hr r econ interv al 44-hr r econ interv al
30 Replicas
4-hr rec on interv al 12-hr r econ interv al 20-hr r econ interv al 28-hr r econ interv al 36-hr r econ interv al 44-hr r econ interv al
3
2.5
2
1.5
120
100
80
60
Mby tes Trans mitted Per
Mby tes Trans mitted Per
Replica Per Hour
Hour 1
40
0.5
20
0
0 2
10
20
30
40
50
Replicas
Figure 21: Average Transmission Volume Per Replica With Varying Replication Factors
2
10
20
30
40
50
Replicas
Figure 22: Average Aggregate Transmission Volume With Varying Replication Factors
Depending on the reconciliation interval, the conflict rate increases super-linearly or sub-linearly with the growing replication factor. Since our system traffic exhibits high locality on updates, high reconciliation frequency can trigger a feedback effect, or super-linear conflict growth rate.7 On the other hand, low frequency of reconciliation allows the shared files to be updated many times before propagation, and the conflict rate shows the desirable sub-linear growth rate (Figure 23). Both stale read and stale write rates grow sub-linearly and asymptotically as the number of replica increases (Figure 24 and Figure 25). Seventy percent of the updates are generated by fourteen percent of the users. Therefore, most of the replicas in a large-scale environment contribute little file access activities, assuming each replica is accessed by only one local user. As the overall system degrades due to scaling, the majority of the accesses will be stale accesses; the number of stale reads and stale writes converges to the total number of reads and writes on the shared files.
7
This effect is not investigated in our experiments because that range of reconciliation interval is shorter than the time required to complete a reconciliation process, and a realistic system setting should not be configured to do so. In general, assuming zero reconciliation time and a large replication factor, a shorter reconciliation time can induce the exponential growth of conflict rate [Heidemann95].
A ve rag e C onflict Rate 0.0035 4-hr r ec on inter v al 12-hr rec on inter v al 20-hr rec on inter v al 28-hr rec on inter v al 36-hr rec on inter v al 44-hr rec on inter v al
0.003
0.0025
0.002
0.0015 Conf licts Per Replic a Per Hour 0.001
0.0005
0 2
10
20
30
40
50
Replic as
Figure 23: Average Conflict Rate With Varying Replication Factors
A ve rag e S ta le W rite Rate
A ve rag e S ta le Read Rate 0.025
0.004 4-hr rec on interv al 12-hr r econ interv al 20-hr r econ interv al 28-hr r econ interv al 36-hr r econ interv al 44-hr r econ interv al
Stale Writes Per Replic a
4-hr rec on interv al 12-hr r econ interv al 20-hr r econ interv al 28-hr r econ interv al 36-hr r econ interv al 44-hr r econ interv al
0.0035
0.003
0.0025
0.02
0.015
0.002 Stale Reads Per Replic a 0.01
0.0015
Per Hour
Per Hour 0.001 0.005 0.0005
0
0 2
10
20
30
40
50
Replicas
Figure 24: Average Stale Write Rate With Varying Replication Factors
2
10
20
30
40
50
Replicas
Figure 25: Average Stale Read Rate With Varying Replication Factors
Optimistic replication shows near-linear and sub-linear scaling trends in most of the metrics. Stale read and stale write rates at a high replication factor seem unlikely to be improved significantly by adjusting the reconciliation frequency. However, a large class of applications can still appropriately operate with the current scaling characteristics. In addition, an optimistic replication system does not commit to any fixed data propagation path and centralized resources. In the face of network partitionings and site failures, a large-scale optimistic replication can potentially provide a better fault-tolerant solution, as opposed to the conservative large-scale replication systems with fixed data propagation path and centralized resources. We will explore the fault-tolerant scaling issues in our future study.
5.4
Impact of Reconciliation Topology
We selected ring and star reconciliation topologies for investigation because they are representative of a large class of distributed system configuration. The ring topology naturally maps to the popular Ethernet local area network, while the star topology resembles a client/server configuration. Neither of these topologies dominates under all the metrics. Figure 26 summarizes the performance of the various topologies considered in this study for each of the metrics; the dashed lines indicate the relative distance among the median values for the corresponding topologies. The star topology has lower cost metrics and conflict rate. However, it provides limited concurrency because the
server is frequently locked, which forces the reconciliation process in the entire system to perform serially and also leads to a high rate of aborted reconciliation sessions. A reduced number of reconciliation processes in the system also decreases the possibility of detecting conflicts; the conflict rate drops consequently. Although the overall resource costs are lower for the star topology, the updates progress slowly leading to higher stale read and write rates. On the other hand, the ring topology has lower stale read and write rates, because the dissemination of updates does not involve contention for access to any centralized resource. Metrics
Topology Ranking (Best to Worst)8
Cost Metrics Reconciliation Time CPU Overhead Transmission Volume Per Replica Aggregate Transmission Volume Storage Per Replica
Star------Tree----Ring Star---------Tree-Ring Star---------Tree-Ring Star---------Tree-Ring No difference
Quality of Service Metrics Conflict Rate Stale Read Rate Stale Write Rate
Star----Tree------Ring Ring--Tree--------Star Tree--Ring--------Star
Figure 26: Topology Ranking The ring topology can be viewed as a linear tree, and the star topology can be viewed as a tree with maximum fan-out. By locating the number of replicas where the weighted sum of various ring topology costs are equal to the sum of star topology, we derived the intermediate 4-tree topology from our experimental settings. Figure 26 shows that the 4-tree has the intermediate values in replication cost metrics, and the net measure of service quality surpasses the other two topologies at low replication factor. Figure 27 and Figure 28 demonstrate how the tree topology combines the strengths of both ring and star topologies. However, as the replication factor increases, the stale read and stale write rates asymptotically degrade for all topologies. Our set of cost metrics suggests that star topology could be the choice for large-scale optimistic replication systems. However, the fault-tolerance metric is not considered in our research, and the inclusion of this metric can change our current results.
8
The dashed lines indicate the affinity of median values among those reconciliation topologies.
A verage C onflict Rate fo r Ring Top ology
A verag e S tale Re ad Rate for Ring Topo lo gy
0.01-0.012
0.02-0.025
0.008-0.01
0.015-0.02
0.006-0.008 0.01-0.015 0.004-0.006 0.005-0.01
0.002-0.004
0-0.005
0-0.002
50
50
0.012
0.025 40
0.01
40
0.02
0.008 0.015
30
Conf lic ts Per Replic a Per 0.006 Hour 0.004
Per Hour 20
0.002
30
Stale Reads Per Replic a 0.01 20
0.005
Number of Replic as
0
Number of Replic as
0 10
4
10
4
12
12 20
20 28
Rec onc iliation Interv al
28
2
36
Rec onc iliation Interv al
44
A verage C onflict Rate fo r S tar Top olog y
2
36 44
A verag e S tale Re ad Rate for S tar Topo logy
0.01-0.012
0.02-0.025
0.008-0.01
0.015-0.02
0.006-0.008 0.01-0.015 0.004-0.006 0.005-0.01
0.002-0.004
0-0.005
0-0.002
50
50
0.012
0.025 40
0.01 0.008
0.015
30
Conf lic ts Per Replic a Per 0.006 Hour 0.004 20
30
Stale Reads Per Replic a Per Hour
0.002
40
0.02
0.01 20
0.005
Number of Replic as
0
Number of Replic as
0 10
4
10
4 12
12 20
20 28
Rec onc iliation Interv al
28
2
36
Rec onc iliation Interv al
44
A verage C onflict Rate fo r Tre e Top ology
2
36 44
A verag e S tale Re ad Rate for Tree Topo lo gy
0.01-0.012
0.02-0.025
0.008-0.01
0.015-0.02
0.006-0.008 0.01-0.015 0.004-0.006 0.005-0.01
0.002-0.004
0-0.005
0-0.002
50
50
0.012
0.025 40
0.01
0.02
0.008 30
Conf lic ts Per Replic a Per 0.006 Hour 0.004
0.015
0.002
Number of Replic as
0
30
Stale Reads Per Replic a Per Hour
20
40
0.01 20
0.005
Number of Replic as
0 10
4
10
4 12
12 20
20 28
Rec onc iliation Interv al
2
36 44
Figure 27: Average Conflict Rate With Varying Reconciliation Topologies
28 Rec onc iliation Interv al
2
36 44
Figure 28: Average Stale Read Rate With Varying Reconciliation Topologies
5.5
Impact of Reconciliation Protocol
The current implementation status of RRFS only supports the one-way reconciliation protocol. We simulated the impact of two-way reconciliation protocol by exchanging the replicated states in both directions during a reconciliation. The results show that the quality of service improves significantly with only a marginal increase in the cost metrics. Figure 29 shows that the conflict rate increases by 16% because both the sites that participated in reconciliation generate conflicts during a two-way reconciliation process. The stale read and stale write rates improve by 29% and 20% because the update propagation rate doubles. In the future, we want to further investigate multi-way reconciliation protocols in order to exploit parallelism in the reconciliation process. Metrics Cost Metrics Reconciliation Time (minutes) CPU Overhead (during the reconciliation time) Transmission Volume Per Replica (Mbytes/hr) Aggregate Transmission Volume (Mbytes/hr) Storage Per Replica (Mbytes/rep)
Costs (one-way)
Costs (two-way)
19-130 27-100% 0.27-3.4 0.54-160 12-27
19-140 30-100% 0.51-6.3 1.0-320 12-27
Quality of Service Metrics Conflict Rate (conflicts/replica/hr) Stale Read Rate (stale reads/replica/hr) Stale Write Rate (stale writes/replica/hr)
0.0016 0.011 0.0030
0.0019 0.0082 0.0024
Figure 29: Impact of One-Way vs. Two-Way Reconciliation Protocol
5.6
Impact of Reconciliation Interval
The choice for a reconciliation interval has strong implications for the operating costs and the service quality of replicated filing. Reconciliation time is not sensitive to the reconciliation interval because most of the time is spent on tree walks and processing the data structure instead of propagating updates. CPU overhead and network traffic decreased exponentially as the reconciliation interval lengthened. The conflict rate also decreased simply because the reconciliation process is less frequent, and, as discussed earlier, conflicts are counted only during a reconciliation (Figure 30). Stale read and stale write rates increase sub-linearly as the reconciliation interval lengthens due to the slower data propagation rate (Figure 31 and Figure 32). The reconciliation interval clearly plays an important role in determining RRFS operating costs. Overly frequent reconciliations incur high CPU overhead, network bandwidth requirement, and conflict rate. Infrequent reconciliations induce high stale read and write rates.
A ve rag e C onflict Rate 0.0035 2 r eplic as 10 r eplicas
0.003
20 r eplicas 30 r eplicas
0.0025
40 r eplicas 50 r eplicas
0.002
0.0015 Conf licts Per Replic a Per Hour 0.001
0.0005
0 4
12
20
28
36
44
Rec onc iliation Inter v al
Figure 30: Average Conflict Rate With Varying Reconciliation Intervals
A ve rag e S ta le W rite Rate
A ve rage S ta le Read Rate
0.004
0.025
2 replic as 10 replic as
2 replic as 0.0035
10 replic as
20 replic as 30 replic as
20 replic as 0.003
0.02
30 replic as
40 replic as
40 replic as 0.0025
50 replic as
50 replic as
0.015
0.002
Stale Writes Per Replic a
Stale Reads Per Replic a 0.01
0.0015
Per Hour
Per Hour 0.001 0.005 0.0005
0
0 4
12
20
28
36
44
Rec onc iliation Interv al
Figure 31: Average Stale Write Rate With Varying Reconciliation Intervals
4
12
20
28
36
44
Rec onc iliation Interv al
Figure 32: Average Stale Read Rate With Varying Reconciliation Intervals
The preferred reconciliation interval varies depending on cost emphasis. Assuming equal weighting of costs, the preferred reconciliation interval is 8 to 10 hours (Figure 33). However, this globally optimal solution is counter-intuitive for end-users with daily work cycles. Assuming an 8-hour work schedule and 8-hour reconciliation interval, a user can only work with at most one out of three updates of data everyday. A 24-hour reconciliation interval should provide end-users this same perception of receiving one update everyday. However, the service quality is different. The key to understanding this counter-intuitive result is the rate of data flow in the entire system. Consider a ring topology with one-way propagation protocol. An 8-hour reconciliation interval assures an update propagates to a minimum of three replicas downstream in one day. In the same period, a 24-hour reconciliation interval only assures an update to propagate to a minimum of one replica. Every day, an end-user works on one update of data, but that update can encapsulate the changes from one to three replicas upstream, depending on an 8hour or 24-hour reconciliation interval.
O ptimiza tion C urve 0.8- 1 0.6- 0.8 0.4- 0.6 0.2- 0.4 0-0.2
Low Cos t 1 0.8 Weighted Sum of Cos t 0.6 and QoS Metrics ,
0.4
Normalized to One 0.2
Emphas is of Optimization
0 4 12 20 28
High Q uality of Ser vice
36 Rec onc iliation Interv al
44
Figure 33: Optimization Curve for Reconciliation Interval
5.7
Costs of Optimistic Replication
The complete simulation model was validated against an early version of RRFS. The experiments were used both to identify the performance bottlenecks in the preliminary version of the software and to validate the model. Although the performance of subsequent versions of RRFS has improved by an order of magnitude, we present the results of the original experiment as a case study of the simulator in identifying performance bottlenecks in the original design. Figure 34 summarizes the operating costs of RRFS predicted by the study. The cost figures presented are median values, extracted from the data with varying topologies, replication factors, and reconciliation intervals; the reconciliation protocol is one-way, and the traffic generator is trace-based. The use of median is due to skewing of various data curves. The median figures closely approximate the data points collected under one-way tree topology with 25 replicas and 24-hour reconciliation interval. The traffic pattern is trace based.
Metrics Cost Metrics Reconciliation Time CPU Overhead Transmission Volume Per Replica Aggregate Transmission Volume Storage Per Replica
Costs (trace based) 75 minutes 35% during the reconciliation time (4.0% of the total CPU time during the entire simulation) 0.67 Mbytes/hr 17 Mbytes/hr 19 Mbytes (for 220 Mbytes of replicated data)
Figure 34: Operating Costs of RRFS The reconciliation time has the median of 75 minutes, and the percent CPU utilization due to reconciliation has the median of 4.0%. The median CPU overhead obscures the fact that RRFS is operated periodically. The CPU overhead cost is zero most of the time. On average, a replica has 2.2 neighbors; every 8 hours either the local or the remote replica triggers a reconciliation process. If the local replica is the initiator of the process, the CPU utilization increases to 35% for the duration of 75 minutes. For the reconciliation process initiated by the remote sites, the duration is approximately 37 minutes. These numbers appear to be high and suggest opportunities for optimizations. RRFS is not invoked during the kernel traps of the file accesses. Consequently, the reconciliation process spends a significant portion of time scanning the file system for updates. The current implementation scans the source and target sites serially, which can be parallelized for performance gain. Another significant portion of the reconciliation process is spent on processing replicated states that have not changed since the previous reconciliation. We know that the minimum reconciliation
time (reconciling empty volumes) takes few seconds, and these metrics increase linearly with the number of files. Given that only 2.1% of the files are shared, a finer replication granularity can reduce reconciliation time and CPU utilization by a factor of 50. However, identifying the shared files may be non-trivial. An alternative is to compress the replicated state representation by exploiting the low sharing characteristics of file references, or by abstracting the states in a hierarchical manner. The median transmission volume per replica is 0.67 Mbytes/hr, and the median value for aggregate transmission volume is 17 Mbytes/hr. The bandwidth requirements for both are far below typical local area network bandwidths, but may be relevant for modem transmissions (6.5 Mbytes/hr for 14.4 Kbyte modems). The median storage requirement is about 8.5% of the replicated data.
6
Related Work
Many analytical modeling and simulation studies have been done for comparing the performance of various replication control protocols, but optimistic consistency strategies are often not addressed [Johnson90, Goldweber89, Liu94]. Golding’s thesis has the strongest parallel to our work. Golding describes a timestamped anti-entropy protocol that has a one-to-one mapping to our reconciliation process. His primary quality of service metric is the mean time to convergence of concurrent updates, and his results do not capture the impact of user patterns. If the user update rate out-paces the convergence rate, the system can get into a highly unstable state [Golding91, Golding93]. Gray’s study of optimistic replication assumes uniform access patterns of replicated data and suggests that scaling of peer-to-peer replication is questionable [Gray96]. However, from our comparison of synthetic and trace-based workload, the lack of temporal access locality can exacerbate the quality of service by an order of magnitude. From the perspective of data sharing, 81% of our files are only two-way shared among the users, despite the fact that the overall system scales without the degradation of service quality. We have found that relatively few attempts have been made to explore the area of conflicts. The definitions and issues of conflicts are best represented in the paper by Heidemann et al. [Heidemann95]. Conflict measurement studies are represented in the Ficus and Coda works. One major difference between the RRFS and these systems is the data propagation policy—both Ficus and Coda attempt to propagate data immediately. Ficus demonstrates that a conflict occurs approximately every four days. The Coda results indicate that the chances of two different users modifying the same file within a week are less than 0.4% [Kistler92, Noble94, Popek90, Reiher94, Reiher96]. Page has applied analytical methods to understand conflicts. However, his study assumes uniform file reference patterns, and the characterization of conflicts under wide parameter spaces can only be explored via a simulation framework [Page96]. Carey’s simulation study of various DBMS conflict detection algorithms emphasizes differentiating various consistency protocols in terms of system response time. Conflict issues are not deeply explored. Also, the simulation of a single file cannot be easily generalized to overall file system performance [Carey89]. To our best knowledge, our work is the first simulation framework that examines the aspects of conflicts. The design issues involved in SynRGen, a synthetic file reference generator developed at CMU, have greatly assisted us in shaping our file reference model. SynRGen captures the temporal and spatial localities of file references, and it models file sharing by having synthetic users perform activities in shared volumes. SynRGen focuses on how each user behaves, while our file reference generator focuses on how each file is accessed. For example, 1.7% of the files are two-way shared, and they receive 6.9% of file references. We designed our own file reference generator to handle the high sensitivity of the problem domain toward the degree of file sharing. Other early works on file system characteristics and reference patterns also shed light on refining our file reference model [Ebling94, Satyanarayanan81, Satyanarayanan84].
7
Conclusions & Future Work
We have developed a flexible, extensible, and scalable simulation framework to analyze the cost, configuration, and quality of service issues of an optimistically replicated filing environment. The results have identified the major trends of optimistically replicated file systems (Figure 35). By constructing optimization curves with various emphasis of cost and service quality metrics, we can locate the optimal range of parameter space where replication costs are minimal.
Metrics
Costs (trace based)
Scaling Trend
9
Topology Ranking (Best to Worst)10
Recon 11 Interval
Cost Metrics Reconciliation Time (minutes) CPU Overhead (during the reconciliation time) Transmission Volume Per Replica (Mbytes/hr) Aggregate Transmission Volume (Mbytes/hr) Storage Per Replica (Mbytes/replica)
19-130 27-100% 0.27-3.4 0.54-160 12-27
+ linear + sub-linear +/- sub-linear + exponential + linear
Star------Tree----Ring Star---------Tree-Ring Star---------Tree-Ring Star---------Tree-Ring No difference
+ linear - sub-linear - sub-linear - sub-linear No difference
Quality of Service Metrics Conflict Rate (conflicts/rep/hr) Stale Read Rate (stale reads/rep/hr) Stale Write Rate (stale writes/rep/hr)
0.0016 0.011 0.0030
+ super- or sub-linear + sub-linear + sub-linear
Star----Tree------Ring Ring--Tree--------Star Tree--Ring--------Star
- sub-linear + sub-linear + sub-linear
Figure 35: Trend Summary of RRFS The operational costs of optimistic replication do not appear to be a deterrent to its use. Users do not have a constant background overhead cost, and the users can decide when to pay the aggregate cost with minimal impact on system performance. With 25 replicas of 10150 files, this form of replication can offer a suitable quality of service—one conflict every 26 days and one stale access every four days. The relative weight of each cost component can be adjusted to implement a reconciliation configuration and schedule that is appropriate for special user preferences. Optimistic, peer-to-peer replication scales well; the service quality is self-regulated by the percentage of active users in a large distributed system. Figure 35 shows that nearly all the metrics receive sub-linear impact from scaling. The figure also shows that different reconciliation topologies offer different cost distributions across varying metrics. We have demonstrated the manipulation of the topology to minimize the replicated filing cost through the derivation of 4-tree topology. The reconciliation interval directly adjusts the tradeoffs between the optimistic replication costs and its service quality. During our experiments, we discovered the fragility of conflict rate through its high variance, high sensitivity toward the file reference generator, awkward dependencies on the reconciliation rate, and elusive nature for analytical analysis. Stale read and stale write rates are easy to understand and interpret, and they demonstrated higher stability across various parameters. In addition to the general findings on the performance of replicated file systems, the results were invaluable in identifying the cost, performance, and scaling bottlenecks in the initial RRFS configuration. The experimental findings also suggest various possibilities for future investigations: applying various input traces on the existing simulation framework, exploring mobile and frequently disconnected environments, examining the issues of fault tolerance on optimistically replicated environments, exploiting human behaviors to achieve higher system performance, analyzing the interactions among the spatial and temporal reconciliation topologies and physical topologies, conducting large-scale experiments involving hundreds of replicas, and developing an intelligent agent to adaptively control the system configurations.
8
Acknowledgments
We wish to thank Geoffrey Kuenning and Maria Ebling for providing file system traces. We also wish to express our appreciation to the File Mobility Group and Parallel Simulation Group at UCLA for providing generous technical support, especially Vikas Jha, Mark Yarvis, Geoffrey Kuenning, David Ratner, Ted Kim, and Michael Connors. In addition, we would like to thank Janice Martin and Alex Bui for giving us helpful comments on this paper.
9
The “+” and “-” symbols denote the slope of the trend. The dashed lines indicate the affinity of median values among those reconciliation topologies. 11 The “+” and “-” symbols denote the slope of the trend. 10
9
References
[Bagrodia et al. 1994] Bagrodia, R. and Liao, W. T., “MAISIE: A Language for the Design of Efficient DiscreteEvent Simulations,” IEEE Transactions on Software Engineering, 20(4), April 1994, pp. 225-238. [Bagrodia 1994] Bagrodia, R. Maisie User Manual Release 2.2, University of California, Los Angeles, 1995. [Bertsekas et al. 1992] Bertsekas, D. and Gallanger, R. Data Networks Second Edition, Prentice Hall, 1992. [Carey et al. 1989] Carey, M. J. and Livny, M., “Conflict Detection Tradeoffs for Replicated Data,” Technical Report #826, University of Wisconsin, March, 1989. [Daniels et al. 1994] Daniels, D., Doo, L. B., Downing, A., Elsbernd, C., Hallmark, G., Jain, S., Jenkins, B., Lim, P., Smith, G., Souder, B., and Stamos, J., “Oracle’s Symmetric Replication Technology and Implications for Application Design,” in Proceedings of SIGMOD Conference, 1994, p. 467. [Ebling et al. 1994] Ebling, M. R. and Satyanarayanan, M., “SynRGen: An Extensible File Reference Generator,” in Proceedings of the 1994 ACM Sigmetrics Conference on Measurement and Modeling of Computer Systems, Nashville, TN, May 1994. [Golding et al. 1991] Golding, R. and Long, D. D. E., “Accessing Replicated Data in a Large-Scale Distributed System,” International Journal in Computer Simulation, 1(2), 1991. [Golding 1993] Golding, R. A., “Modeling Replica Divergence in a Weak-Consistency Protocol for Global Scale Distribution Data Bases,” Technical Report UCSC-CRL-93-09, University of California, Santa Cruz, 1993. [Goldweber et al. 1989] Goldweber, M., Johnson, D. B., and Raab, L., “A Comparison of Consistency Control Protocols,” Technical Report PCS-TR89-142, Department of Mathematics and Computer Science, Dartmouth College, 1989. [Gray et al. 1996] Gray, J., Helland, P., O’Neil, P., and Shasha, D., “The Dangers of Replication and a Solution,” in Proceedings of the 1996 ACM SIGMOD Conference, pp. 173-182. [Guy et al. 1990] Guy, R., Heidemann, J., Mak, W., Page, T., Popek, G., and Rothmeier, D., “Implementation of the Ficus Replicated File System,” in Proceedings of the Usenix Summer Conference, June 1990, pp. 63-71. [Guy et al. 1993] Guy, R., Popek, G., and Page, T. W., “Consistency Algorithms for Optimistic Replication,” in Proceedings of the First International Conference on Network Protocols, IEEE, October 1993. [Heidemann et al. 1995] Heidemann, J., Goel, A., Popek, G., “Defining and Measuring Conflicts in Optimistic Replication,” Technical Report CSD-950033, University of California, Los Angeles, 1995. [Irlam 1993] Irlam G, UNIX File Size Survey—1993, http://www.base.com/gordon/ufs.html, 1993. [Johnson et al. 1990] Johnson, D. B. and Raab, L., “A Tight Upper Bound on the Benefits of Replication and Consistency Control Protocols,” Technical Report PCS-TR90-157, Department of Mathematics and Computer Science, Dartmouth College, 1990. [Kazer 1988] Kazar M., “Synchronization and Caching Issues in the Andrew File System,” in Proceeding of the Winter Usenix Conference, February 1998, pp. 31-43. [King 1994] King, H. T., “On Optimistic Methods for Concurrency Control,” Readings in Database Systems, Morgan Kaufmann Publishers, San Francisco, California, 1994. [Kistler et al. 1992] Kistler, J. J., and Satyanarayanan, M., “Disconnected Operation in the Coda File System,” ACM Transactions on Computer Systems 10(1), February 1992. [Kuenning et al. 1994] Kuenning, G. H., Popek, G. J., and Reiher, P. L., “An Analysis of Trace Data for Predictive File Caching in Mobile Computing,” in Proceedings of the 1994 Summer Usenix Conference, 1994. [Kumar et al. 1995] Kumar, P. and Satyanarayanan, M., “Flexible and Safe Resolution of File Conflicts,” in Proceedings of the 1995 Usenix Technical Conference, January 1995, pp. 95-106. [Law et al. 1991] Law, A. M. and Kelton, W. D. Simulation Modeling & Analysis, McGraw Hill, 1991. [Liu et al. 1994] Liu, M. L., Agrawal, D., and Abbadi, A. E., “What Price Replication?” Technical Report TRCS94-14, Computer Science Department, University of California, Santa Barbara, July 1994. [Nelson et al. 1988] Nelson, M. N., Welch, B. B., and Ousterhout, J. K., “Caching in the Sprite Network File System,” ACM Transactions on Computer System 6(1), February 1988. [Noble et al. 1994] Noble, B. D., and Satyanarayanan, M., “An Empirical Study of a Highly Available File System,” in Proceedings of the 1994 ACM Sigmetrics Conference on Measurement and Modeling of Computer Systems, Nashville, TN, May 1994. [Ousterhout et al. 1985] Ousterhout, J. K., DaCosta, H., Harrison, D., Kunze, J. A., Kupfer, M., and Thompson, J. G., “A Trace-Driven Analysis of the UNIX 4.2 BSD File System,” in Proceedings of the 10th ACM Symposium on Operating System Principles, Orcas Island, WA, December 1985.
[Page 1996] Page, T. W., “Models of Weakly Consistent Replicated Data,” unpublished manuscript, Department of Computer Science, Ohio State University, 1996. [Parker et al. 1983] Parker, D. S., Popek, G., Rudison, G., Stoughton, A., Walker, B, Walton, E., Chow, J., Edwards, D., Kiser, S., and Kline, C., “Detection of Mutual Inconsistency in Distributed Systems,” IEEE Transactions on Software Engineering, May 1983, pp. 240-247. [Popek et al. 1990] Popek, G. J., Guy, R. G., Page, T. W., and Heidemann, J. S., “Replication in Ficus Distributed File Systems,” in Proceedings of the Workshop on Management of Replicated Data, Houston, Texas, November 1990. [Popek et al. 1985] Popek, G. and Walker B., The Locus Distributed Operating System, MIT Press, 1985. [Ratner 1995] Ratner D., “Selective Replication: Fine-Grain Control of Replicated Files,” Masters Thesis. University of California, Los Angeles, 1995. [Ratner et al. 1996] Ratner, D., Popek, G. J., and Reiher, P., “The Ward Model: A Scalable Replication Architecture for Mobility,” in Proceedings of the OOPSLA’96 Workshop on Object Replication and Mobile Computing (ORMC’96), San Jose, California, October 7, 1996. [Reiher et al. 1994] Reiher, P., Heidemann, J., Ratner, D., Skinner, G., and Popek, G., “Resolving File Conflicts in the Ficus File System,” in Proceedings of USENIX Conference, pp. 183-195, June 1994. [Reiher et al. 1996] Reiher, P., Popek J., Gunter, M., Salomone, J., and Ratner, D., “Peer-to-Peer ReconciliationBased Replication for Mobile Computers,” ECCOP 1996 Second Workshop on Mobility and Replication, July, 1996. [Rosenblum et al. 1994] Rosenblum, M., Herrod, S. A., Witchel, E., and Gupta, A., “SimOS: A Fast Operating System Simulation Environment,” CSL-TR-94-631, Stanford University, 1994. [Satyanarayanan 1981] Satyanarayanan, M., “A Study of File Sizes and Functional Life-Times,” in Proceedings of the 8th ACM Symposium on Operating System Principles, Pacific Grove, CA, December 1981. [Satyanarayanan 1984] Satyanarayanan, M., “A Synthetic Driver for File System Simulations,” in Proceedings of the International Conference on Modeling Techniques and Tools for Performance Analysis, Paris, May 1984. [Satyanarayanan 1989] Satyanarayanan, M., “Coda: A Highly Available File System for a Disconnected Workstation Environment,” in Proceedings of the Second Workshop on Workstation Operating Systems, September 1989. [Tanenbaum 1996] Tanenbaum, A. S., Computer Networks Third Edition, Prentice Hall PTR, 1996. [Terry et al. 1995] Terry, D. B., Theimer, M. M., Petersen, K., Demers, A. J., Spreitzer, M. J., and Hauser, C. H., “Managing Update Conflicts in Bayou, a Weakly Connected Replicated Storage System,” in Proceedings of the 15th ACM Symposium on Operating Systems Principle, December, 1995.