Text Only Including Abstract/Text + Figs + Tables
A Framework for Evaluating Remote Diagnostics Investment Decisions for Semiconductor Equipment Suppliers
Cem Vardar, Esma S. Gel, and John Fowler Department of Industrial Engineering, Arizona State University, Tempe, AZ 85287-5906
August 2005
Corresponding author: Esma S. Gel Department of Industrial Engineering, Arizona State University, PO Box 5906, Tempe, AZ 85287-5906, Tel: (480) 965 2906, Fax: (480) 965 8692 e-mail:
[email protected]
A Framework for Evaluating Remote Diagnostics Investment Decisions for Semiconductor Equipment Suppliers Cem Vardar, Esma S. Gel, and John Fowler Department of Industrial Engineering, Arizona State University, Tempe, AZ 85287
ABSTRACT With advances in information technology, service activities for expensive equipment used in semiconductor manufacturing can be performed from a remote location. This capability is called remote diagnostics (RD). Currently, there are intense development efforts in the semiconductor industry for implementing RD in wafer fabrication facilities to reduce maintenance and capital costs and improve productivity. In this paper, we develop a queueing-location model to analyze the capacity and location problem of after sales service providers, considering the effects of RD technology. Our model optimizes the location, capacity and the type of service centers while taking congestion effects into consideration. We solve this model using a simulation optimization approach in which we use a genetic algorithm to search the solution space. We demonstrate how our methodology can be used in strategic investment planning regarding the adoption of RD technology and service center siting through a realistic case study.
1. INTRODUCTION Semiconductor wafer fabrication is one of the most complex manufacturing processes in the world. Thus, the process requires very complex and expensive equipment. Keeping the equipment in working condition is not a trivial task. Integrated circuit manufacturers spend millions of dollars on equipment maintenance each year. Despite sophisticated maintenance strategies, various types of equipment fail or degrade in performance from time to time. In these situations, outside service may be needed. This “after sales” service is often purchased in terms of service agreements from the equipment manufacturers or other service providers. The terms of these contracts include the response times, repair times, and penalties that the service provider will pay in case the requirements of the agreement are not met.
1
With recent advances in communication capabilities, it is now technologically possible to perform some levels of equipment service remotely by the service providers. That is, a service engineer can log into the computers that control a tool via the internet/intranet, etc., and perform the service on the tool without physically being where the tool is. This capability is often referred to as remote diagnostics (RD) or e-diagnostics by industry practitioners. Currently, development efforts are continuing by both service providers and integrated circuit manufacturers to make use of this technology in order to decrease equipment downtime and maintenance costs. The possible benefits of this new technology continue to be thoroughly debated by the semiconductor industry, although the emphasis of these discussions has been mostly on developing enabling information technologies, protocols, industry-wide standards, etc. While leading integrated circuit manufacturers and service providers agree that the logistical and financial benefits of RD can be substantial (Raman and Pillai, 2001, Sako et al., 2003), almost no effort has been spent on determining cost-effective strategies to implement RD technology and integrate it with the existing equipment maintenance infrastructure. Our objective in this research is to approach the use of RD in a more strategic manner by including a logistics perspective to address the problems that might be encountered in maintenance resource planning (with respect to capital, personnel and equipment), contract negotiating, maintenance policy improvement, etc. As RD technology takes its expected place in the semiconductor industry, it is expected to cause changes in current maintenance and field service practices. A mathematical capacity planning model would be a useful tool for decision makers of both service providers and integrated circuit manufacturers to evaluate the investment decision for RD technology and get ready for the resulting changes in field service systems. In this paper, we present a queueing-location model for a service provider for integrated circuit manufacturing equipment. The queueing process we are interested in is the queueing of expensive equipment, waiting for service. Using this model, we quantify the multiple tradeoffs between RD technology investments, personnel and traveling costs and service levels to minimize the total cost of a service provider subject to requirements of its current service contracts. The queueing system we consider involves modeling complexities including general service times and a finite calling population. Thus, we cannot adequately estimate the financial impact (i.e., penalties due to delays in service or repair of equipment) of different solution
2
alternatives in closed form. We deal with this complexity by employing a simulation optimization approach in which we use a genetic algorithm as the search strategy. The main contributions of our paper are (1) a model to evaluate the benefits of RD technology, (2) a simulation optimization approach to heuristically solve this model, and (3) a realistic case study that shows how industry practitioners can use the approach and interpret the results to make effective capacity and location decisions. The solution of our model will help decision makers in the semiconductor industry understand the structure of the field service support system of the industry and will provide insights about benefits of RD technology with a broader vision. The model is also expected to be helpful in decision making concerning RD investments and strategic planning for integrated circuit manufacturers, in addition to equipment manufacturers and service providers. The rest of the paper is organized as follows. In Section 2, we review the literature related to RD and field service system design. In Section 3, we present the service provider’s model and we outline our solution methodology in Section 4. We present a small but realistic case study in Section 5. Finally, we finish with conclusions and promising areas of future research on the subject.
2. LITERATURE SURVEY In this section, we review the literature related to RD. The section consists of two parts. In the first part, we review the publications that directly recognize the differences between service systems with RD and traditional field service systems. Most of these publications introduce the technology and predict potential benefits from it without any modeling effort. In the second part, we review papers that model field service systems or similar systems in a much broader sense. 2.1. Remote Diagnostics as a Vision RD is a popular subject in semiconductor industry publications. There are numerous articles in trade magazines such as Semiconductor International and Future Fab International that analyze the opportunities that RD present and obstacles in its implementation. Wohlwend (2001) presents RD as an integral part of an e-factory vision that is being developed by semiconductor industry organizations such as International SEMATECH and JAITA (Japan Electronics & Information Industry Association) to reduce overall costs and improve capabilities
3
of semiconductor manufacturing companies. Perez (2001) and Hanssmann (2001) discuss how tool monitoring by RD can both enhance equipment lifecycle management and reduce equipment maintenance costs. Bloss and Pillai (2001) and Raman and Pillai (2002) also identify RD as a great opportunity for e-manufacturing and point out the obstacles that needs to be overcome in implementing it. Recently, Sako et al. (2003) present some realized benefits of RD technology such as reduced mean time to repair and reduced maintenance management costs. Overall, there is a consensus among industry practioners that RD technology will be a useful tool in improving current maintenance strategies. Lee (1998) is the first refereed journal article that mentions RD as an option in field service activities. The author refers to RD and maintenance as “teleservice engineering,” and presents several research opportunities in information technology on issues such as diagnostic system standardization, techniques for collaborative maintenance and diagnostics, self maintenance and availability. Agnihotri et al. (2002) present a conceptual model for assessing the role and influence of technology in creating an effective field service organization. The authors claim that using available technologies, equal emphasis should be given to customer relations, having welltrained and motivated personnel and the actual encounter between the customer and the service provider. In addition to reduction in maintenance costs, RD can enhance equipment efficiency by continuously monitoring important equipment and using the data generated in making maintenance decisions. Sloan and Shantikumar (2002) present a model that uses in-line equipment condition and yield information for optimizing maintenance scheduling and dispatching of lots. They assume that the equipment condition and yield data is monitored continuously. Pool (2001) reports a similar continuous remote monitoring practice that General Electric uses to improve aircraft maintenance. In this system, several performance indicators of aircraft are monitored during flight. If an indicator is out of control limits and service is required, arrangements for the maintenance (i.e., service engineers, spare parts) are made before the flight arrives so that the next flight of the aircraft is not delayed. These examples are just some of the ways service providers can use the data obtained through RD monitoring capabilities to make better service decisions.
4
2.2. Field Service System Design Field service systems are designed to meet the service needs of equipment or products after they are sold. Hence, service is usually performed at the customer’s site. There are two main problems intertwined in the design of field service systems. The first problem involves locating the regional service sites in ‘good’ locations, while the second problem considers capacity planning in these regional sites. Both problems have been studied extensively in the literature. In maintenance and service capacity planning, researchers have developed models for analyzing and/or optimizing the maintenance crew capacity, spare parts inventory, number of spare machines, etc., to minimize the total cost of the system. In this section, we first review studies that deal only with the capacity planning decision and after that we give examples of studies that combine both problems. Most of the studies in the second group come from a different application area, which is location and capacity planning of emergency service systems. Waller (1994) is one of the first papers that model field service systems as a closed queueing network for staffing decisions. Spare parts management is also included to a certain extent in the model. In this model, when a tool goes down and needs service, it enters a queue for a field engineer. After it is serviced, with probability p it returns to the up state and with probability (1-p) it joins a different queue, which models waiting for a spare part. After a random amount of time in the spare parts queue, it returns to the field engineer’s queue. The author states that each spare parts inventory policy results in a different probability, p. Although this paper is a good modeling paper, it does not attempt to optimize the staffing levels or the inventory policy for spare parts. Papadopoulos (1996) extended Waller (1994) by considering multiple customer classes with different priorities and implementing the methodology on a real life case study. To solve for the average waiting time of customers, the author used priority mean value analysis (ShalevOren et al.,1984) and showed that the solution methodology was efficient and produced more realistic results than the one presented in Waller (1994). For demonstration, the paper presents a real life dataset obtained from an after sales service department of a computer manufacturer, and discusses how accurately the results from both models replicate real life data. The two papers summarized above analyze the problem from the point of view of the service provider. Kennedy (1993) analyzed the service problem from the point of view of a company that purchases maintenance services. For some of the maintenance service needs, the
5
company has the option of either using in-house personnel or outsourcing it from a service provider. The author constructed a linear programming model to decide which types and what percentage of service will be provided in-house versus outside (by a contractor) so that total costs are minimized. The model includes constraints on the available man-hours for each type of service personnel. In the second part of the paper, the author extends this model to incorporate a fixed cost for performing in-house maintenance and learning effects for the in-house maintenance staff. These extensions produce a nonlinear integer model. No real life applications of the problem or solution methodology were mentioned in the paper. Another thread in the field service literature is optimizing the capacity of an in-house maintenance team and number of stand-by units so that the total cost of maintenance staff, cost of owning the stand-by units and cost of interruptions in the process is minimized. Catuneanu et al. (1990), Lin et al. (1994), Zeng and Zhang (1997), Lin et al. (2000), and Lin et al. (2001) are examples that model these kinds of systems. They differ from each other by various assumptions such as the modeling of the service system, usage of cold and warm stand-by units, and choice of solution methodology according to the resulting model. The basic modeling methodology used in all these papers is similar. They model the system by using a closed queueing network but their solution methods differ depending on the structure of the system modeled. They either derive closed form expressions for the system performance and use calculus methods, or use techniques like enumeration, genetic algorithms, and simulated annealing to optimize a system performance measure. Jayaraman and Srivastava (1995) is a good example that considers both the siting of the service centers and the capacity to be allocated at each service center. The authors study a generic system with multiple facilities and multiple types of equipment. Their model seeks to locate a given number of facilities in a network and allocation of different levels of equipment to these facilities such that the expected coverage of demand is maximized. They recognize the fact that due to the random demand for service, even when a site is “covered,” equipment needed for the service may not be available at all times. They model this unavailability by using a probability of service equipment being available and assume that this probability is the same for all the equipment at all the sites, which may not be a realistic assumption, since this probability is expected to be lower for service sites that cover more sites than other service sites. The resulting model is a mixed integer programming (MIP) model. They solve 30 node problems
6
using an off-the-shelf MIP solver. They present extensive results from 30 node problem instances and analyze the results generated by the MIP. We have not come across other significant studies that model field service systems with both capacity and location decisions per se, but there are numerous studies in siting and capacity planning of emergency vehicle systems such as ambulance services or firefighting services. Brotcorne et al. (2003) provides an excellent review on the subject. In this paper, the authors classify the research in this field into two main classes. 1) Deterministic models: These are mainly set covering models in which either covered demand is maximized with limited capacity, or the capacity needed is minimized, subject to all demand being covered. These models do not consider the congestion effects in service sites. 2) Stochastic static models: In these models, congestion caused by queueing effects of stochastic arrivals and service times in the service sites are represented explicitly. In the earlier studies, congestion is modeled mainly by limiting the workload at service sites either by constraints or by a penalty function in the objective function. In addition to these static models, dynamic models that relocate ambulances from site to site according to system status are also reviewed in Brotcorne et al. (2003). For a more general review of research that belongs to the first category above, refer to Owen and Daskin (1998) which reviews the strategic facility location modeling literature. Since congestion effects need to be explicitly modeled for the service system that we consider in this paper, studies that belong to the second category are more relevant to our work. Desrochers et al. (1995) is a good example in which congestion is modeled by a nonlinear penalty function in the objective function. For a certain form of penalty function, the authors prove that the objective function is convex, and solve the problem using a column generation technique. Marianov and ReVelle (1995) is the first study to incorporate a queueing model into a set covering problem. The most important contribution of this paper to existing models is that the time (or distance) between the service site and demand point is modeled as a random variable. The earlier models were not capable of accounting for stochasticity in distance or travel time. Marianov and Serra (2001) extend Marianov and ReVelle (1995) by modeling a hierarchical service structure.
7
Although there are significant similarities between emergency service systems and field service systems, the size of the population from which demand occurs is quite different. In emergency system models, assuming that the demand arrivals come from an infinite calling population is reasonable since the demand comes from a neighborhood or a town which has thousands of residents or houses. However, for a field service system (and particularly for semiconductor manufacturing facilities), an infinite calling population is not a realistic assumption. This type of a service system requires a closed queueing network, which is much harder to deal with than open queueing networks of emergency service systems. Kochel et al. (2003), which investigates optimal capacity decisions for a car rental company, is a good example where an infinite calling population assumption is not reasonable. The capacity decisions considered in this system include how many vehicles to own, how many vehicles to allocate to different branches and what kind of relocation policy should be used to relocate the empty vehicles between branches. In the first part of the paper the authors simplify the decision alternatives by ignoring the relocation option. This reduces the model to a product form queueing network which can be analyzed with mean value analysis and optimized with a greedy algorithm. When relocation of vehicles is allowed in the network, the structure of the queueing network is corrupted and it is no longer a product form queueing network. At this point the authors choose to use simulation optimization to find the optimal relocation policy parameters and optimal vehicle fleet size. They use a simulation model as a black box to calculate the performance of different solution alternatives and a genetic algorithm to search through the search space. In this paper, we develop a model for capacity/location planning of field service system of an original equipment manufacturer for the semiconductor industry. In our model, the maintenance system is modeled as a closed queueing network and traveling of the service engineers to customer’s site is modeled explicitly. Currently, no such detailed documented method exists for field service capacity and location planning in semiconductor manufacturing industry. We will use an evolutionary heuristic and simulation optimization methods to solve the resulting capacitated location problem. We also demonstrate how the model can be utilized for strategic decision support through a realistic case study.
8
3. SERVICE PROVIDER’S PROBLEM We call a company that sells maintenance service contracts to integrated circuit manufacturers a service provider. Service providers are usually also the original equipment manufacturers that design and manufacture high technology equipment used in semiconductor manufacturing. Original equipment manufacturers typically sell service contracts for the equipment they manufacture. The terms of these contracts include the required response times, repair times, and penalties that service provider will pay when the requirements in the agreement are not met. We consider the problem of a service provider who wants to design the minimum total cost field service system that satisfies the requirements of its contracts. With the RD technology, service providers have the option of investing in RD technology and opening RD enabled service centers instead of traditional service centers. By having RD enabled service centers a service provider can resolve some types of service requests without the need to travel to the site of the customer requesting service. Hence, a service provider needs to make decisions on the following strategic and tactical issues: 1. What type of regional service centers (remote or traditional) should be opened, 2. Where to open regional service centers, 3. How to assign customers to regional service centers, 4. How many service engineers of different levels to employ at each regional service center. 3.1. Assumptions of the Model •
The service provider’s field service system is a network consisting of different types of personnel. We further assume that each service request is handled through a prespecified protocol, and the routing probabilities through the field service network are known.
•
The service provider can invest in RD technology and open RD-enabled regional service centers. With this investment, the service provider gains the capability of servicing a proportion of incoming service requests remotely without the need to travel to the customer site, which results in shorter service times. For traditional service centers, we assume that mean service time depends on the distance between the customer and the service center. In addition, we assume that a travel cost is incurred for each trip to the customer’s site.
9
•
There are a finite number of service contracts that the service provider needs to service, resulting in a finite calling population of tools requiring service. For each customer location there is a contract for all the tools in that location.
•
The service provider pays a penalty to the customer based on the average number of down tools during a year in a contract.
•
Each service contract is assigned to a service center and there is no state dependent cooperation between service centers.
•
Each piece of equipment has an exponential time to failure distribution and repair times follow a triangular distribution.
•
Service engineers can only be employed at service centers that are open and in operation (i.e., costs of opening and maintaining the service center must be incurred.)
3.2. The mathematical programming model In this section, a general formulation for the service provider’s field service system design problem is presented. The objective of the model is to minimize the costs of establishing and operating a field service system while all the requirements of the service contracts are met. The following summarize the notation used in the model. Sets I: J: L: M:
Set of service contracts Set of possible service center locations Set of service engineer levels Set of service center types {1: traditional; 2: RD-enabled}
Model Parameters T : fixed cost of technology investment for RD, discounted to per year cost assuming a 5year lifetime Fjm : fixed cost of opening a service center at site j of type m, discounted to per year cost assuming a 5-year lifetime, j ∈ J, m ∈ M PCjlm : yearly cost of employing a service engineer of level l at site j at a service center of type m, j ∈ J, l ∈ L, m ∈ M DCi : yearly downtime penalty paid for each down tool in contract i, i ∈ I TCij : cost for a service engineer to travel from service center j to the location of contract i, i ∈ I Qi : number of tools in contract i, i ∈ I Rijm : vector of queueing network parameters for a contract i getting service from a service center of type m at site j, such as λi : rate of request for service of contract i, i ∈ I µijm : average repair time for a contract i from service center j of type m, j ∈ J, i ∈ I, m∈ M pil1l2 : transfer probabilities for contract i in service network from l1 to l2, i ∈ I, l1, l2 ∈ L 10
P
: proportion of service requests that can be serviced remotely from a remote diagnostics capable service center
Decision variables y := 1 if the investment for RD technology is made, and 0 otherwise. xjm := 1 if a service center is opened at site j of type m, and 0 otherwise for all j ∈ J, m ∈ M, zijm := 1 if contract i is assigned to service center j that is of type m, 0 otherwise, for all i ∈ I, j ∈ J, m ∈ M, sejlm := number of service engineers employed in service center j at level l at a service center of type m, j ∈ J, l ∈ L, m ∈ M, The problem of the service provider can then be written as follows. Min
Ty+
∑∑
Fjm xjm +
j∈J m∈M
+
∑
∑∑ ∑
PCjlm sejlm
j∈J l∈L m∈M
DCi fi (y, x, z, se, Q, R, P)
i∈I
+
∑∑
TCij gij (y, x, z, se, Q, R, P)
(1)
i∈I j∈J
subject to K xjm ≥ sejlm
for all j ∈ J, l ∈ L, and m ∈ M
(2)
y ≥ xj2
for all j ∈ J
(3)
zijm ≤ x jm
for all i ∈ I , j ∈ J and m ∈ M
(4)
for all i ∈ I
(5)
∑∑ z
m∈M j∈J
ijm
=1
seilm integer, y, xjm , zijm ∈ {0, 1},
for all i ∈ I, j ∈ J, m ∈ M , l ∈ L
The objective function (1) consists of a sum of five terms and represents total annual cost of the service provider. The first term is the cost of investing in RD technology and the second term is the total fixed costs incurred for opening service centers. The third term in the objective function is the total personnel costs and the fourth term is the total penalty cost paid for down tools. Function fi (.) represents the average number of down tools in contract i, and DCi is the annual penalty cost paid for each down tool in contract i. The fifth term is the total traveling costs incurred by service engineers while traveling to customer’s location for service. Function gij(.) represents the average number of total round trips per year made from service center j to the location of contract i.
11
The constraints of the model closely resemble those in traditional location models. Constraint set (2) ensures that no service engineer is employed at a service center that is not open, where K represents a big enough number to ensure that the constraint works. Constraint set (3) ensures that RD enabled service centers cannot be opened without incurring investment cost for RD. Constraint set (4) ensures that a contact cannot be assigned to a site unless that site is opened. Finally, constraint set (5) ensures that each contact is assigned to exactly one service center. Although this model represents the problem of a service provider sufficiently, note that this is not a regular mixed integer programming model that can be solved by a general integer programming solver. This is due to the fact that, in the fourth and fifth terms in the objective function (1) we embed a queueing system into the model to take congestion effects into account. No closed form representations of functions fi(.) and gij(.) exist. However, functions fi (.) and gij (.) can be estimated by using a simulation model developed for this field service system under a given solution alternative. There are numerous location models in the literature that consider congestion effects along with the location of facilities and allocation of demand to these facilities decisions. For a comprehensive review of location models considering congestion effects see Section 4.1 of Owen and Daskin (1998). Since most facility location allocation problems are NP-complete, considering congestion effects while making location decisions results in either intractable or oversimplified models. In the above presented form, our model cannot be solved with traditional mathematical solution techniques either. In the next section, we present our solution methodology which deals with this problem.
4. SOLUTION METHODOLOGY Since some terms in the objective function of our model cannot be represented adequately by closed form expressions, we cannot solve the problem with traditional mathematical programming techniques. To solve this model, we use a simulation optimization framework, similar to the approach used in Kochel et al. (2003), where the performance measures fi (.) and gij(.) are evaluated by a simulation model and a genetic algorithm is used to search the solution space.
12
Simulation modeling has traditionally been used for descriptive modeling of complex stochastic systems. Recently, researchers have begun to study how this technique could also be used as a prescriptive modeling technique. For a tutorial on simulation optimization, see section 12.6 in Law and Kelton (2000). Fu (1994) and more recently Fu (2001) provide excellent reviews on simulation optimization research. The early research in the field of simulation optimization was focused on methods such as stochastic approximation and gradient-based approaches. Although these methods work well with continuous decisions variables, they get more difficult to solve and inefficient when dealing with binary and integer variables. For these types of problems, researchers have started using metaheuristics such as genetic algorithms and simulated annealing, which are commonly used in the field of combinatorial optimization. The main advantage of using metaheuristics as the search strategy in simulation optimization is their ability to function reasonably in noisy environments. This enables straightforward application of these methods to simulation optimization by using average of a fixed number of simulation replications as the deterministic evaluation of solutions. This approach works well particularly when the variability of the simulation outputs between replications is fairly low. Ahmed et al. (1997), Paul and Chanev (1998), and Kochel et al. (2003) apply these types of techniques to different types of simulation optimization problems and report success. However, if the variability of the simulation outputs between replications is not low, this straightforward approach of making a fixed number of simulation replications fails to adequately guide the heuristic search. Studies like Ahmed and Alkhamis (2002), Boesel et al. (2003a, 2003b) and Rosen and Harmonosky (2005) develop methodologies to use in heuristics for simulation optimization while taking advantage of the special structures of random outputs of simulation runs, which leads to making a different number of replications for different solutions to improve solution times and quality. These techniques outperform the more straightforward implementations in terms of solution speed and quality when the variability of output statistics between replications is large. In this study, we observed that for smaller pilot problems the variability of output statistics between different replications is not large enough to influence the performance of the evolutionary algorithm. Thus, we have used the straightforward approach of making a fixed number of replications for each alternative during the GA search in the case study presented in
13
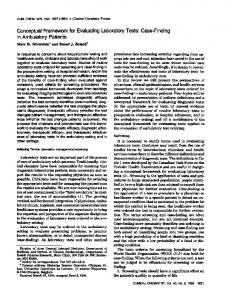
the next section. However, we use Rinott’s two stage selection procedure (Rinott, 1978) as the last step of our algorithm to ensure that we pick the best solution with a confidence level and an indifference zone guarantee. Our general solution framework is shown in Figure 1. We start by generating a set of random alternatives and evaluating these alternatives through the simulation model. This set makes up the first generation of the genetic algorithm (GA). The GA generates new solutions using standard mutation and crossover techniques and evaluates the objective functions for these solutions with the simulation model. Initial alternative generator
Evaluate solutions
Generate new solutions Simulation model of the field service system
Evaluate new solutions
Solution evaluator
Make Selection
Report 10 best solutions
GA Solver
Local neighborhood optimization by enumeration
Rinott’s procedure
Figure 1. General solution framework
14
Report best solution
In solving the case study presented in the next section, we use a population size of 30, and at each iteration, we generate 10 new solutions with mutation and 20 new solutions with crossover using randomly selected solutions from the current generation and generate a candidate set consisting of 60 solutions (i.e., 30 from current generation and 30 from crossover and mutation) that will go through the selection operation. We copy the best solution from the candidate set into the next generation and use tournament selection as our selection mechanism to select the remaining members of the next generation from the candidate set. We make a total of 100 iterations and employed elitism by never eliminating the observed best solution in a generation between the iterations. We have set these parameters after pilot experimentation with the model to increase the convergence rate. Our chromosome structure consists of the following parts. •
A single binary field for representing if RD investment is made or not (y).
•
A binary field for each possible site representing if that site is open or closed (xjm).
•
A numeric field for each contract representing the assignment between the contracts and service centers (in place of zijm).
•
A numeric field for each level of service engineer at each possible site (sejlm). For example, the structure of a sample chromosome for a problem instance with 7
contracts, 4 possible sites, and with 2 levels of service engineer (this is also the configuration in the case study presented in the next section) the GA can be seen in Table 1.
15
Table 1. Chromosome structure
Chromosome Fields RD Investment made of not? Possible site open or not?
Assignment of contracts
site 1 Number of SEs
site 2 site 3 site 4
site 1 site 2 site 3 site 4 cont. 1 cont. 2 cont. 3 cont. 4 cont. 5 cont. 6 cont. 7 level1 level2 level1 level2 level1 level2 level1 level2
Chromosome value 1 1 0 1 0 1 3 1 1 3 1 3 2 1 3 2 1 2 3 4
Due to the assignment variables, infeasible solutions can be generated after crossover or mutation. For example, after a crossover, a contract may be assigned to a service center which is not open. In such cases, the algorithm assigns the contract with the infeasible assignment to one of the open service centers randomly. After the GA is run, it reports out the 10 best solutions found during the entire GA run. The algorithm performs a local enumerative neighborhood search around these 10 solutions to further improve objective values. In the local neighborhood search, we keep the location, type and capacity constant and try all possible contract assignments. This step was added after we have observed that GA’s mutations and crossovers were often not successful in finding the best assignments. We keep the objective function value evaluations of all the solutions that the algorithm visits during the GA and local search at the last step in a list. After the search phase is over we take 30 observed best solutions among all the solutions visited and apply Rinott’s two stage procedure to guarantee a confidence level that the solution we pick is the best one among the 30
16
observed best. The efficiency and solution quality of this last step can be improved by using more advanced methods such as those in Boesel et al. (2003b).
5. CASE STUDY FROM THE SEMICONDUCTOR INDUSTRY In this section, we analyze the situation for a hypothetical service provider that sells manufacturing equipment and service contracts for those tools to wafer fabrication facilities (fabs). This case study was co-developed by industry experts to make it representative of the real service providers in the semiconductor supplier industry. The purpose of the case study is to demonstrate how the model developed in this paper can be used to support strategic decision making on field service systems and RD technology. The field service systems for fab tools usually consist of two levels of support; onsite and offsite. Onsite service is performed by personnel dedicated to a fab. They are available to that specific fab at all times, and do not respond to service requests from other customers of the service provider. Offsite personnel work in a regional service center and respond to service requests from multiple customers or fabs (i.e., different contracts in our model). In general, there are two types of service personnel, differing by the type of problems they handle: field service technicians (FST) and application engineers (AE). FSTs generally handle requests that are due to mechanical problems and AEs are generally responsible for more complex problems, such as electronic or software problems. All personnel who perform onsite and offsite service are assumed to be employed by the service provider. When a tool requires service, an onsite FST initially responds to the service request and diagnoses the problem. If the problem can be resolved by a FST, the FST proceeds to repair the tool. Otherwise, he forwards the problem to a fellow FST. If the FST diagnoses the problem as an AE problem, the service request is forwarded to an onsite AE. When an onsite FST or AE cannot resolve a service request, they elevate the service request to be responded by the regional service center assigned to this specific fab. The same structure of FSTs and AEs are also present in regional service centers. The queueing network structure used in the case study can be seen in Figure 2. In Figure 2, the box on the left represents the fab and the one on the right represents the regional service center assigned to this fab. The descriptions of the nodes in the figure are given below.
17
•
UP: This node represents a group of tools that the service provider is responsible for providing service (i.e., a contract)
•
FSTf: This node represents onsite FSTs
•
AEf : This node represents onsite AEs
•
FSTr: This node represents FSTs in the regional service center assigned to the fab
•
AEr: This node represents AEs in the regional service center assigned to the fab
The arcs represent the flow of the service requests between the nodes and the values on the arcs give the probability of a service request taking that path after it leaves a node. For example, the flow leaving the ‘UP’ node represents service request generation (i.e., a tool is down), the flow between FSTs and AEs represent forwarding of the service request between different types of personnel and the flow going back into the ‘UP’ node represents a resolved service request (i.e., the tool is up again). Note that multiple fabs can be assigned to the same service center.
.9
.80
.1 .85
1
UP
FSTf
FSTf
.15
FSTr
.1
.1
AEf
.85
AEr .15
1
FAB
Service center
Figure 2. The queueing network and routing probabilities
The service provider in our case study has contracts with seven fabs with ten tools at each fab, as in Figure 3. The service provider has four candidate sites for regional service centers in different geographies. In Figure 3, the candidate service center sites are in the middle and the 7 contracted fabs are on the top and bottom of the figure. Arcs between fabs and service centers represent the possible assignments of fabs to the service centers. The list of the fab locations,
18
mean times to failure per tool and the number of tools data can be seen in Table 2. We assume an exponential distribution for the time to failure, although any other distribution can be incorporated.
.8
.8
.8 .85
1
.85
1
FST
UP
.1 AEf
AEf
FAB2
FAB2
FAB2
FSTr
Arizona
FSTr
.1
f
FST
AEr
f
UP
FST f
.15 .85
FAB2 Texas
AEf
UP
FST
.15
FAB2
Germany
AEf
FST f
.1
f
.85
.85
1
FST f
.1
Taiwan
AEr
Service provider’s regional locations
.8 .85
1
FST f
.1
.1
Germany
.8 .85
1
FSTr
.1
California
AEr
FST
AEf
.15 .85
.8 .85
.1
f
.15
.8
UP
.1
FST
.85
AEr
1
UP
.85
FSTr
Fabs
f
FST f
f
.1
FST
f
FST
.15
.85
1
FST
f
UP
Oregon
California
Arizona
UP
FST
.1
Fabs
f
AEf
.15 .85
.15
AEf
.85
FAB2 Taiwan
FAB2 Japan
Figure 3. Basic structure of the case study Table 2. List of fab locations and tool failure data Fab Location Arizona California Oregon Texas Germany Japan Taiwan
Mean Time to Fail (hr) 40 40 40 40 40 40 40
Number of tools 10 10 10 10 10 10 10
The mean service times for onsite service is 0.5 hours for FST’s diagnosis, 2.5 hours for FST service and 4.8 hours for AE service for all fabs. The average service time of offsite service depends on the proximity of the assigned service center to the customer site due to the need of travel of a service engineer. Mean service time data for offsite service is provided in Table 3. Note that the mean service time for remote service does not depend on the location of the service center and the fab. We assume a symmetrical triangular distribution for both onsite and offsite
19
service times with +/- 30% offset from the mean for the minimum and maximum values of the triangular distribution. Table 3. Mean service time for offsite service MEAN SERVICE TIMES (in hours )
Level of service
Fab Location (i) Arizona California Oregon FST service time Texas (l =0) Germany Japan Taiwan Arizona California Oregon AE service time Texas (l=1) Germany Japan Taiwan
If service engineer has to travel (m =0) Service Center location (j ) Arizona California Taiwan Germany 6 12 24 18 12 6 24 18 12 12 24 18 12 12 24 18 18 18 18 6 24 24 9 18 24 24 6 18 8 14 26 20 14 8 26 20 14 14 26 20 14 14 26 20 20 20 20 8 26 26 11 20 26 26 8 20
If service performed remotely (m =1) Service Center location (j ) Arizona California Taiwan Germany 3 3 3 3 3 3 3 3 3 3 3 3 3 3 3 3 3 3 3 3 3 3 3 3 3 3 3 3 4.8 4.8 4.8 4.8 4.8 4.8 4.8 4.8 4.8 4.8 4.8 4.8 4.8 4.8 4.8 4.8 4.8 4.8 4.8 4.8 4.8 4.8 4.8 4.8 4.8 4.8 4.8 4.8
Table 4 shows the travel cost incurred with each round trip of a service engineer from service center to the customer and back. The annual personnel cost is $50,000 and $70,000 per year for FSTs and AEs, respectively. The yearly fixed site opening and operating cost is $100,000 for all of the four possible sites. The penalty cost for down tools is $150,000 per tool per year (i.e., if on the average a tool is down 20% of the time during a year service provider pays a penalty cost of (20%)($150,000)=$30,000). Table 4. Travel Costs TRAVEL COSTS Fab Location Arizona California Oregon Texas Germany Japan Taiwan
Service center location (j ) Arizona California Taiwan Germany $0 $200 $1,000 $600 $300 $0 $1,000 $600 $300 $200 $1,000 $600 $300 $200 $1,000 $600 $600 $1,000 $600 $0 $1,000 $1,000 $300 $600 $1,000 $1,000 $200 $600
The only remaining cost parameter that needs to be included is the fixed cost of RD technology, T, which enables the service provider to use RD technology to handle service requests remotely. This cost measure highly depends on the level of RD technology (which reflects itself through P, the probability of remote service) and is not easy to estimate. We 20
assume that the higher the investment made for RD, the higher the probability of resolving a service request remotely. For this reason, we fixed this cost to zero, parameterized P and solved the problem instance multiple times with different values of P, starting with P = 0 up to P = 1 with a step size of 0.1. Note that, P = 0 represents the extreme case in which none of the service requests can be handled remotely. Similarly, P = 1 represents the extreme case where all service requests can be handled remotely. P values between 0 and 1 represent different levels of RD technology between the two extremes. For example, when we solved the problem for P = 0.5 case, in the best solution found by the algorithm, service centers at California and Taiwan were opened with remote capability and a total of 6 offsite and 19 onsite service engineers were employed. Arizona, California, Oregon and Texas were assigned to the service center at California and the remaining fabs were assigned to the service center in Taiwan. The total cost for this scenario came out to be $3,450K. In a similar fashion, we solved the problem for 11 different P values. Since we have fixed the RD technology investment cost to zero in all cases, the resulting objective function values of different cases are comparable. Note that as P increases, the objective function value is bound to decrease since there is no added RD investment cost and since with RD, some portion of the service requests will be resolved more quickly and without any travel cost. We take P = 0 case as our base case, and the cost difference between the base case and the P > 0 cases give the value of RD technology investment for that particular RD level. For example, the expected total cost for P = 0 and P = 0.5 is $3.638K and $3.245K respectively. The cost difference between two cases is the maximum amount the service provider should be willing to pay for the RD technology capability at P = 0.5 level. Figure 4 shows the plot of the total cost for the best solutions found by the algorithm and the value of the RD technology for each instance of P. Observe that the investment justified in RD technology increases linearly at the beginning and increases more steeply for values of P > 0.7.
21
In v e s tm e n t ju s tifie d a n d to ta l c o s t fo r d iffe r e n t le v e ls o f R D te c h n o lo g y 4000
1200
Iinvestment (in $1,000
3000 800
2500
600
2000 1500
400
1000 200
Total Cost (in $1,000
3500
1000
500
0
0 0
0 .1
0 .2
0 .3
0 .4
0 .5
0 .6
0 .7
0 .8
0 .9
1
P (le v e l o f R D )
R D inve s tm e nt jus tifie d
To ta l C o s t
Figure 4: Total cost and yearly investment justified in RD technology
To understand the steep increase in the value of RD technology that we observe in Figure 4, we present a breakdown of the total cost (see Equation (1)) into its five components in Figure 5. The terms that the different cost components correspond to in the objective function are given in the legend of the graph. We also separated personnel costs (term 3 in objective function) into onsite and offsite personnel costs. Observe that, as the level of RD increases (i.e., an RD technology with higher P), the traveling and service penalty costs decrease in general, whereas site opening and offsite service engineer costs stay the same until P = 0.7 and then decrease. At this point, the level of RD technology causes the optimal solution to change from opening two service centers to one service center and from five offsite service engineers to four offsite service engineers. Also, observe that this causes a slight increase in travel costs due to the fact that service engineers have to travel to farther fabs from only one location worldwide. This structural change in the best solution causes the value of RD to increase more steeply.
22
Different Components of Costs 1600 cost (in $1,000)
1400
Site Opening (term2)
1200
OffsIte SE (term3)
1000 800
Onsite SE (term3)
600
Penalty (term4)
400 200
Traveling (term5)
0 0
0.1 0.2 0.3
0.4 0.5 0.6
0.7 0.8 0.9
1
P (level of remote diagnostics)
Figure 5. Breakdown of Total Cost
In the scenario described above we assumed that there is a requirement for at least one onsite FST and one onsite AE, which is the state of the art in current wafer fabs. However, RD technology might enable service providers to change the current structure of their systems. One possible scenario is relaxing the constraint of having at least one onsite AE in the fab. This scenario makes sense with RD technology since AEs mainly deal with electronic and software problems, which are easier to handle remotely. To analyze this case we ran our model without the constraint of having at least one onsite AE in the fab and compared the total system cost of two different scenarios. A plot of this comparison can be seen Figure 6.
Total Cost compared- Curent vs No AE in fab required case 3800
Total Costs (in $1,000)
3600 3400 3200 3000 2800 2600 2400 2200 2000 0
0.1
0.2
0.3
0.4
0.5
0.6
0.7
0.8
0.9
1
P (level of RD)
Figure 6: Current vs. No onsite AE required case compared
23
When the RD level is low (P < 0.5) the relaxation in the assumption does not provide any cost savings. As the effectiveness of RD (P) increases the system starts to enjoy cost savings due to the pooling of the service requests at the service centers instead of having individual onsite AEs. This type of scenario analysis can help decision makers in planning strategic investments in RD technology and shape the direction of the current research and development efforts towards the most promising directions.
6. CONCLUSIONS AND FUTURE RESEARCH In this paper, we presented a field service system optimization model specifically developed for analyzing the effects of RD technology in the semiconductor manufacturing industry. Our model optimizes the location, type and capacity of the regional field service centers to minimize the total personnel, facility location, RD technology investment, response time penalties and traveling costs. The mathematical model presented cannot be solved using traditional solution techniques due to the lack of closed form expressions for the relevant performance measures of the system. In order to address this problem, we developed a simulation model for evaluating the values of these performance measures and used these evaluations in an evolutionary heuristic for optimization. Our solution approach provides satisfactory solutions in a reasonable time for small and medium sized problems. In addition, we also presented a realistic case study from the industry to demonstrate how our model can be used to evaluate strategic investment decisions about RD technology, site selection and capacity investments. This type of analysis can greatly assist service providers in making strategic decisions about their service network and evaluating potential investments in RD technology. In addition, integrated circuit manufacturers can utilize this model to estimate the expected number of up tools in a wafer fabrication facility which can be used in negotiating service agreements and strategic capacity planning. The solution approach used in this study can lead to fairly long run times. For example the solution of each instance in the case study took 4-6 hours on a Pentium –M 1.6Ghz computer with 480MB of RAM. For solving larger models and to enable more extensive what if analysis, we are planning to improve the solution procedure in two aspects to speed up the algorithm. The
24
first one is to improve the selection mechanism used by the genetic algorithm by considering the variability of statistics between different replications of the simulation. The second approach that is worthwhile to study is using crude analytical approximations or short simulation runs to preevaluate each solution alternative and run the full, detailed simulation model for only the more promising alternatives. With these improvements, we expect that large sized problems can be solved efficiently with our solution procedures. ACKNOWLEDGEMENTS Authors would like to thank Devadas Pillai and Anant Raman from Intel Corporation for their help in understanding remote diagnostics technology and building the case study.
REFERENCES Agnihotri, S., Sivasubramaniam, N., Simmons, D., 2002. Leveraging technology to improve field service, International Journal of Service Industry Management 13 (1) 47-68. Ahmed M. A., Alkhamis, T. M., Hasan, M.,1997. Optimizing discrete stochastic systems using simulated annealing and simulation, Computers and Industrial Engineering 32 (4) 823-836. Ahmed M. A., Alkhamis, T. M., 2002. Simulation-based optimization using simulated annealing with ranking and selection, Computers and Operations Research 29 387-402. Bloss, D., Pillai, D., 2001, E Manufacturing opportunities in semiconductor manufacturing, Semiconductor International (7) 9-12. Boesel, J., Nelson. B.L., Ishii, N., 2003a. A framework for simulation optimization, IIE Transactions 35 221-235. Boesel, J., Nelson. B.L., Kim, S.H., 2003b. Using ranking and selection to ‘clean-up’ after simulation optimization, Operations Research 51 814-825. Brotcorne, L., Laporte, G., Semet, F., 2003. Ambulance location and relocation problems, European Journal of Operational Research 147 451-463. Catuneanu, V.M., Moldovan, M.C., Popentiu, F., Albeanu, G., 1990. Maintenance philosophy using queueing multilevel stochastic service system, Microelectronic and Reliability 30 (5) 897901. Desrochers, M., Marcotte, P., 1995. The congested facility location problem, Location Science 3 (1) 9-23.
25
Fu, M.C., 1994. Optimization via simulation: A review, Annals of Operations Research 53 199247. Fu, M.C., 2001. Optimization for simulation: Theory and practice. INFORMS Journal on Computing 14 (3) 192-215. Hanssmann, M., 2001. E-diagnostics: A winning strategy, Semiconductor Magazine 2 (11) 1922. Jayaraman V., Srivastava, R., 1995. A service logistics model for simultaneous siting of facilities and multiple levels of equipment, Computers and Operations Research 22 (2) 191-204. Kennedy, W.J., 1993. Modeling in-house vs. contract maintenance, with fixed costs and learning effects, International Journal of Production Economics 32 277-283. Kochel, P., Kunze, S., Nielander, U., 2003. Optimal control of a distributed service system with moving resources: Application to the fleet sizing allocation problem, International Journal of Production Economics 81-82 443-459. Law. A.M. Kelton, W. D. 2000. Simulation modeling and analysis 3rd edition. McGraw-Hill, New York. Lee, J., 1998. Teleservice engineering in manufacturing: challenges and opportunities, International Journal of Machine Tools and Manufacture 38 901-910. Lin, C.,Ding, J.R., Yeh, J.M., 2001. A closed queueing maintenance network for automated manufacturing systems, Journal of the Operational Research Society 52 1121-1129. Lin, C., Madu. C.N., Chien, T.W., Kuei, C.H., 1994. Queueing models for optimizing system availability of a flexible manufacturing system, Journal of the Operational Research Society 45 (10), 1141-1155. Lin, C., Yeh, J.M., Ding, J.R, 2000. A genetic algorithm for solving a maintenance model in a FMS, International Journal of Systems Science 31 (4) 449-456. Marianov, V., ReVelle,C., 1995. The queueing Maximal Availability Location Problem: A model for siting of emergency vehicles, European Journal of Operational Research 93 110-120 Marianov, V., Serra, D., 2001. Hierarchical location-allocation models for congested systems, European Journal of Operational Research 135 195-208. Owen S. H., Daskin, M.S., 1998. Strategic facility location: A Review, European Journal of Operational Research 111 423-447. Paul, R.J., Chanev, T.S., 1998. Simulation optimization using a genetic algorithm, Simulation Practice and Theory 6 601-611.
26
Papadopoulos, H., 1996. A field service support system using a queueing network model and the priority MVA algorithm, Omega, International Journal of Management Science 24 (2) 195-203. Perez, S., 2001. Leveraging E-Commerce opportunities to enhance equipment lifecycle management, Future-Fab International (11) 32-37. Pool, R., 2001. If It Ain't Broke, Fix It, Technology Review, September 19-26. Raman, A., Pillai, D., 2002. E-Diagnostics: A secure and cost effective method to increase factory equipment productivity, Proc. of Int. Conf. on Modeling and Analysis of Semiconductor Manufacturing, Phoenix, AZ, pp.52-57. Rinott, Y. (1978) On two-stage selection procedures and related probability-inequalities, Communications in Statistics-Theory and Methods A7 799–811. Rosen, S.L., Harmonosky, C.M., 2005. An improved simulated annealing simulation optimization method for discrete parameter stochastic systems, Computers & Operations Research, 166 (2) 343 358. Shalev-Oren, S., Seidmann, A., Schweitzer P.J., 1984. Analysis of flexible manufacturing systems with priority scheduling: PMVA, Proceedings of the first ORSA /TIMS conference on flexible manufacturing systems, pp.135-141. Sloan, T.W., Shantikumar, J.G., 2002. Using in-line equipment condition and yield information for maintenance scheduling and dispatching in semiconductor wafer fabs, IIE Transaction 34 191-209. Sako, S., Yamamoto, H., Kondo, H., Arimae, J., 2003. E-diagnostics Technology for Supporting e-manufacturing, Hitachi Review 52 (3) 171-175 Waller, A., 1994, A queueing network model for field service support systems, Omega, International Journal of Management Science 22 (1) 35-40. Wohlwend, H., 2001. An E-factory vision: Building on e-diagnostics, Future-Fab International (11) 24-30. Zeng, A.Z., Zhang, T., 1997. A queueing model for designing an optimal three dimensional maintenance float system, Computers and Operations Research 24 (1) 85-95.
27