A Software Process Tailoring System Focusing to Quantitative Management Plans Kazumasa Hikichi, Kyohei Fushida, Hajimu Iida, and Ken’ichi Matsumoto Graduate School of Information Science, Nara Institute of Science and Technology 8916-5 Takayama-cho, Ikoma-shi, Nara, 630-0192 Japan {kazuma-h, kyohei-f, matumoto}@is.naist.jp,
[email protected]
Abstract. This paper presents a survey of actual conditions of use of standard indicators in a Japanese software development organization. This survey is conducted in order to investigate possible criteria for selecting and customizing standard indicators according to the context of each project. Based on results of the survey, a process tailoring support system that is mainly focusing to quantitative management planning is proposed. The system EPDG+ (Electronic Process Data Guidebook Plus) helps project planners select / customize quantitative indicators to be employed in process control. Detail of resulting software project plans including measurement analysis tasks can be browsed by this system
1 Introduction Quantitative management, i.e. the quantitative control in both of quality and schedule management is a key factor of the software process. The quantitative management requires indicators based on quantitative data. Generally, we need to select indicators according to the property of each project, and then we also need to plan the activities for both of measurement and analysis of quantitative data that is required to derive the indicators. Organizations in a certain level of capabilities (e.g. CMMI-staged level 3) usually define their own set of the project management indicators, and project planners must understand the aim of each indicator, select/reject it according to the property of each project, and plan tasks for measurement and analysis. This is often very difficult work for novice planners without sufficient knowledge of the indicators and associated measures. In this paper, at first we report the survey about the current status of indicator use in a Japanese software development company (we are not allowed to disclose the detail of the company, including its name, in this paper.) This survey was conducted in questionnaire form in order to design detailed features of the process tailoring support system EPDG+ (Electronic Process Data Guidebook Plus) that is being developed by us. EPDG+ mainly focuses to the quantitative management, having features to expose appropriate indicators based on the property of each project based on the master list of organizationally standardized indicators. EPDG+ also supports to integrate the measurement and analysis activities required for selected indicators into an engineering process at planning the development project.
2
Kazumasa Hikichi, Kyohei Fushida, Hajimu Iida, and Ken’ichi Matsumoto
2. Related Work
Indicator Analysis Model
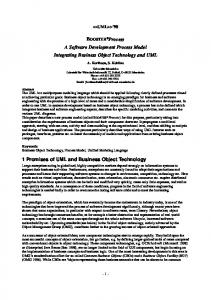
Many works related to quantitative … Derived Measure Derived Measure management have been done since the Measurement Function improvement and increase in efficiency … of the progress or quality management Base Measure Base Measure of the software development based on Measurement Method quantitative data is elements which Attribute influence improvement in productivity or quality directly. ISO/IEC15939 Fig. 1. Measurement information model shows the framework for software in ISO/IEC15939 measurement, analysis, and construal to achieve various information needs, such as project management and quality assurance. Information structure handled in the measurement and analysis process is specified as a reference model as shown in Fig.1. This model show the way which eases objective decision-making based on quantitative information by associating well measurable attributes characteristic to process or product in a project, such as development scale, effort, and number of defects, with the indicator for decision making[5]. Thus, the primary data called "base measure" is collected by quantifying various attributes which exist in a project according to the defined measurement method. Then, the secondary data called “derived measure” is derived by assigning some base measures to measurement function. Finally, the indicator is obtained by analyzing these measures according to the defined analysis model. A project manager makes decision according to the finally derived information product with decision criteria. At the following discussions, we use the concept and the term based on ISO measurement information model. Meanwhile, several EPG (Electronic software Process Guidebook) systems are proposed in the past (e.g. [8]). Most of them mainly focus to support understanding of the prescribed software process. Our EPDG approach is also capable to this field, but our current focus is how to utilize the information models, such as definition and flow of quantitative data, required by quantitative management. The ISO information models are useful and very important for the process tailoring.
3. Survey of the Current Status of Used Indicator
3.1 Background In this study, we consider software development organizations, which perform following two practices, as targets of our approach to support quantitative management planning. − Every project is planned and performed based on the standard development process which is defined as organizational standard, typically, in the form of WBS (Work Breakdown Structure).
A Software Process Tailoring System Focusing to Quantitative Management Plans
3
− The indicator set for quantitative process management is prepared as an organization standard. When quantitative management is to be planned, selecting appropriate indicators and integrating associated measurement tasks in the project plans are to be performed. However, the definition of standard indicators is shortly described in the natural language and almost none of formal explanation about an analysis model, function definition (i.e. calculation method), or a measurement method is provided in many organizations. Moreover, explicit tailoring guidelines are not provided. Inexperienced managers have great difficulty in selecting appropriate indicators for their project. In order to observe actual status of indicators selection and customization in industries, we have conducted a survey to 17 projects in a software development company in Japan (some information is masked due to non-disclosure agreement). 3.2 Survey Outline The survey was conducted by using the questionnaire to project managers who applied quantitative management in a software development (enterprise software system development section) with hundreds of employee. We sent the questionnaire to project managers in the company mainly asking about actual use of their organizational standard 45 management indicators. They are used for progress management, review, testing, process quality assurance, requirement management, support process. The first part of the questionnaire is questions about the profile of the project, such as project size, business area, and the profile of manager, e.g. months of experience as project manager and the number of project s/he ever managed. The second part (main part) of the questionnaire is a list of indicators; for each indicator, questionee is requested to specify the extent of use. The extent of use is at first categorized into two answers, “used” or “unused”. Then each answer is divided in to more detailed ones. “Used” is divided in 5 answers (in 5 levels), and "Unused” is divided in 5 answers (in 5 levels)". In addition, the reason that had was used or not used was optionally answered.
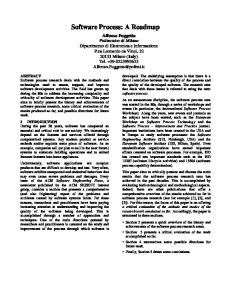
More than 1M Steps (7 proj ects) Progress Management
100%
Review
Testing
Less than 1M Steps (7 proj ects) PQA
Risk
Requirement Support
Use ratio
80% 60% 40% 20% 0% 1
3
5
7
9
11
13
15
17
19
21
23
25
27
29
31
33
35
37
Indicator ID#
Fig. 2 Summary of the project numbers for each indicator
39
41
43
45
4
Kazumasa Hikichi, Kyohei Fushida, Hajimu Iida, and Ken’ichi Matsumoto
3.3 Results and Analysis At first, we summarized usage data simply in two categories, “used” or “unused”, to get rough trends of the answers according to product size (either less or more than 1M steps) as shown in Fig.2. Then we proceed to detailed analysis according to manager’s experience (less or more than 4 years) also regarding detailed level of indicator use. We had to exclude 4 samples without product scale information in program steps. Therefore we used 13 project samples in following analysis This analysis is done because we assume novice managers of small project would need systematic assist to select and adapt standard indicators to fit the project size, meanwhile most indicators would be employed in large projects regardless of the experience of the managers. As analysis results, we currently have following observations: − Indicators for progress management and testing are used in most projects, except one indicator (#3 for tracking the delay of progress report meetings). Indicator #3 is employed in the large project group, but not employed in the small project group. We got a comment from a small project group manager that there is little possibility of delay of meeting. − Indicators for review tracking, for risk management, and for support process showed low rate of use (reasons for these tendencies is not clear at this point). − In the small project group, we found that experienced managers use many modified or alternative indicators in their project, while novice managers seldom do such adaptation. We got a comment that experienced manager often use alternative information that is available with less cost, and omit some indicators according to their practical situations. − In both of the small and large project groups, indicators #22~24 for “review speed” are not employed by any projects. Furthermore, a few of experienced managers answered that they don’t sufficiently understand the definition or usage of those indicators. These observations just show “as-is” of one organization’s indicator use tendency, and we need to be careful to generalize it. However, we found those observations are actually valuable in considering systematic supports to selection and adaptation of indicators. We actually had following insights in designing EPDG+ features,: 1. As we observed, contexts of the project influence the use pattern of the indicators. By extracting influenced factors according to various project contexts, we will be able to provide indicator candidates to be employed. In order to accomplish this, further survey to more projects and more organizations are needed. 2. Alternation and modification made to standard indicators by experienced managers may be exposed to inexperienced managers as supplemental information of management planning. In order to accomplish this feature, functions to customize the standard indicators, to store them for future reuse and to expose inherited indicator variation are needed.
A Software Process Tailoring System Focusing to Quantitative Management Plans
5
Further more, by accumulating the record of modification to standard indicators and standard process, EPDG+ system itself will make this kind of survey quite easily and inexpensive.
4. Designing and Prototyping EPDG+ The EPDG+ system is an extended version of EPDG (Electronic Process Data Guidebook) system[6] which scopes to help understandings of process data definitions for analysis and measurement. EPDG+ extends its scope to project planning. It supports a tailoring in planning measurement and analysis activity depending on the characteristics of the project based on quantitative management. Tailoring support is typically provided according to the following scenario. In this scenario, the work flow is assumed that the planner inputs a process description without management plan, integrates management plan based on quantitative management, and then outputs a process description with management plan. 1. A user executes the system, inputs a process description, and specifies characteristics of the project. 2. A user refers to the indicators that the system has exposed, and selects indicators. 3. A user browses the plan provided by the system in a graphical way (see Fig.2), and confirms excess and deficiency in the collection activity. 4. If it is necessary, planner will return to step 2, and modifies indicator selections. 5. Once all indicators to be used were decided, project process with quantitative management plan is produced. There are two major features of EPDG+ as follows: − Indicator recommendation: Organizational standard indicators are listed with rating information based on various criteria. Rating based on records of indicator employment in the past projects with similar profile may be one useful criteria. − Browser of process with measurement and analysis activities embedded: In order to confirm measurement and analysis tasks in the process while planning, this feature enables to browse planned processes with integrated measurement and
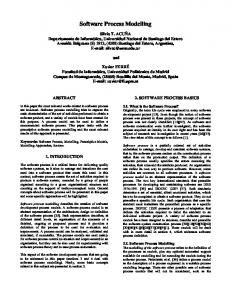
Fig. 2. A Screenshot of the EPDG+ prototype for WBS-style process descriptions.
6
Kazumasa Hikichi, Kyohei Fushida, Hajimu Iida, and Ken’ichi Matsumoto
analysis activities Figure 2 shows a screenshot of the prototype system. The system window consists of three panes for process structure overview, zoomed detail of the process indicating measurement and analysis tasks, and indicator explanations and examples.
5. Conclusion This paper mainly presented a survey of organizational indicator use for the systematic support to process quantitative management. From the observations we confirmed that quantitative management indicators are actually selected and tuned in hand to fit to the characteristics of each project, and therefore systematic support to indicator selection and modification will be great help to efficient project management. Our EPDG+ is currently under development and it is planned to be integrated to the guideline system for a software company’s managers.
Acknowledgements We cordially thank the anonymous managers for their responses to our survey. We thank Mr. Yasutaka Kamei at NAIST in his help to EPDG+ prototyping. This research is partially supported by the Japan Ministry of Education, Culture, Sports, Science and Technology, Grant-in-Aid for Scientific Research (C) 17500024, and also by the EASE project [9] in Comprehensive Development of e-Society Foundation Software program of the Japan Ministry of Education, Culture, Sports, Science and Technology.
References 1. CMMI Product Team: Capability Maturity Model Integration for System Engineering / Software Engineering / Integrated Product and Process Development, Version 1.1. Software Engineering Institute, CMU/SEI-2002-TR-004 (2002). 3. ISO/IEC 9126:1991: Information technology software product evaluation – Quality characteristics and guidelines for their use. (1991). 4. ISO/IEC 15939:2002: Software engineering - Software measurement process (2002). 5. McGarry, J., et. al.: Practical Software Measurement: Objective Information for Decision Makers. Addison-Wesley Pub (2001). 6. Murakami, H., Iida, H., Matsumoto, K.: An Electronic Guidebook System for Support of Software Process Management Data Collection and Utilization. Technical Report on IEICE, SS2004-41 (2004) 43-48 in Japanese. 8. Becker-Kornstaedt, U. and Reinert, R.: A concept to support process model maintenance through systematic experience capture. In Proceedings of the 14th International Conference on Software Engineering and Knowledge Engineering (Ischia, Italy, July 15 - 19, 2002). SEKE '02, vol. 27. ACM Press, New York, NY, 465-468. 9. EASE Project, EASE Project homepage, http://www.empirical.jp/