1 demonstrates the building blocks of the sound source classifier implemented. First, silence regions are detected using energy and average zero-crossing rate.
A SOUND SOURCE CLASSIFICATION SYSTEM BASED ON SUBBAND PROCESSING Oytun Turk
Omer Sayli
Helin Dutagaci
Levent M.Arslan
Electrical and Electronics Eng. Dept. Bogazici University, Istanbul, Turkey @boun.edu.tr
ABSTRACT
The work in this field was initiated in 1970s [2]. General audio classification using acoustical features is addressed in many studies. In [3], the authors focused on a system to transcribe broadcast news which contained clean speech, noise corrupted speech, background noise, music, and silence. Video indexing using audio data is another practical application that has attracted the attention of researchers [4]. As musical signals exhibit considerable amount of complexity, several studies were aimed at automated music transcription [5], instrument identification [6] and rhythm tracking. In this study, information from different frequency bands of the signal spectrum is used for extracting acoustical parameters to be used in the classification process. Accurate and robust onset detection is carried out employing psychoacoustical evidence on time and frequency domain masking. The harmonics are determined at each subband and used to represent the harmonic structure of the input audio signals. The filterbank used for subband analysis is a bank of elliptic bandpass filters. Appropriate choice of center frequencies and bandwidths is made according to [7].
A system for classification of audio signals containing speech, music, noise and silence is proposed. Appropriate subband processing is applied for the characterization of each sound source. The algorithm operates in four steps to classify the contents of a given audio signal. The acoustical parameters and statistical measures to be used in the classification process are obtained via an off-line training procedure. The starting and finishing instants of the acoustical events are labelled in the silence/onset detection stages. Acoustical parameters of the given signal are extracted, analysis of variance and classification using the LBG algorithm is performed by generating codebooks of acoustical vectors. Experimental work is carried out on a database containing speech, music, noise and silence. The experiments demonstrate that the system achieves 88% classification success on the average when the sound sources are non-simultaneous.
1.
INTRODUCTION
Human auditory system is subject to different types of sound mixtures in daily life. Although the characteristics of these mixtures vary greatly due to the sources producing the mixture and the acoustical environment, human ear is successful in identifying the types of sounds in a complex sound mixture in many cases. The main goal of Computational Auditory Scene Analysis (CASA) is to implement systems that can imitate this behavior. The applications include the transcription of audio data containing sounds from different sources, speaker identification using acoustical features, identification of musical instruments, monophonic/polyphonic musical transcription, rhythm tracking, acoustical model based frontend processing for speech recognition [1], and content based multimedia parsing. In this study, we aim to implement modules to extract different acoustical parameters from audio signals; analyze different audio signal databases using acoustical parameter extraction modules; use the results of the analysis in determining the best feature sets in transcribing sounds from different sources; implement and test the performance of a sound source classification system using acoustical features.
1.2. Paper outline Next section starts with the presentation of the block diagram of the implemented sound source classification system. Section 3 describes the methods used for feature extraction and implementation details of the main modules of the system. The modules carry out silence detection, onset detection, acoustical feature extraction, training and classification. Section 4 presents the audio database used and the experimental results obtained. Finally, the paper is concluded with a discussion of the results and further improvements in Section 5.
2.
SYSTEM OVERVIEW
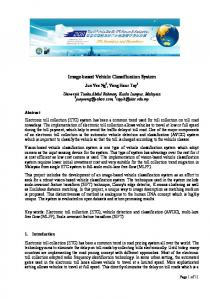
The flowchart in Fig. 1 demonstrates the building blocks of the sound source classifier implemented. First, silence regions are detected using energy and average zero-crossing rate measurements. Next, onset detection is carried out for determining the exact starting instants of the acoustical events present in the signal. Acoustical features for each acoustical event is extracted and the classification algorithm is executed to label the sound sources present in the input audio signal. Training data obtained using an off-line training procedure is used for classification purposes. The output of the system is the audio event labels for the input audio file.
1.1. Review of ASA literature Auditory Scene Analysis (ASA) aims to explain the way that the human auditory system processes complex sound mixtures.
641
•
Preprocessing (amplitude normalization, bandpass filtering, and half-wave rectification).
•
Convolution with a 200 ms half-Hanning window followed by decimation.
•
Derivative and relative difference function calculation followed by thresholding to generate onset candidates.
3.2. Acoustical Feature Extraction
Figure 1 : Classification system flowchart.
All acoustical parameters are collected to generate acoustical feature vectors for each segment of audio signals on a frame-byframe basis. Each subband feature is extracted after decomposing the input signal into subband components using a bandpass filterbank. Mean and variance of the features described below are also used in the classification process :
3. IMPLEMENTATION 3.1 Silence and onset detection Silence detection is carried out on a frame-by-frame basis by employing a silence detector that uses both energy and zerocrossing rate for detecting silent frames. Median filtering followed by linear filtering is used for smoothing. One of the very basic and crucial steps in ASA is onset detection. It refers to the determination of discrete events, or groups in acoustic signals. Accuracy of onset detection is of crucial importance for any signal processing application that requires acoustical segmentation. Factors that seem to affect our perception of onsets are amplitude change, pitch change, and timbre change or a change in the frequency distribution of the audio signal. The challenges related to onset detection are:
•
Harmonics:First 4 harmonics are used. Harmonic structure detection is carried out on a subband basis as explained in Section 3.3.1 below.
•
Temporal features: Duration (rise time from 10 % of the maximum energy plus the decay time to the 10% of maximum energy), rise rate from 10 % of the maximum energy, decay rate to the 10 % of the maximum energy, decay rate to the 50 % of the maximum energy.
•
Spectral Roll-off Frequency:It is defined as the frequency under which 95% of the total energy of a signal is contained.
•
possibility of false onset alarms due to gradual changes in the signal,
•
difficulties in the design of an algorithm that automatically corrects onset estimates,
•
Subband Energy
•
robustness and accuracy.
•
Zero - crossing rate: It is the rate of occurrence of zero-crossings in time domain.
•
Spectral flux: Spectral flux is defined as the difference of magnitude spectra of two consecutive frames. This value is calculated for each subband component using the following formula : (1) (SF)k = || Xk , n - Xk, n-1 ||
In [8], a subband based method is proposed to overcome the difficulties listed above. The first psychoacoustical motivation for employing information from subbands follows from the hypothesis that some sort of cross-band integration (correlation) is carried out by our hearing system over audio signals. Thus, it is useful to consider subbands of the original signal trying to detect onsets in these subbands rather than processing the signal as a whole.
where Xk, n is the magnitude spectrum vector for kth subband of frame n. •
Figure 2: Onset detection flowchart. We have used 5 filters for subband decomposition in the onset detection. The filters were sixth order elliptic filters, with 3 dB of ripple in the passsband and 40 dB of rejection in the in the stopband. Center frequencies were 0.4, 0.8, 1.2, 1.6 and 3.2 kHz. Bandwidths of these filters were chosen according to the human auditory system characteristics, i.e. for center frequencies less than 0.5 kHz the bandwidth was 0.2 kHz and for center frequencies greater than 0.5 kHz it was 0.2 times the center frequency. Next, the algorithm in [8] is applied to determine onsets as shown in Fig. 2.
Spectral Residual Energy : This feature is estimated by fitting an LPC model to the signal and then calculating the difference between the predicted spectrum and the original spectrum. Energy of the residual spectrum is calculated for each subband. An LPC order of 18 was used with a window size of 25 ms. and a skip rate of 10 ms. for speech. The window size and skip rates were lower for music (window size 10-20 ms., skip rate 5 ms.).
3.2.1. Harmonics Detection The simplest sound one can encounter in daily life is a pure tone. A pure tone can be defined as a signal that contains a single sinusoidal component. Most of the time the scene is much more complex: Many pure tones and noise can be present in a sound mixture. When a signal is composed of several pure
642
input data belongs to is determined by searching for the minimum Mahalanobis distance between the input feature vector and codebook vectors. The decisions made for the previous frames is also considered in this step.
tones, it is regarded as a complex tone. If the frequencies of the pure tones are integer multiples of a common basic or fundamental frequency, the resulting complex tone is called a harmonic complex [7]. Music and speech signals may exhibit strong harmonic structures which can be used as a feature in automated recognition and transcription systems as well as in synthesis. In our implementation of harmonic structure detection, we have used the properties of the human auditory system. In basic terms, human ear serves as a frequency analyzer. The cochlea which resides in the inner ear enables the frequency analysis procedure because different regions of the cochlea are sensitive to different frequencies. The overall auditory system can be modeled by a set of band-pass filters with center frequencies starting from 10 Hz to 20000 Hz. A common model for HAS is a set of band-pass filters. The center frequencies of such a filter bank is given [7]. An autocorrelation based approach is employed for pitch detection at each subband. Harmonics detection is carried out as follows: •
•
•
The first subband f0 output that is nonzero is found. This value is denoted by f0-i.e. it is the fundamental frequency of the first harmonic component.
Table 1: F-ratios for acoustical features.
The f0 outputs for the remaining subbands which correspond to higher frequencies are normalized with f0. Let f(n) be the f0 value for the nth subband. Then after normalization the normalized harmonic value for the nth subband can be calculated by hn = f(n) / f0.
4.
EXPERIMENTS
Two audio databases containing different sound sources were recorded for training and testing the system. The waveforms were sampled at 44.1kHz and quantized using 16 bits PCM. The first database is used for training and it consisted of speech, music, and noise. The speech database contains sentences uttered by 30 different speakers (15 female, 15 male) in different ages. The music database is recorded using audio CDs including jazz, classical music, rock and pop songs (20 samples from each music type). White noise and background noise in an office builds up the noise database. Each audio class contained approximately 40 minutes of recorded data, 25 minutes of which are used for training to generate the codebooks and the rest 15 minutes used for testing. The test database is formed by either using sounds from different audio classes non-simultaneously (i.e. the sounds are presented to the system one after another for classification) or simultaneously (i.e. by mixing two or more sounds from different classes in different amounts). Table 2 demonstrates the results. Note that “simultaneous” mixtures are obtained by mixing sounds from different audio classes (e.g. speech with music) in different amounts as indicated by the “interference” which indicates the energy of the second component as compared to the first component. As an example consider the 3rd row of Table 2 where “interference” is 20%. This means that for the Speech/Music mixture, the speech signal energy is 80% and music signal energy is 20% of the total energy.
If hn = 0 , the sound exhibits noise-like characteristics. If |hn – K| ε, then no harmonic is detected.
3.3. Classification The aim of this part is the automated classification of sounds generated by different sources using appropriate acoustical features. For this purpose, a set of features describing both temporal and spectral characteristics of audio signals were determined. After the features are extracted from a set of samples as described in the previous section, the parametric classification scheme is trained with this training data. Then the classification algorithm is tested on a different group of sound samples (i.e. the test database). Analysis of variance (ANOVA) is carried out first on the training data. The aim is to determine appropriate set of acoustical features for classifying different classes. For this purpose, the acoustical features are extracted frame by frame (window size = 25 ms, skip size = 10 ms using a Hamming window). Each combination of the vectors generated for each group is used in ANOVA with the hypothesis that the group means are equal. The f-ratio values obtained for each feature is given in Table 1. The features extracted from the training data are first normalized to unity. An LBG vector quantizater is used to generate codebooks for each sound class to represent frame feature vectors [9]. After the codebooks for each audio class is generated, the features extracted from the input data is compared with the codebook entries. The audio class that the
Table 2: Classification success for different mixtures.
643
The size of the codebook (which is a power of 2) is also varied to obtain better classification results as demonstrated in Fig. 3. As real-time applications are concerned, search from a larger codebook increases processing time and may make the system become totally useless for such applications.
[5] K.D.Martin, “A Blackboard System For Automatic Transcription of Simple Polyphonic Music”, MIT Media Lab. Perceptual Computing Sect. Tech. Rep., No.385, 1996. [6] J.C.Brown, “Computer Identification of Wind Instruments Using Cepstral Coefficients” in Proc. 16th Int. Congress. on Acoustics, pp. 1889-1890, Seattle. [7] E.Zwicker and H.Fastl. Psychoacoustics. Springer-Verlag Berlin - Heidelberg - New York. 1998. [8] Klapuri, “Sound Onset Detection by Applying Psychoacoustic Knowledge", in IEEE ICASSP 1999. [9] Y.Linde, A. Buzo, R.M. Gray, “An Algorithm For Vector Quantizer Design", in IEEE Trans. Commun, COM-28, 1, pp.84-95.
Figure 3: Codebook size vs. classification success (+) Speech/Music (No interference) (o)Speech/Noise (10% interference) (*)Music/Noise (20% interference)
5.
CONCLUSION
In this study, we have focused on the problem of general audio transcription and implemented a system that can be used in the case of complex auditory scenes. On the average, 88% classification success was achieved when the sound mixtures were non-simultaneous and the classification success decreased when different sound sources are presented together (the worst performance achieved when two or more sources appear simultaneously having similar energy levels). Different classification strategies can be employed for improving the performance, such as Hidden Markov Models or Artificial Neural Networks. New acoustical features can be incorporated into the current system. This is a design problem and appropriate acoustical features should be employed according to the case at hand. As an example, the system can be modified for automated musical transcription and/or instrument identification.
6. REFERENCES [1] M.S. Spina and V.W.Zue, “Automatic Transcription of General Audio Data”, Tech. Report, Spoken Language Systems Group, Lab. For Computer Science, MIT. [2] A. Bregman. Auditory Scene Analysis. Cambridge MA : MIT Press. 1990. [3] M.S. Spina and V.W.Zue, “Automatic Transcription of General Audio Data : Preliminary Analyses”, in Proc. of the ICSLP, pp. 594-597. [4] C.Saraceno and R.Leonardi, “Audio as a Support to Scene Change Detection and Characterization of Video Sequences”, in IEEE ICASSP 1997, Vol. 4, pp. 25972600.
644