inary study is the answer to the question whether the predator-prey approach to ... The common feature of CI methods is their emphasis on âimitating lifeâ by.
A Spatial Predator-Prey Approach to Multi-Objective Optimization: A Preliminary Study Marco Laumanns, G¨unter Rudolph, and Hans-Paul Schwefel Universit¨at Dortmund, Fachbereich Informatik, D–44221 Dortmund / Germany
Abstract. This paper presents a novel evolutionary approach of approximating the shape of the Pareto-optimal set of multi-objective optimization problems. The evolutionary algorithm (EA) uses the predator-prey model from ecology. The prey are the usual individuals of an EA that represent possible solutions to the optimization task. They are placed at vertices of a graph, remain stationary, reproduce, and are chased by predators that traverse the graph. The predators chase the prey only within its current neighborhood and according to one of the optimization criteria. Because there are several predators with different selection criteria, those prey individuals, which perform best with respect to all objectives, are able to produce more descendants than inferior ones. As soon as a vertex for the prey becomes free, it is refilled by descendants from alive parents in the usual way of EA, i.e., by inheriting slightly altered attributes. After a while, the prey concentrate at Pareto-optimal positions. The main objective of this preliminary study is the answer to the question whether the predator-prey approach to multi-objective optimization works at all. The performance of this evolutionary algorithm is examined under several step-size adaptation rules.
1 Introduction It may be discussed controversially, whether organic evolution is an adaptation or an amelioration process, or neither of those. But, mimicking some rules of that “game of life” has led to powerful optimum seeking algorithms [1]. Three different approaches that emerged in the 1960s have been given the common denominator Evolutionary Algorithm (EA) or Evolutionary Computation (EC) [2]. Together with Neural and Fuzzy Computation, EC has become part of the new field called Computational Intelligence (CI) [3]. The common feature of CI methods is their emphasis on “imitating life” by subsymbolic information processing. In many if not most cases, EAs are used to solve optimization tasks with just one objective, where the (global) optimizer often turns out to be a unique position in the decision parameter space. However, if several conflicting objectives are given, there is a larger set of interesting solutions: the non-dominated or Pareto-optimal set. Tradeoffcurves for two objectives at a time show how far one has to concede with respect to one goal in order to win with respect to the other. A couple of conventional approaches to multi-objective optimization have been adopted to EAs [4–6]. In most cases, ambiguities are eliminated before the Paretoset is known, e.g., by weighting the criteria or Euclidean distances to the single-criteria optimizers.
A novel approach of identifying the whole Pareto-optimal set within one run is presented in the following, using the predator-prey model from ecology. The prey are the usual individuals of an EA that represent possible solutions to the optimization task. They are placed, e.g., on a toroidal grid, reproduce, die off after a while, and are challenged by predators that might cut down their life span. While the prey remain stationary on the vertices, each predator performs a random walk on the grid, chases the prey only within its current neighborhood and according to one of the optimization criteria. Because there are several predators with different selection criteria, those prey individuals, which perform best with respect to all objectives, are able to produce more descendants than inferior ones. As soon as a grid place for the prey becomes free, it is refilled by descendants from alive parents in the usual way of EA, i.e., by inheriting slightly altered attributes. After a while, the prey are expected to concentrate at Pareto-optimal positions. The principally asynchronous concept without global observer should ease the use of parallel processing systems substantially. The organization of this paper is as follows. After the introduction of the basic terminology associated with the multi-objective optimization problem given in section 2, we present the spatial predator-prey model in section 3. To get a first assessment of the behavior of this evolutionary algorithm, we describe some initial numerical experiments and discuss the results in section 4. Finally, section 5 summarizes our preliminary conclusions.
2 Multi-Objective Optimization Let f : X ! IRq with X � IR` and q � 2 be a vector-valued function that maps a decision vector x 2 X to an objective vector y = f(x) 2 IRq . In the ideal case the objective functions fi : X ! IR should be minimized simultaneously for i = 1; : : :; q. The problem is, however, that the set of objective vectors is not totally ordered. To understand the problem to full extent it is important to keep in mind that the values f1 (x); : : :; fq (x) of the q � 2 objective functions are incommensurable quantities and that the objectives themselves are conflicting in general: While f1 may measure the costs of producing a car, f2 may measure the level of pollution, f3 the total weight, f4 the probability of a lethal injury in case of a frontal crash, and so forth. As a consequence, the notion of the “optimality” of some solution needs a more general formulation than in singleobjective optimization. It seems reasonable to regard those decisions as being optimal which cannot be improved with respect to one criterion without getting a worse value in another criterion. Formally, this concept of optimality may be stated as follows. Let F = ff(x) : x 2 X � IR` g � IRq be the set of objective vectors that are attainable under the mapping f . An objective vector y� 2 F is said to be Pareto-optimal with respect to f if there is no y 2 F with y 6= y� such that yi � yi� for all i = 1; : : :; q. The set F � of all Pareto-optimal objective vectors is called the Pareto set. Each decision vector x� 2 X � = fx 2 X � IR` : f(x) 2 F � g is termed an efficient solution or a Pareto-optimal decision vector of the multi-objective optimization problem. Since the sets X � and F � can be analytically determined only in exceptional cases and since the dimension of X � as well as F � may be as large as minf`; q ; 1g, numerical methods for finding the set of Pareto-optimal decisions are generally restricted to approximating 2
the shape of the set X � . Needless to say, this will also be the goal of the evolutionary algorithm to be presented shortly.
3 The Predator-Prey Model 3.1 Model Description Let G = (V; E) be an undirected connected graph with jV j = n vertices and jE j = m edges. Each vertex is associated with a prey which is represented by a decision vector. The predator makes a random walk on graph G, i.e., a predator on some vertex v moves with probability 1=d(v) to one of its nearest neighbors where d(v) denotes the degree of vertex v 2 V . More specifically, the transition probabilities of the predator’s random walk are � if (v; w) 2 E pvw = 1=d(v) 0 otherwise. Each predator chases the prey with respect to a single specific objective only. Thus, there are at least q predators simultaneously chasing the prey with respect to the q different criteria. An i-predator at vertex v 2 V will “catch” the prey in the neighborhood of v which is worst with respect to objective function fi . If a prey has been caught by a predator then it is erased from this vertex and successively replaced by a new individual that is produced by mutation and possibly recombination of adjacent individuals. 3.2 Choice of Spatial Structure If the evolutionary process is not stopped then each predator will visit every vertex/prey infinitely often. This is an immediate consequence of the fact that a predator moves through the graph according to a random walk. It seems reasonable to choose a graph structure such that the predator visits every vertex equally often in the limit (there is at least no obvious objection against this postulation). To identify the class of graphs satisfying this requirement let N(v; k) be the number of times the random walk visits vertex v 2 V in k steps. If the graph is non-bipartite then
N(v; k) = d(v) lim k!1 k 2 jE j
(1)
for every v 2 V [7]. Thus, non-bipartite regular graphs are appropriate candidates. But bipartite d-regular graphs with bipartition fV1 ; V2g are acceptable as well, since the distribution of the random walk oscillates between “almost uniform on V1 ” and “almost uniform on V2” as k ! 1. The inverse of the limit in (1) is the expected time until a random walk starting at v 2 V returns to v for the first time. Thus, for d-regular non-bipartite graphs the expected recurrence time is hv = 2 m=d for all v 2 V . This value is also approximately valid for bipartite d-regular graphs. Evidently, the frequency of selecting a prey with respect to the different criteria depends on the graph structure on the one hand and on the number of predators per 3
criterion on the other hand. Since the graph structure will be kept fixed we need a measure permitting an assessment of this relationship. The mean cover time E[ C(G) ] of a graph G represents the maximum expected number of steps required by a predator until each vertex has been visited at least once. For arbitrary graphs the mean cover time can be bracketed by (1 + o(1)) n logn � 4 n3 +o(n3 ) [8, 9]. A cubic increase in the number of vertices is certainly E[ C(G) ] � 27 prohibitive for practical use. But the cubic upper bound decreases to a quadratic one for vertex- and edge-symmetric graphs [10]. More specifically, (n ; 1) Hn � E[ C(G) ] � 2 (n ; 1)2 where Hn is the nth Harmonic number. The lower bound can be sharpened for a specific symmetric graph, namely, the two-dimensional torus. In this case one obtains E[ C(G) ] = (n log2 n) [11]. Thus, if the graph is a two-dimensional torus then the expected recurrence time per predator is 1=n and between n log2 n and 2 (n ; 1)2 random steps have to be waited for until a predator has visited each prey. Larger cover times are easy to achieve— but this would slow down the evolutionary process. Therefore, we have chosen the two-dimensional torus for our experiments. A perhaps fruitful generalization for future experiments is the introduction of different neighborhood graphs for reproducing prey and for the random walk of the predators. 3.3 Step Size Control The development of an appropriate step size control in case of multi-objective optimization has received only little attention up to now. The few experiments made in [12] reveal that the step size rules used in single-criterion EAs do not work very well in the multi-criterion case. Actually, it is an open question of how to choose the step size—especially for the evolutionary model considered here. Apart from a fixed step size, we also experimented with the external step size rule �k+1 = �k where 2 (0; 1) and the index k is incremented whenever a prey produces an offspring. We conjecture that it is not possible to devise an internal step size rule (self-adaptation) for this type of evolutionary algorithm. This assessment is supported by the following observation: The predator-prey model may be seen as a generalization of the steady state or (n + 1)-evolutionary algorithm for single-criterion optimization, and there is well-founded empirical evidence that the usual self-adaptation mechanism does not work satisfactorily for this type of evolutionary algorithms.
4 Preliminary Experimental Results 4.1 Test Problems and Parameter Settings The neighborhood graph used in the experiments was a toroidal grid of size 30 � 30, i.e., with 900 prey. The two test problems have two objectives and were chosen as follows:
� 2 2 � + x2 f(x) = (x x+1 2) 2 + x22 1 p � � ;0:2 x21 + x22) g(x) = jx j4=5;+10jxexp( 1 2j4=5 + 5 (sin3 x1 + sin3 x2 ) 4
The set of efficient solutions X � associated with problem f(�) can be determined analytically. It is the straight line between the optima of both objective functions, namely, X � = fx 2 IR2 : (x1 ; 0)0 with ; 2 � x1 � 0g. Consequently, the Pareto set is
p F � = f(X � ) = f(f1 ; f2 )0 2 IR2+ : f2 = (2 ; f1 )2 where 0 � f1 � 4g :
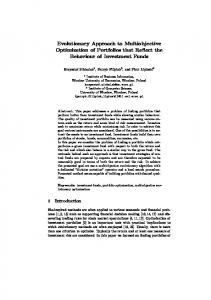
We have chosen this test problem since it possesses no locally efficient solutions apart from those which are also globally efficient. The second test problem g(�) is more difficult since there are also locally efficient solutions that are not globally efficient. Needless to say, our selection of test problems is somewhat arbitrary—but the main objective of this preliminary study is the answer to the question whether the predator-prey approach to multi-objective optimization is feasible or not. For this purpose the initial individuals were drawn at random within the region [ ;50; 50]2 � IR2 and the predators were randomly placed at vertices of the graph. The standard deviations of the Gaussian mutations (the “step sizes”) were either kept fixed with � = 0:5 and � = 0:05, or decreased by the schedule �k+1 = 0:99 �k. For each objective there was one predator, except for the decreasing schedule where we also experimented with up to 100 predators per objective. 4.2 Discussion The first surprising observation that can be drawn from our experiments is that the recombination of the decision vectors leads to a significantly worse approximation of the Pareto-set than the usage of mutation alone. This phenomenon deserves further exploration which is however beyond the scope of this preliminary study. As a consequence, we have only employed mutations in our numerical experiments presented here. Figure 1 shows the approximation of the Pareto-set and its associated decision vectors for the first test problem f(�). The top two rows represent the state of the predatorprey EA with fixed step sizes � = 0:5 and � = 0:05 for one predator per objective after 100; 000 random steps of each predator. Needless to say, the EA cannot stochastically converge to the Pareto-set if the step sizes are fixed. But the prey individuals are closely distributed in the vicinity of the Pareto-set, and the distribution becomes the more concentrated the smaller is the step size. Since small step sizes require more iterations than large step size in order to reach the stationary distribution, it seems reasonable to begin with large step sizes and to decrease them in the course of the evolution. We have experimented with various decreasing schedules—a good one was the choice �k+1 = 0:99 �k. The lower two rows show the state of the EA with this decreasing schedule after 380; 000 random steps per predator (one predator per objective) and 3; 800 random steps per predator in case of 100 predators per objective (last row). Evidently, the population of prey decomposes into several isolated subsets if there is only one predator per objective. We conjecture that this phenomenon is due to the fact that the predators stay too long in the vicinity of a certain vertex (so that these prey are pushed towards the solutions of only one criterion) and need too much time to commute between far distant vertices. If there are several predators per objective (last row) then each prey is more frequently evaluated by both objectives alternately. Apparently, this leads to a more accurate approximation of the Pareto-set. 5
Fig. 1. Approximation of the Pareto-set and its associated set of decision vectors of problem f (�) with two predators and constant � = 0:5 (row 1), � = 0:05 (row 2), decreasing schedule �k+1 = 0:99 �k (row 3), and decreasing schedule in case of 200 predators (row 4).
6
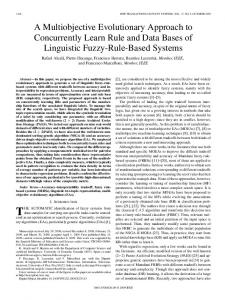
Fig. 2. Approximation of the Pareto-set and its associated set of decision vectors of problem g(�) with two predators and constant � = 0:5 (row 1), � = 0:05 (row 2), decreasing schedule �k+1 = 0:99 �k (row 3), and decreasing schedule in case of 200 predators (row 4).
7
Figure 2 shows the approximation of the Pareto-set and its associated decision vectors for the second test problem g(�). The top two rows represent the state of the predator-prey EA with fixed step sizes � = 0:5 and � = 0:05 for one predator per objective after 100; 000 random steps of each predator. This problem is more difficult than the first test problem because of the existence of locally efficient solutions. If the step size is relatively large (� = 0:5) then there are many prey individuals that are dominated by others. In case of a smaller step size, the number of dominated individuals is much smaller and the Pareto-set is well approximated. Again, the decreasing step size schedule (last two rows in fig. 2) only leads to some isolated subsets of the Pareto-set. This phenomenon only partially disappears for several predators per objective (last row): about one third of the Pareto-set is not represented by the population of prey. Thus, there must be additional reasons for this unpleasant behavior. It might be speculated that a single step size for both objective functions is the cause of the problem since the regions of successful mutations may have significantly different sizes. In this case, the step sizes may be appropriate for one objective function and too large/small for the other objective function. But this is a speculation that needs further investigations in future.
5 Conclusions The preliminary numerical study presented here has shown that the predator-prey model of selection in evolutionary algorithms may be an alternative approach in multi-objective optimization. Although there is some evidence that this method seems to work in principle, there are some surprising phenomena awaiting an explanation. The role of recombination in case of multi-criteria optimization requires further elucidation, and the question of how to choose an appropriate step size control remains still open.
Acknowledgments This work is a result of the Collaborative Research Center “Computational Intelligence” (SFB 531) supported by the German Research Foundation (DFG).
References 1. G. Rudolph. Convergence Properties of Evolutionary Algorithms. Kovaˇc, Hamburg, 1997. 2. T. B¨ack, D. B. Fogel, and Z. Michalewicz, editors. Handbook of Evolutionary Computation. IOP Publishing and Oxford University Press, New York and Bristol (UK), 1997. 3. J. M. Zurada, R. J. Marks II, and C. J. Robinson, editors. Computational Intelligence: Imitating Life. IEEE Press, Piscataway (NJ), 1994. 4. C. M. Fonseca and P. J. Fleming. An overview of evolutionary algorithms in multiobjective optimization. Evolutionary Computation, 3(1):1–16, 1995. 5. H. Tamaki, H. Kita, and S. Kobayashi. Multi–objective optimization by genetic algorithms: a review. In Proceedings of the 3rd IEEE International Conference on Evolutionary Computation, pages 517–522. IEEE Press, Piscataway (NJ), 1996.
8
6. J. Horn. Multicriterion decision making. In T. B¨ack, D. B. Fogel, and Z. Michalewicz, editors, Handbook of Evolutionary Computation, pages F1.9:1–15. IOP Publishing and Oxford University Press, New York and Bristol (UK), 1997. 7. R. Motwani and P. Raghavan. Randomized Algorithms. Cambridge University Press, New York (NY), 1995. 8. U. Feige. A tight upper bound on the cover time for random walks on graphs. Random Structures and Algorithms, 6(1):51–54, 1995. 9. U. Feige. A tight lower bound on the cover time for random walks on graphs. Random Structures and Algorithms, 6(4):433–438, 1995. 10. J. L. Palacios. Expected cover times of random walks on symmetric graphs. Journal of Theoretical Probability, 5(3):597–600, 1992. 11. D. Zuckermann. A technique for lower bounding the cover time. SIAM Journal of Discrete Mathematics, 5(1):81–87, 1992. 12. G. Rudolph. On a multi–objective evolutionary algorithm and its convergence to the pareto set. In Proceedings of the 1998 IEEE International Conference on Evolutionary Computation, pages 511–516. IEEE Press, Piscataway (NJ), 1998.
9