PrePrints
1
A standardized, extensible framework for optimizing classification
2
improves marker-‐gene taxonomic assignments
3 4
Nicholas A. Bokulich1, Jai Ram Rideout2, Evguenia Kopylova3, Evan Bolyen2, Jessica
5
Patnode4, Zack Ellett5, Daniel McDonald6,7, Benjamin Wolfe8, Corinne F. Maurice8,9, Rachel J.
6
Dutton8, Peter J. Turnbaugh8,10, Rob Knight3,11, J. Gregory Caporaso2,4,5,#
7
8
1 Department of Medicine, New York University Langone Medical Center, New York, NY
9
10010, USA
10
2Center for Microbial Genetics and Genomics, Northern Arizona University, Flagstaff, AZ,
11
USA
12
3Department of Pediatrics, University of California, San Diego, CA, USA
13
4Department of Biological Sciences, Northern Arizona University, Flagstaff, AZ, USA
14
5Department of Computer Science, Northern Arizona University, Flagstaff, AZ, USA
15
6Department of Computer Science, University of Colorado, Boulder, CO, USA
16
7BioFrontiers Institute, University of Colorado, Boulder, CO, USA
17
8FAS Center for Systems Biology, Harvard University, Cambridge, MA, USA
18
9 Department of Microbiology & Immunology Department, Microbiome and Disease
19
Tolerance Centre, McGill University, Montreal, Quebec, Canada.
20
10Department of Microbiology and Immunology, G.W. Hooper Foundation, University of
21
California San Francisco, 513 Parnassus Ave, San Francisco, CA, USA
1 PeerJ PrePrints | https://dx.doi.org/10.7287/peerj.preprints.934v1 | CC-BY 4.0 Open Access | rec: 27 Mar 2015, publ: 27 Mar 2015
PrePrints
22
11Department of Computer Science and Engineering, University of California, San Diego, CA,
23
USA
24
25
#Corresponding author
26
Gregory Caporaso
27
Department of Biological Sciences
28
1298 S Knoles Drive
29
Building 56, 3rd Floor
30
Northern Arizona University
31
Flagstaff, AZ, USA
32
(303) 523-‐5485
33
(303) 523-‐4015 (fax)
34
Email:
[email protected]
35
36
37
38
39
40
41
42
43
44
2 PeerJ PrePrints | https://dx.doi.org/10.7287/peerj.preprints.934v1 | CC-BY 4.0 Open Access | rec: 27 Mar 2015, publ: 27 Mar 2015
PrePrints
45
46
47
Abstract
48
Background: Taxonomic classification of marker-‐gene (i.e., amplicon) sequences
49
represents an important step for molecular identification of microorganisms.
50
Results: We present three advances in our ability to assign and interpret taxonomic
51
classifications of short marker gene sequences: two new methods for taxonomy
52
assignment, which reduce runtime up to two-‐fold and achieve high precision genus-‐level
53
assignments; an evaluation of classification methods that highlights differences in
54
performance with different marker genes and at different levels of taxonomic resolution;
55
and an extensible framework for evaluating and optimizing new classification methods,
56
which we hope will serve as a model for standardized and reproducible bioinformatics
57
methods evaluations.
58
Conclusions: Our new methods are accessible in QIIME 1.9.0, and our evaluation
59
framework will support ongoing optimization of classification methods to complement
60
rapidly evolving short-‐amplicon sequencing and bioinformatics technologies. Static
61
versions of all of the analysis notebooks generated with this framework, which contain all
62
code and analysis results, can be viewed at http://bit.ly/srta-‐010.
3 PeerJ PrePrints | https://dx.doi.org/10.7287/peerj.preprints.934v1 | CC-BY 4.0 Open Access | rec: 27 Mar 2015, publ: 27 Mar 2015
PrePrints
63
Background
64
High-‐throughput amplicon-‐sequencing methods have opened new frontiers in microbial
65
ecology, transforming our understanding of complex microbial ecosystems ranging from
66
our bodies(1) to our planet(2). Sequencing ‘universal’ marker genes (e.g., bacterial 16S
67
rRNA and fungal internal transcribed spacer (ITS) amplicons) and comparing those
68
sequences to annotated reference sequences allows complex biological communities to be
69
characterized taxonomically. Many taxonomic classification algorithms have been
70
developed, but different methods can provide markedly different results, even when the
71
same query sequences and reference database are used(3).
72
73
The problem of taxonomic classification of marker genes is described as follows. Given a
74
short, possibly error-‐containing, fragment of a marker gene, the goal is to determine the
75
taxonomy of the organism from which that gene was derived with the greatest possible
76
taxonomic specificity. Accurate and specific taxonomic assignment of these reads is
77
essential for many — but not all — aspects of microbiome analysis, but currently used
78
methods have not been optimized on "modern" datasets (e.g., short-‐amplicon sequencing
79
reads, here we used reads varying in length from 100-‐250 bases as described in
80
Supplementary Table 1).
81
82
Introducing a new taxonomy classification method requires benchmarking against pre-‐
83
existing methods to determine whether the new method is more computationally efficient
84
(e.g., faster and/or smaller memory requirements) and/or better than other methods (e.g.,
4 PeerJ PrePrints | https://dx.doi.org/10.7287/peerj.preprints.934v1 | CC-BY 4.0 Open Access | rec: 27 Mar 2015, publ: 27 Mar 2015
PrePrints
85
yields more specific taxonomic assignments and/or more sequences accurately classified).
86
When comparing a new method to existing methods, developers must:
87
○ identify and obtain test datasets;
88
○ develop an evaluation framework;
89
○ obtain and install pre-‐existing taxonomic assignment software; and
90
○ determine the parameters to benchmark against in the pre-‐existing
91
taxonomic assignment software.
92
These steps are fundamental to any methods development project, but all are subject to the
93
developers’ decisions and biases. Additionally, because the test data and evaluation
94
framework are often not published, when a subsequent method is introduced all of these
95
steps must be repeated by its author. This results in duplicated effort and inconsistent
96
evaluation metrics, such that method benchmarks are often not directly comparable. Each
97
new method is evaluated with a new, custom benchmarking pipeline.
98
99
To address these needs, we developed a computational framework for evaluating
100
taxonomic classifiers using standardized public datasets (Figure 1), and used it to compare
101
the performance of existing and newly developed taxonomy-‐classification methods. This
102
framework will be easily applied to new methods in the future by any bioinformatics
103
method developer. Here we apply the framework to compare the performance of four
104
marker-‐gene-‐agnostic taxonomy classifiers (i.e., those that can be trained on a reference
105
database of any marker gene). Two of these are pre-‐existing classifiers, the RDP Classifier
106
(4), and QIIME’s BLAST-‐based classifier (5, 6), and two are new classifiers based on
107
UCLUST (7) and SortMeRNA (8), which are presented here for the first time. Our
5 PeerJ PrePrints | https://dx.doi.org/10.7287/peerj.preprints.934v1 | CC-BY 4.0 Open Access | rec: 27 Mar 2015, publ: 27 Mar 2015
framework is available on GitHub at https://github.com/gregcaporaso/short-‐read-‐tax-‐
109
assignment and was used to generate all analysis results and figures in this paper (with the
110
exception of the schematic in Figure 1). We executed this framework on the QIIME 1.9.0
111
Amazon Web Services (AWS) virtual machine image, making the full analysis easily
112
reproducible (see the repository’s README.md file). This approach is similar to that taken
113
in
114
http://www.executablepapers.com/).
115
Results
116
Standardized and extensible evaluation of taxonomic classifiers
117
Our evaluation framework differs from others that we are aware of in that it can be reused
118
to support standardized and extensible evaluation of taxonomic classifiers. In this context,
119
we consider a standardized evaluation framework to incorporate a consistent and
120
appropriate set of metrics, defined in the same way (e.g., specificity, sensitivity, accuracy)
121
with sufficient unit testing (for a discussion of unit testing, see (12)), and a consistent and
122
appropriate set of data. Multiple datasets are needed to minimize overfitting. An extensible
123
evaluation framework is one where it is easy for users (not only the initial developers) to
124
add new methods, add new reference databases, and add new datasets and metrics. Testing
125
new methods with standardized datasets and evaluation metrics will relieve developers of
126
the time needed to perform these otherwise redundant steps, and allow direct comparison
127
of new and pre-‐existing methods without repeating benchmarking efforts. Extensibility
128
enables a framework to evolve over time, incorporating useful new datasets and metrics
PrePrints
108
several
recent
“executable
papers”
(9-‐11)
(also
see
6 PeerJ PrePrints | https://dx.doi.org/10.7287/peerj.preprints.934v1 | CC-BY 4.0 Open Access | rec: 27 Mar 2015, publ: 27 Mar 2015
that meet the needs of changing methods and technologies and allowing conclusions to be
130
rapidly updated in the light of new data.
131
132
Our evaluation framework is based on IPython Notebooks(13), which facilitate generation
133
of interactive, reproducible, and executable reports, and uses scikit-‐bio, pandas, and open-‐
134
source
135
(https://github.com/gregcaporaso/short-‐read-‐tax-‐assignment/).
136
evaluates method and parameter combinations based on their performance on
137
standardized amplicon sequence datasets derived from simulated communities and
138
Illumina sequencing of artificially constructed (mock) communities. Simulated
139
communities, where sequences are compiled from reference databases, allow us to assess
140
the “best-‐case” performance of classifiers in the absence of real-‐world issues, such as
141
sequencing and PCR bias and error. Mock communities(14) (in this case, precise
142
combinations of 12 to 67 species; Supplementary Figures 1-‐5) allow us to quantitatively
143
and qualitatively assess the accuracy of taxonomic profiles, since the actual community
144
composition is known in advance, while retaining experimental issues that are difficult to
145
model accurately. Our evaluation framework currently utilizes 10 mock communities to
146
minimize overfitting to conditions specific to experimental conditions or community
147
compositions.
148
149
The framework currently employs the following strategies for evaluating and comparing
150
classifier performance:
PrePrints
129
BSD-‐compatible
software
developed
for
this This
study framework
7 PeerJ PrePrints | https://dx.doi.org/10.7287/peerj.preprints.934v1 | CC-BY 4.0 Open Access | rec: 27 Mar 2015, publ: 27 Mar 2015
151
1)
152
Precision, recall, and F-‐measure scores are qualitative metrics, only assessing the accuracy of taxonomic composition but not abundance.
153
2)
Pearson (r) (15) and Spearman correlation coefficients (rho) (16) are
154
quantitative measures of accuracy, incorporating accuracy of taxonomic
155
composition as well as abundance.
156
3)
Computational runtime is measured for each classifier as a function of reference database size and number of query sequences. (All runtime computations should
158
be performed on the same system with a single job running at a time to control
159
for runtime variance. The results presented here were all performed on a single
160
AWS instance.)
PrePrints
157
161
162
The framework identifies optimal parameter configurations for each classification method,
163
the top-‐performing methods and parameter configurations for each test dataset, and
164
generates publication-‐quality figures illustrating evaluation scores and distributions for
165
each method, configuration, and dataset.
166
167
Our evaluation framework, test datasets, and pre-‐computed taxonomic assignment results
168
(for the methods and parameter combinations presented here) are hosted on GitHub, an
169
online software revision control and collaboration tool (for a discussion of revision control
170
and its importance, see (12)). This provides a major benefit that should drive widespread
171
adoption of this strategy in bioinformatics method evaluations: our analysis is not static. A
172
developer of a new taxonomic classifier (call it Classifier X) can download our test dataset,
173
generate taxonomic assignments for all simulated and mock communities, and quickly
8 PeerJ PrePrints | https://dx.doi.org/10.7287/peerj.preprints.934v1 | CC-BY 4.0 Open Access | rec: 27 Mar 2015, publ: 27 Mar 2015
assess how Classifier X compares to pre-‐existing methods. If the developer determines that
175
Classifier X is promising, they can submit the classification results to our repository as a
176
Pull Request. The Classifier X results can then be merged with the pre-‐existing results, so
177
that future methods developers can evaluate their tool in the context of pre-‐existing
178
methods, which will now include the results generated by Classifier X. The evaluation of
179
future methods therefore uses the same data used here (although new test datasets can
180
also be added using Pull Requests), and evaluators need not have working installations of
181
all pre-‐existing methods, which can be difficult to configure and install.
182
183
We applied this evaluation framework to compare the performance of two commonly used,
184
pre-‐existing taxonomy classifiers (RDP Classifier(4) and BLAST(5)) across multiple
185
parameter settings, and two new taxonomic classifiers presented here for the first time.
186
The first is an adaptation of SortMeRNA (8), and the second is based on UCLUST (7) (see
187
methods for more details on code, the taxonomic assignment algorithms, and data
188
availability).
189
190
Performance of classifiers on bacterial and fungal mock communities
191
We first evaluated assignment accuracy of all classification methods using mock
192
communities. As expected, assignment accuracy for all methods decreased with increasing
193
assignment depth (Figure 2). From phylum to family level, different assignment methods
194
(with optimized parameters) performed similarly, but selection became important for
195
accurate genus-‐ and species-‐level assignments. SortMeRNA achieved the highest precision
PrePrints
174
9 PeerJ PrePrints | https://dx.doi.org/10.7287/peerj.preprints.934v1 | CC-BY 4.0 Open Access | rec: 27 Mar 2015, publ: 27 Mar 2015
and F-‐measures at these levels, though RDP yielded better recall scores and correlation
197
coefficients for most mock communities (Figures 2-‐3; Supplementary Figures 6-‐7). RDP
198
recall and correlation coefficients performed best at low confidence thresholds (c < 0.5),
199
though precision and F-‐measure improved with increasing assignment confidence (Figure
200
3; Supplementary Figures 6-‐7). UCLUST was not the top performer for any metric but
201
demonstrated good balance between recall (better than SortMeRNA) and precision (better
202
than RDP), thus consistently delivering high-‐quality assignments (Figures 2-‐3;
203
Supplementary Figures 6-‐7). BLAST assignments generally performed worse than low-‐
204
confidence RDP assignments of bacteria for all evaluation metrics except for Pearson r, but
205
performed similarly to RDP for fungal assignments (Figure 3; Supplementary Figures 6-‐7).
206
SortMeRNA performed best for fungal community assignments, delivering top precision,
207
recall, and F scores through species level (Figure 3; Supplementary Figures 6-‐7).
208
209
Performance of classifiers on bacterial and fungal simulated
210
communities
211
The mock communities currently available in the framework resemble human fecal
212
(datasets B1-‐B8) or cheese microbial communities (datasets F1-‐F2), so only contain select
213
clades. Thus, we tested classifier performance on simulated sequencing reads derived from
214
the entire Greengenes (17) and UNITE (18) databases, representing all taxa currently
215
annotated in those databases. Taxonomy assignments of simulated communities exhibited
216
similar trends, indicating that classifiers and configurations performed similarly across
217
taxa (Figure 4; Supplementary Figure 8). Simulated communities were generated from
PrePrints
196
10 PeerJ PrePrints | https://dx.doi.org/10.7287/peerj.preprints.934v1 | CC-BY 4.0 Open Access | rec: 27 Mar 2015, publ: 27 Mar 2015
reference sequences randomly selected from the reference databases (see Methods for
219
details). Taxonomy classifications were then made against either the remaining sequences
220
in the reference database (as in a cross-‐validation scheme, referred to as “partial reference”
221
classification, so the query sequences would not be included in the reference database) or
222
the full reference database (which includes exact matches to the query sequences, but
223
ensures that all taxa present in the query data are represented in the reference database).
224
The partial reference classification simulates a typical sequence assignment scenario,
225
whereby many query sequences may not have perfect matches in the database. The full
226
reference classification is still informative, as some sequences removed from the partial
227
reference database may represent unique taxonomic lineages without nearby matches,
228
particularly within the fungal database.
PrePrints
218
229
230
Similar classifier performance and optimization behaviors were observed for classification
231
of simulated communities (Figure 4; Supplementary Figure 8). Species-‐level assignment
232
performed well on simulated sequences for bacteria, using both partial and full reference
233
databases. Surprisingly, classification precision approached perfect scores for most
234
methods, but precision was progressively degraded by low RDP confidence thresholds (c),
235
SortMeRNA best alignments (b) = 1, and UCLUST max accepts (a) = 1 (Figure 4). As
236
expected, precision demonstrated an inverse relationship to recall for simulated reads, and
237
the same parameters that minimized precision maximized recall. Fungal assignment
238
accuracy suffered using the partial reference database, indicating that many sequences
239
removed for classification represent unique lineages: as expected, when the single
240
sequence representing a taxonomic group was removed from the reference database, it
11 PeerJ PrePrints | https://dx.doi.org/10.7287/peerj.preprints.934v1 | CC-BY 4.0 Open Access | rec: 27 Mar 2015, publ: 27 Mar 2015
was no longer possible to accurately classify that organism. Fungal assignment accuracies
242
using the full reference database mirrored the bacterial assignments, and the same
243
methods were optimal for both. Using the partial reference database, optimized RDP and
244
SortMeRNA classifications yielded the best and second-‐best recall and F-‐measure scores,
245
respectively, and tied for best precision (Table 1). Using the full reference database,
246
UCLUST yielded best precision, recall, and F-‐measure scores, significantly better than
247
BLAST and RDP (Table 1).
248
249
Classifier parameter optimization is essential
250
Parameter optimization was essential for all methods (Figures 3-‐4; Table 2, Supplementary
251
Figures 6-‐7). For example, the quality of RDP results ranged from among the worst (with c
252
= 1.0) to the best (with c = 0.0) recall performance with different confidence threshold
253
settings (Figures 2-‐4, Table 2, Supplementary Figures 6-‐7). These values represent a
254
substantial departure from the current recommendation for RDP-‐based classification of
255
very short amplicon sequences (c = 0.5), highlighting the importance of multiple evaluation
256
metrics for optimizing classification performance. SortMeRNA and UCLUST displayed
257
similar behavior, where different parameters resulted in very different method
258
performance, and performed best with slightly reduced similarity thresholds (s= 0.8 for
259
both). Only BLAST was relatively unaffected by different parameter configurations (in this
260
case, e-‐values). Parameter sweeps of this type should therefore be considered an essential
261
component of bioinformatics methods comparisons.
PrePrints
241
12 PeerJ PrePrints | https://dx.doi.org/10.7287/peerj.preprints.934v1 | CC-BY 4.0 Open Access | rec: 27 Mar 2015, publ: 27 Mar 2015
Classifier runtime
263
Classifier choice also substantially impacted computational runtime, as a function of both
264
query sequence count and reference sequence count. Many classification methods first
265
create an index of the reference sequence database prior to classifying query sequences,
266
and thus indexing time in an important measure of a classifier’s scalability to both large
267
and small reference databases. To measure the effects of reference sequence database size
268
on runtime, a single query sequence is searched against the reference database. This tells
269
us how long it takes to assign taxonomy to the first query sequence, and therefore provides
270
a measure of time needed to index the reference. To measure the effects of query sequence
271
count on runtime, increasing numbers of query sequences were classified using the same
272
reference sequence database. Since database indexing is included in all of these steps, we
273
care most about the slope of the line and very little about the y-‐intercept (which represents
274
how long the database takes to index, and is typically a process that can be performed once
275
and the index re-‐used).
PrePrints
262
276
277
UCLUST delivered the fastest query assignment (Figure 5A) and reference sequence
278
indexing times (Figure 5B), and the smallest slope for query sequence assignment (Figure
279
5A). BLAST also demonstrated very little runtime increase in response to reference
280
database size, but exhibited a phenomenally high slope for query sequence count,
281
indicating very slow performance relative to the other classifiers (Figure 5). RDP and
282
SortMeRNA displayed comparable query sequence assignment times and slopes, but
283
SortMeRNA required the most indexing time of any method, exhibiting increasing runtimes
13 PeerJ PrePrints | https://dx.doi.org/10.7287/peerj.preprints.934v1 | CC-BY 4.0 Open Access | rec: 27 Mar 2015, publ: 27 Mar 2015
284
proportional to reference sequence count (Figure 5A). RDP required more indexing time
285
than BLAST and UCLUST, but demonstrated little runtime increase as more reference
286
sequences were added (Figure 5A).
287
PrePrints
288
Discussion
289
Evaluating methods for taxonomic classification of different marker genes and read lengths
290
is critical for interpreting taxonomic assignments, allowing us to determine if assignments
291
at a specific taxonomic level, or for a specific taxonomic group, are reliable. Additionally,
292
different features of taxonomic classifier performance may be important for different
293
applications. For example, for a medical diagnosis based on indicator taxa, false positives
294
may be preferred over false negatives (i.e., optimizing recall at the expense of precision) if a
295
cheap, minimally invasive treatment is available. However, for forensic applications, false
296
negatives may be preferred over false positives (i.e., optimizing precision at the expense of
297
recall), if a false positive could lead to a wrongful conviction. For more general applications,
298
users likely prefer balanced precision and recall (i.e., optimized F-‐measure), and we base
299
our parameter recommendations on this assumption. Thus, understanding classifier
300
performance and limitations, and how to optimize classifiers for different applications, are
301
essential for the usefulness of these methods.
302
303
Here we show that after parameter optimization, classification methods perform similarly
304
for assigning taxonomy from phylum to family level, but performance decreased to
305
different degrees for all methods at genus and species levels. This reflects the limitations of
14 PeerJ PrePrints | https://dx.doi.org/10.7287/peerj.preprints.934v1 | CC-BY 4.0 Open Access | rec: 27 Mar 2015, publ: 27 Mar 2015
accurately classifying short marker-‐gene sequences, but indicates that some
307
methods/configurations (detailed below) are superior for handling short reads. Using
308
longer read lengths and less conserved marker genes, these performance differences may
309
become more or less distinct. Thus, methods should be re-‐evaluated as sequencing
310
technologies continue to advance and longer read lengths become available. Our extensible
311
evaluation framework easily supports the addition test data sets, so these same method
312
benchmarks could be performed on updated test data in the future.
313
314
Performance also varied for fungal ITS and bacterial 16S rRNA sequences, indicating that
315
no method is universally superior across organisms and marker genes. SortMeRNA (with
316
optimized parameters, described below) delivered the most accurate fungal assignments to
317
species level, even outperforming RDP for recall and correlation coefficients. However, RDP
318
yielded better recall scores for bacterial sequences, indicating that performance depends
319
on the target marker gene (and its corresponding reference database). As next-‐generation
320
sequencing read lengths continue to grow, larger sections of the bacterial 16S rRNA and
321
other marker genes will become promising targets for amplicon sequencing but may
322
impact classifier performance. In addition, protein-‐coding genes have high potential for
323
strain-‐level and functional profiling of microbial communities, but likely alter classifier
324
behavior. Assignment methods should be re-‐evaluated for other existing and new marker
325
genes and continuously be re-‐optimized with each update in molecular targets and
326
sequence technology to maximize performance. Again, our extensible evaluation
327
framework will facilitate this process by easily supporting the addition of test data sets
328
based on alternate marker genes.
PrePrints
306
15 PeerJ PrePrints | https://dx.doi.org/10.7287/peerj.preprints.934v1 | CC-BY 4.0 Open Access | rec: 27 Mar 2015, publ: 27 Mar 2015
330
Optimal method selection ultimately depends upon the priorities of the end user. For
331
bacterial 16S rRNA and fungal ITS sequences, as analyzed here, no method is universally
332
superior under all conditions or for all evaluation metrics. For maximum precision and F-‐
333
measure scores, high-‐confidence RDP (c=1.0), UCLUST, and SortMeRNA perform best. For
334
top recall and correlation coefficients, lower-‐confidence RDP (c≤0.6) performs best. For a
335
consistent balance of recall and precision, UCLUST and medium-‐confidence RDP (c=0.4–
336
0.6) are reliable choices. For fungal ITS assignments, SortMeRNA performs best across all
337
metrics, though RDP, UCLUST, and BLAST also perform well. When runtime is an important
338
factor, such as with very large or high-‐diversity datasets, UCLUST performs faster than all
339
other methods benchmarked here. Based on assignment accuracies, mock community
340
reconstruction, computational runtime, simulated read classification, and availability of
341
source code and minimal licensing restrictions, we recommend using the SortMeRNA
342
classifier, with 0.51 consensus, 0.8 similarity, and a maximum 1 best alignment, 0.8
343
coverage, and an e value of 0.001. All methods tested here (and some additional methods)
344
are also included and configurable in QIIME 1.9.0 to support the needs of QIIME’s diverse
345
user base. The supplementary IPython Notebooks available in the project repository (and
346
for static viewing at http://bit.ly/srta-‐010) contain detailed results on all parameter
347
configurations tested here.
348
349
Our current evaluation framework is designed for comparison of taxonomy classifiers, but
350
the standardized mock communities and evaluation metrics would be equally useful for
351
optimizing other aspects of short-‐amplicon sequence analysis and is readily adaptable for
PrePrints
329
16 PeerJ PrePrints | https://dx.doi.org/10.7287/peerj.preprints.934v1 | CC-BY 4.0 Open Access | rec: 27 Mar 2015, publ: 27 Mar 2015
this purpose. This includes bioinformatics processing steps, such as quality filtering (14),
353
OTU picking (19), paired-‐end and overlapping read alignment, and chimera filtering. The
354
evaluation framework could also allow comparison of bench techniques that impact
355
microbial detection, such as sample storage/handling (20), DNA extraction (20), PCR (21),
356
library preparation, sequencing platforms/technologies, reagent contamination (22), and
357
technical precision by individual users, between users, and between laboratories. Any pre-‐
358
sequencing comparisons would require the generation of new, standardized mock
359
communities, but these would in turn enrich our growing database of mock communities, a
360
public asset that will support ongoing improvements in sequence analysis techniques, and
361
could easily be added to our evaluation framework.
362
363
The optimal methods for taxonomic assignment of a given marker gene or sequencing
364
technology is unlikely to generalize across marker genes or sequencing technologies. The
365
evaluation framework used here is not specific to a single marker gene, but instead
366
provides immediately applicable information for optimizing taxonomic assignment of 16S
367
and ITS sequences generated on the Illumina platforms, and can be adapted to the rapidly
368
evolving needs of the next-‐generation sequencing community. Our evaluation framework
369
(Figure 1) facilitates iterative re-‐evaluation of these conditions as new classification
370
methods, sequencing read lengths, marker-‐gene targets, and sequencing chemistries are
371
released, and as additional metrics of performance are desired. We hope that this will
372
become a model for standardized, extensible evaluation frameworks for bioinformatics
373
method comparisons.
PrePrints
352
17 PeerJ PrePrints | https://dx.doi.org/10.7287/peerj.preprints.934v1 | CC-BY 4.0 Open Access | rec: 27 Mar 2015, publ: 27 Mar 2015
Acknowledgements
375
This work was supported in part by the 2014 Kinsella Memorial Award (NAB), NIH P50
376
GM068763 (PJT and CFM), NSF IGERT grant number 1144807 (DM), and the NIH and the
377
Howard Hughes Medical Institute (RK).
378
Author Contributions
PrePrints
374
379
NAB, JRR, RK, and JGC conceived and designed the experiments, JRR, NAB, JP, EK, ZE, and
380
JGC designed and wrote software and analysis pipelines, and NAB performed the
381
experiments and data analysis. DM provided reference database support. CFM and PJT
382
provided mock community B7-‐B8 sequencing data, and BW and RJD provided mock
383
community F1-‐F2 sequencing data. NAB, JRR, RK, and JGC wrote the manuscript.
384
385
Methods
386
Data availability
387
Sequence data used in this study are publicly available in the Qiita database
388
(http://qiita.microbio.me/) under the study identities listed in Supplementary Figures 1
389
and 6. Raw data are also available via links our GitHub repository:
390
https://github.com/gregcaporaso/short-‐read-‐tax-‐assignment/blob/master/data/raw-‐
391
data-‐urls.txt. All other data generated in this study, and all new software, is available in our
18 PeerJ PrePrints | https://dx.doi.org/10.7287/peerj.preprints.934v1 | CC-BY 4.0 Open Access | rec: 27 Mar 2015, publ: 27 Mar 2015
GitHub repository under the BSD license. Our GitHub repository can be found at:
393
https://github.com/gregcaporaso/short-‐read-‐tax-‐assignment.
394
Data Analysis
395
All analyses were performed using QIIME 1.9.0 on the QIIME 1.9.0 AWS Virtual Machine
396
Image (AMI: ami-‐ea2a7682) and the taxonomy classifier comparison workflow hosted on
PrePrints
392
397
GitHub: https://github.com/gregcaporaso/short-‐read-‐tax-‐assignment (commit: accc0a8).
398
Static versions of all of our analysis notebooks, which contain all code and analysis results,
399
can be viewed at http://bit.ly/srta-‐010. All specific notebooks referenced below can be
400
viewed via this page.
401
Mock communities
402
Mock communities analyzed in this study were generated by 10 separate sequencing runs
403
on the Illumina GAIIx (n = 2), HiSeq2000 (n = 5), and MiSeq (n = 4) (Supplementary Figure
404
1). These consisted of genomic DNA from known species isolates deliberately combined at
405
defined rRNA copy-‐number ratios (Supplementary Figure 1). These sequencing runs were
406
performed on different instruments at different sites—Illumina Cambridge Ltd (datasets
407
B4, B6), Broad Institute (datasets B3, B5), Washington University School of Medicine
408
(datasets B1-‐B2), and Harvard FAS Center Core Facility (datasets B7-‐B8, F1-‐F2)— with the
409
goal of assessing the impact of filtering parameters across a broad set of sequencing
410
conditions.
411
DNA extraction, PCR, and sequencing for all sequencing runs were described previously
412
(23). The only sample collections not published previously (mock communities F1-‐F2) had
19 PeerJ PrePrints | https://dx.doi.org/10.7287/peerj.preprints.934v1 | CC-BY 4.0 Open Access | rec: 27 Mar 2015, publ: 27 Mar 2015
DNA extracted using the PowerSoil kit (MoBio) according to manufacturer instructions.
414
PCR amplifications were performed in duplicate using primers ITS1-‐F (5’-‐
415
AATGATACGGCGACCACCGAGATCTACACTATGGTAATTCT CTTGGTCATTTAGAGGAAGTAA-‐
416
3’)
417
CAAGCAGAAGACGGCATACGAGATNNNNNNNNNNNNAGTCAGTCAGATGCTGCGTTCTTCATC
418
GATGC-‐3’) (23). Both oligonucleotides consisted of the actual primer sequence (boldface
419
text) with an Illumina adapter (italics), pad, and linker sequences (both underlined) and a
420
12-‐nt Golay error-‐correcting barcode (24) (represented by a poly-‐N region) in the reverse
421
primer. Reaction conditions consisted of denaturing at 98˚C for 3 min, followed by 30
422
cycles of 98˚C for 45 s, 50˚C for 30 s, and 72˚C for 45 s, followed by a final extension of 72˚C
423
for 5 min. Pooled amplicons were purified using the AMPure XP kit (Agencourt), quantified
424
with Picogreen reagent (Invitrogen), combined at equimolar ratios, and gel purified
425
(cutting out bands between 100-‐500 bp) using the Gel Gen Elute Gel Extraction kit (Sigma-‐
426
Aldrich) prior to sequencing.
427
428
Raw Illumina fastq files were de-‐multiplexed, quality-‐filtered, and analyzed using QIIME (v.
429
1.6.0-‐dev)(6). Reads were truncated at any site of more than three sequential bases
430
receiving a Phred quality score < 20, and any read containing ambiguous base calls or
431
barcode/primer errors were discarded, as were reads with < 75% (of total read length)
432
consecutive high-‐quality base calls (14). Operational taxonomic units (OTUs) were
433
assigned using the QIIME open-‐reference OTU-‐picking pipeline with the UCLUST-‐ref(7)
434
wrapper. After prefiltering sequences with > 60% dissimilarity from it’s closest match in
435
the reference database (listed below), sequences were clustered into OTUs based on their
PrePrints
413
and
ITS4
(5’-‐
20 PeerJ PrePrints | https://dx.doi.org/10.7287/peerj.preprints.934v1 | CC-BY 4.0 Open Access | rec: 27 Mar 2015, publ: 27 Mar 2015
closest match in the reference collection with greater than 97% pairwise nucleotide
437
sequence identity (97% ID). Sequences which failed to hit a sequence in the reference
438
database at 97% ID we subsequently clustered de novo. The cluster centroid for each OTU
439
was chosen as the OTU representative sequence.
440
Simulated communities
441
The simulated communities used here were derived from the reference databases using the
442
“Simulated community analyses / Simulated community generation” notebook in our
443
project repository. Beginning with a full reference database (either Greengenes or UNITE),
444
10% of the sequences were extracted at random and the corresponding primers were used
445
to simulate amplification and slice out either the full region between those primers (B1 and
446
F1) or the first 100 bases downstream (3’) of the forward primer (B2 and F2). The bacterial
447
primers used were 515F/806R (25), and the fungal primers used were BITSf/B58S3r (26).
448
The remaining 90% of the full-‐length database sequences were used as the “partial
449
reference” database, and all of the database sequences were used as the “full reference”
450
database. This process was performed in five iterations to generate twenty different
451
simulated communities (five each of B1, B2, F1 and F2).
452
453
Taxonomy classification
454
OTU representative sequences were classified taxonomically using QIIME-‐based wrappers
455
of the following taxonomy classifiers and confidence settings:
PrePrints
436
21 PeerJ PrePrints | https://dx.doi.org/10.7287/peerj.preprints.934v1 | CC-BY 4.0 Open Access | rec: 27 Mar 2015, publ: 27 Mar 2015
456
1.
Ribosomal Database Project (RDP) naïve Bayesian classifier(4), using
457
variable confidence thresholds (c) for taxonomic assignment between c = 0.0 to c = 1.0
458
in steps of 0.1.
459
2.
460
BLAST(5) using e-‐value thresholds (e) for taxonomic assignment of e = 1e-‐9,
0.001, and 10000.0.
461
3.
(f), similarity (s), best N alignments (b), coverage, and e value. See description below.
PrePrints
462
SortMeRNA(8) with the following parameters: minimum consensus fraction
463
4.
464
UCLUST(7) with the following parameters: minimum consensus fraction (f),
similarity (s), and maximum accepts (a). See description below.
465
Reference Databases
466
The bacterial and archaeal 16S rRNA reference sequence database for OTU picking and
467
taxonomy-‐classifier retraining was the Greengenes 13_8 16S rRNA gene database(17)
468
preclustered at 97% ID.
469
470
The fungal ITS reference sequence database for OTU picking and taxonomy-‐classifier
471
retraining was the UNITE+INSD database (9-‐24-‐12 release)(18) prefiltered at 97% ID, and
472
from which sequences with incomplete taxonomy strings and empty taxonomy annotations
473
(e.g., uncultured fungus) were removed, as described previously(26).
474
Runtime analyses
475
Taxonomy classifier runtimes were logged while performing assignments of the same
476
random subset of 16S rRNA sequences, following the workflow described above. All
22 PeerJ PrePrints | https://dx.doi.org/10.7287/peerj.preprints.934v1 | CC-BY 4.0 Open Access | rec: 27 Mar 2015, publ: 27 Mar 2015
runtimes were computed on a single AWS instance to control for runtime variance across
478
cloud instances, and only one assignment process was run at a time during runtime
479
benchmarking.
480
481
The exact commands used for runtime analysis are presented in the “Runtime analyses”
482
notebook in the project repository.
483
484
Performance analyses using mock and simulated communities
485
Precision, recall and F-‐measure are used for qualitative compositional analyses of mock
486
and simulated communities.
487
At a given taxonomic level, a taxonomic assignment is a:
PrePrints
477
○ true positive (TP), if that taxonomic assignment is present in the results and
488 489
in the mock community ○ false positive (FP), if that taxonomic assignment is present in the results, but
490 491
is not present in the mock community ○ false negative (FN), if a taxonomic assignment is not present in the results,
492 493
but is present the mock community ○ true negative (TN), if a taxonomic assignment is not present in the results,
494 495
and is not present the mock community
496
Classic qualitative methods for evaluating the retrieval of expected observations—in this
497
case expected taxa—are precision, recall, and F-‐measure. Here these are defined as:
23 PeerJ PrePrints | https://dx.doi.org/10.7287/peerj.preprints.934v1 | CC-BY 4.0 Open Access | rec: 27 Mar 2015, publ: 27 Mar 2015
○ Precision=TP/(TP+FP) or the fraction of taxonomic assignments that
498 499
actually matches members of the mock community ○ Recall=TP/(TP+FN) or the fraction of the mock community members that
500 501
were observed in the results
502
PrePrints
503
○ F-‐measure = 2 × Precision × Recall / (Precision + Recall) Thus, precision and recall represent the relative recovery of relevant observations and
504
expected observations, respectively. F-‐measure is the harmonic mean of both these scores,
505
providing a balanced metric for simultaneously considering each score as an overall
506
measure of accuracy. These three measures were used to evaluate the accurate recovery of
507
expected taxa in sequenced mock communities and simulated communities, without
508
regards to taxon abundance (i.e., qualitative).
509
Pearson and Spearman correlations are used for quantitative compositional analyses of
510
mock and simulated communities (15, 16). At a given taxonomic level, these compute the
511
correlation between the relative abundances of the taxa as predicted by the taxonomy
512
assigner, and the known community compositions.
513
Mock communities cannot be considered accurately assigned on the basis of detection of
514
expected species (i.e., qualitatively) alone. As defined collections of microbial species,
515
assignment accuracy must be judged both on recovery of expected taxa and on the
516
reconstruction of expected community composition. In other words, a good classification
517
method should identify the expected community members in their known abundances. We
518
compute this as the correlation between the relative abundances of observed taxa with
519
their expected abundances as added to the mock community. The ideal correlation (r = 1.0)
24 PeerJ PrePrints | https://dx.doi.org/10.7287/peerj.preprints.934v1 | CC-BY 4.0 Open Access | rec: 27 Mar 2015, publ: 27 Mar 2015
is highly unlikely under real-‐world conditions as, in addition to taxonomy
521
misclassifications, primer bias, contamination, PCR error, sequencing error, copy number
522
variation, and other procedural artifacts may all theoretically skew observations.
523
The exact commands used for the mock community and simulated community analyses are
524
presented in the “Mock community analyses” and “Simulated community analyses”
525
notebooks in the project repository.
PrePrints
520
526
527
UCLUST-‐based and sortmerna-‐based consensus taxonomy assigners
528
We introduce two new methods for taxonomic assignment, based on the uclust and
529
sortmerna software packages.
530
531
Our
532
(http://drive5.com/usearch/manual/utax_algo.html)) is available in QIIME 1.9.0
533
(assign_taxonomy.py and parallel_assign_taxonomy_uclust.py). Although UCLUST itself is
534
not open source or free, it is licensed for free use with QIIME. QIIME’s uclust-‐based
535
taxonomy assigner is open source, though it makes calls to uclust. Internal to QIIME, query
536
sequences are searched against the reference database with the command:
537
538
uclust -‐-‐libonly
539
-‐-‐allhits
540
-‐-‐id
541
-‐-‐maxaccepts
542
-‐-‐input
UCLUST-‐based
taxonomy
assigner
(which
differs
from
utax
25 PeerJ PrePrints | https://dx.doi.org/10.7287/peerj.preprints.934v1 | CC-BY 4.0 Open Access | rec: 27 Mar 2015, publ: 27 Mar 2015
-‐-‐lib
544
-‐-‐uc
545
546
The ma and similarity values (in addition to input-‐file-‐* and output-‐file-‐*) are specified by the
547
user.
548
Our sortmerna-‐based taxonomy assigner is also available in QIIME 1.9.0. sortmerna is open
549
source, as is the QIIME wrapper that adapts this for taxonomic assignment. Internal to
550
QIIME, query sequences are searched against the reference database with the command:
551
552
sortmerna -‐-‐ref ,
553
-‐e
PrePrints
543
554
-‐-‐aligned
555
-‐a 1
556
-‐-‐print_all_reads
557
-‐-‐log
558
-‐-‐blast 3
559
-‐-‐reads
560
-‐v
561
-‐-‐best
562
563
The e-‐value and max-‐num-‐results values (in addition to input-‐file-‐* and output-‐file-‐*) are specified
564
by the user.
565
566
Both of these classifiers can potentially return up to max-‐num-‐results database hits per
567
query sequence. Taxonomic classification of query sequence is then performed by
568
computing a consensus assignment from those query results. This is achieved by starting at
26 PeerJ PrePrints | https://dx.doi.org/10.7287/peerj.preprints.934v1 | CC-BY 4.0 Open Access | rec: 27 Mar 2015, publ: 27 Mar 2015
the highest taxonomic level (domain, in Greengenes for example) and determining if the
570
classification at that level is present in at least min_consensus_fraction of the query results,
571
where min_consensus_fraction is a user-‐defined value (default is 0.51, based on the results of
572
our analyses). If so, the query sequence is given that classification at that level, and the
573
classification of the query results are compared at the next taxonomic level. Once a
574
classification is identified that is not present in at least of the min_consensus_fraction query
575
results, the taxonomic classification for the query sequence is truncated. For example, if a
576
query sequence q1 hit to three query results in the reference database with the
577
classifications:
578
d__Bacteria; p__Proteobacteria; c__Alphaproteobacteria
579
d__Bacteria; p__Proteobacteria; c__Gammaproteobacteria
580
d__Bacteria; p__Cyanobacteria; c__Oscillatoriophycideae
581
if min_consensus_fraction was 0.51, q1 would be classified as d__Bacteria; p__Proteobacteria.
582
583
584
585
586
587
588
589
590
PrePrints
569
27 PeerJ PrePrints | https://dx.doi.org/10.7287/peerj.preprints.934v1 | CC-BY 4.0 Open Access | rec: 27 Mar 2015, publ: 27 Mar 2015
592
References
593 594 595 596 597 598 599 600 601 602 603 604 605 606 607 608 609 610 611 612 613 614 615 616 617 618 619 620 621 622 623 624 625 626 627 628 629 630 631 632
1. Human Microbiome Project C. A framework for human microbiome research. Nature. 2012;486(7402):215-‐21. 2. Gilbert J, Jansson J, Knight R. The Earth Microbiome project: successes and aspirations. BMC Biology. 2014;12:69. 3. Bentley DR, Balasubramanian S, Swerdlow HP, Smith GP, Milton J, Brown CG, et al. Accurate whole human genome sequencing using reversible terminator chemistry. Nature. 2008;456(7218):53-‐9. 4. Wang Q, Garrity GM, Tiedje JM, Cole JR. Naive Bayesian classifier for rapid assignment of rRNA sequences into the new bacterial taxonomy. Applied and Environmental Microbiology. 2007;73(5261-‐5267). 5. Altschul SF, Gish W, Miller W, Myers EW, Lipman DJ. Basic local alignment search tool. J Mol Biol. 1990;215(3):403-‐10. 6. Caporaso JG, Kuczynski J, Stombaugh J, Bittinger K, Bushman FD, Costello EK, et al. Qiime allows analysis of high-‐throughput community sequence data. Nature Methods. 2010;7(5):335-‐6. 7. Edgar RC. Search and clustering orders of magnitude faster than BLAST. Bioinformatics. 2010;26(19):2460-‐1. 8. Kopylova E, Noe L, Touzet H. SortMeRNA: fast and accurate filtering of ribosomal RNAs in metatranscriptomic data. Bioinformatics. 2012;28(24):3211-‐7. 9. Ragan-‐Kelley B, Walters WA, McDonald D, Riley J, Granger BE, Gonzalez A, et al. Collaborative cloud-‐enabled tools allow rapid, reproducible biological insights. ISME J. 2013;7:461-‐4. 10. Brown CT, Howe A, Zhang Q, Pyrkosz AB, Brom T. A Reference-‐Free Algorithm for Computational Normalization of Shotgun Sequencing Data. arXiv. 2012:arXiv:1203.4802. 11. Nowakowski P, Ciepiela E, Harężlak D, Kocot J, Kasztelnik M, Bartyński T, et al. The collage authoring environment. Procedia Computer Science. 2011;4:608-‐17. 12. Wilson G, Aruliah DA, Brown CT, Chue Hong NP, Davis M, Guy RT, et al. Best practices for scientific computing. PLoS Biology. 2014;12(1):e1001745. 13. Perez F, Granger BE. IPython: A System for Interactive Scientific Computing. Computing in Science and Engineering. 2007;9(3):21-‐9. 14. Bokulich NA, Subramanian S, Faith JJ, Gevers D, Gordon JI, Knight R, et al. Quality-‐ filtering vastly improves diversity estimates from Illumina amplicon sequencing. Nature Methods. 2013;10(1):57-‐9. 15. Pearson K. Notes on regression and inheritance in the case of two parents. Proceedings of the Royal Society of London. 1895;58:240-‐2. 16. Spearman C. The proof and measurement of association between two things. Amer J Psychol. 1904;15:72-‐101. 17. McDonald D, Price MN, Goodrich J, Nawrocki EP, DeSantis TZ, Probst A, et al. An improved Greengenes taxonomy with explicit ranks for ecological and evolutionary analyses of bacteria and archaea. ISME J. 2012;6(3):610-‐8.
PrePrints
591
28 PeerJ PrePrints | https://dx.doi.org/10.7287/peerj.preprints.934v1 | CC-BY 4.0 Open Access | rec: 27 Mar 2015, publ: 27 Mar 2015
18. Kõljalg U, Nilsson RH, Abarenkov K, Tedersoo L, Taylor AFS, Bahram M, et al. Towards a unified paradigm for sequence-‐based identification of Fungi. Molecular Ecology. 2013;22:5271–7. 19. Rideout JR, He Y, Navas-‐Molina JA, Walters WA, Ursell LK, Gibbons SM, et al. Subsampled open-‐reference clustering creates consistent, comprehensive OTU definitions and scales to billions of sequences. PeerJ. 2014;2:e545. 20. Wu GD, Lewis JD, Hoffmann C, Chen YY, Knight R, Bittinger K, et al. Sampling and pyrosequencing methods for characterizing bacterial communities in the human gut using 16S sequence tags. BMC Microbiology. 2010;10:206. 21. Suzuki MT, Giovannoni SJ. Bias caused by template annealing in the amplification of mixtures of 16S rRNA genes by PCR. Applied and Environmental Microbiology. 1996;62:625-‐30. 22. Salter SJ, Cox MJ, Turek EM, Calus ST, Cookson WO, Moffatt MF, et al. Reagent and laboratory contamination can critically impact sequence-‐based microbiome analyses. BMC Biology. 2014;12:87. 23. Caporaso JG, Lauber CL, Walters WA, Berg-‐Lyons D, Lozupone CA, Turnbaugh PJ, et al. Global patterns of 16S rRNA diversity at a depth of millions of sequences per sample. Proceedings of the National Academy of Sciences of the United States of America. 2011;108:4516-‐22. 24. Hamady M, Walker JJ, Harris JK, Gold NJ, Knight R. Error-‐correcting barcoded primers for pyrosequencing hundreds of samples in multiplex. Nature Methods. 2008;5(3):235-‐7. 25. Caporaso JG, Lauber CL, Walters WA, Berg-‐Lyons D, Huntley J, Fierer N, et al. Ultra-‐ high-‐throughput microbial community analysis on the Illumina HiSeq and MiSeq platforms. ISME J. 2012;6:1621-‐4. 26. Bokulich NA, Mills DA. Improved Selection of internal transcribed spacer-‐specific primers enables quantitative, ultra-‐high-‐throughput profiling of fungal communities. Applied and Environmental Microbiology. 2013;79(8):2519-‐26. 27. McDonald D, Clemente JC, Kuczynski J, Rideout JR, Stombaugh J, Wendel D, et al. The biological observation matrix (BIOM) format or: how I learned to stop worrying and love the ome-‐ome. Gigascience. 2012;1(1):7.
665
666
667
668
669
670
671
PrePrints
633 634 635 636 637 638 639 640 641 642 643 644 645 646 647 648 649 650 651 652 653 654 655 656 657 658 659 660 661 662 663 664
29 PeerJ PrePrints | https://dx.doi.org/10.7287/peerj.preprints.934v1 | CC-BY 4.0 Open Access | rec: 27 Mar 2015, publ: 27 Mar 2015
672
Tables/Figures
673
Table 1. Comparisons of Optimized Method Performance For Species Assignment
674
Across Simulated Community Datasets, Ordered Best to Least
675
Count UCLUSTd SortMeRNAd BLASTd RDPd Bestc Full Precision UCLUST 0.51:0.8:1 12 -‐ 0.79 0.19 0.00 SortMeRNA 0.51:0.8:1:0.8:1.0 5 0.79 -‐ 0.11 0.00 BLAST 0.001 3 0.19 0.11 -‐ 0.00 RDP 0.1 0 0.00 0.00 0.00 -‐ Recall UCLUST 0.51:0.8:1 9 -‐ 0.20 0.02 0.03 RDP 0.1 5 0.03 0.03 0.09 -‐ SortMeRNA 0.51:0.8:1:0.8:1.0 4 0.20 -‐ 0.06 0.03 BLAST 0.001 2 0.02 0.06 -‐ 0.09 F UCLUST 0.51:0.8:1 12 -‐ 0.55 0.03 0.00 SortMeRNA 0.51:0.8:1:0.8:1.0 6 0.55 -‐ 0.02 0.00 BLAST 0.001 2 0.03 0.02 -‐ 0.00 RDP 0.1 0 0.00 0.00 0.00 -‐ Partial Precision RDP 0.3 10 0.20 0.46 0.65 -‐ SortMeRNA 0.51:0.8:1:0.8:1.0 10 0.00 -‐ 0.48 0.46 BLAST 0.001 0 0.00 0.48 -‐ 0.65 UCLUST 0.51:0.8:1 0 -‐ 0.00 0.00 0.20 Recall RDP 0.3 10 0.18 0.60 0.03 -‐ SortMeRNA 0.51:0.8:1:0.8:1.0 7 0.39 -‐ 0.00 0.60 UCLUST 0.51:0.8:1 3 -‐ 0.39 0.35 0.18 BLAST 0.001 1 0.35 0.00 -‐ 0.03 F RDP 0.3 10 0.14 0.63 0.16 -‐ SortMeRNA 0.51:0.8:1:0.8:1.0 6 0.01 -‐ 0.03 0.63 UCLUST 0.51:0.8:1 4 -‐ 0.01 0.22 0.14 BLAST 0.001 0 0.22 0.03 -‐ 0.16 aDatabase indicates whether comparisons were made using the full-‐ or partial reference sequence database.
676
bThe optimal parameter configuration tested in the between-‐method comparisons. See Table 2 for details.
677
cCount best indicates the number of times that method configuration was ranked the best method, across all
678
iterations of each simulated community.
679
dColumns represent Wilcoxon P values comparing precision, recall, and F-‐metric scores for each optimized
680
method across all simulated datasets.
681
PrePrints
Databasea Metric
Method
Configurationb
30 PeerJ PrePrints | https://dx.doi.org/10.7287/peerj.preprints.934v1 | CC-BY 4.0 Open Access | rec: 27 Mar 2015, publ: 27 Mar 2015
682
Table 2. Within-‐Method Parameter Optimization Across Simulated Community
683
Datasets Using Partial Reference Database, Ordered By F-‐Measure
PrePrints
Method SortMeRNA
RDP
UCLUST
BLAST
Configurationa 0.51:0.8:1:0.8:1.0 1.0:0.8:1:0.8:1.0 0.76:0.8:1:0.8:1.0 0.76:0.8:1:0.9:1.0 1.0:0.8:1:0.9:1.0 0.51:0.8:1:0.9:1.0 1.0:0.9:1:0.9:1.0 1.0:0.9:1:0.8:1.0 0.51:0.9:1:0.8:1.0 0.51:0.9:1:0.9:1.0 1.0:0.8:5:0.9:1.0 1.0:0.8:5:0.8:1.0 0.76:0.9:1:0.8:1.0 0.76:0.9:1:0.9:1.0 1.0:0.8:3:0.9:1.0 0.3 0.5 0.6 0.4 0.7 0.0 1.0 0.1 0.51:0.8:1 0.76:0.8:1 1.0:0.8:1 0.51:0.9:1 0.76:0.9:1 1.0:0.9:1 0.51:0.8:3 1.0:0.8:5 0.76:0.8:3 0.76:0.8:5 1.0:0.8:3 1.0:0.9:5 0.51:0.9:3 1.00E-‐09 0.001 1.00E+04
Precision 0 0 0 0 0 0 0 0 0 0 9 9 0 0 4 0 0 0 0 0 0 20 0 0 0 0 0 0 0 0 8 5 5 5 2 0 20 6 6
Recall 20 20 20 20 20 20 0 0 0 0 0 0 0 0 0 0 0 0 0 0 20 0 1 19 19 19 1 1 1 0 0 0 0 0 0 0 12 20 20
F-‐measure 10 10 10 10 10 10 9 9 9 9 0 0 9 9 0 6 5 4 3 2 0 0 0 8 8 8 6 6 6 5 0 0 0 0 0 1 19 7 7
Mean 10.0 10.0 10.0 10.0 10.0 10.0 3.0 3.0 3.0 3.0 3.0 3.0 3.0 3.0 1.3 2.0 1.7 1.3 1.0 0.7 6.7 6.7 0.3 9.0 9.0 9.0 2.3 2.3 2.3 1.7 2.7 1.7 1.7 1.7 0.7 0.3 17.0 11.0 11.0
31 PeerJ PrePrints | https://dx.doi.org/10.7287/peerj.preprints.934v1 | CC-BY 4.0 Open Access | rec: 27 Mar 2015, publ: 27 Mar 2015
aParameter configurations used for classification. RDP = confidence threshold; BLAST = e-‐
685
value threshold; SortMeRNA = minimum consensus fraction (f):similarity (s):best N
686
alignments (b):coverage:e value; UCLUST = minimum consensus fraction (f):similarity
687
(s):and maximum accepts (a). E.g., “SortMeRNA 0.51:0.8:1:0.8:1.0” indicates 0.51 minimum
688
consensus fraction, 0.8 similarity, 1 best alignment, 0.8 coverage, and e-‐value threshold =
689
1.0.
PrePrints
684
32 PeerJ PrePrints | https://dx.doi.org/10.7287/peerj.preprints.934v1 | CC-BY 4.0 Open Access | rec: 27 Mar 2015, publ: 27 Mar 2015
Key
Developer's pipeline
Data file
Assign taxonomy to sequences
Data store (GitHub repository) Mock community sequences (fasta)
Process Add taxonomy to BIOM files (e.g., using biom%add(metadata)
Decision
PrePrints
me: method par: parameter setting(s)
Mock community tables w/ tax. (BIOM)
Simulated community tables w/ tax. (BIOM)
Simulated community sequences (fasta)
Mock community tables with no taxonomy (BIOM) Simulated community tables with no taxonomy (BIOM)
Mock community evaluations Qualitative and quantitative composition analyses.
Simu. community evaluations
Qualitative composition analyses.
Runtime analyses.
me
F
par
(s)
c0.5
1.2
e0.01
47.9
c0.9
99.9
c0.8
99.7
Mock community tables with taxonomy (BIOM)
Mock community expected composition
Simulated community tables with taxonomy (BIOM)
F Simulated community expected composition
Evaluation framework (open source code in GitHub)
Optimize or abandon
No
Does new method out-perform existing methods?
Yes
Issue pull request against the data store (hosted on GitHub) to submit BIOM tables for future comparisons
Publish method and software
690
691
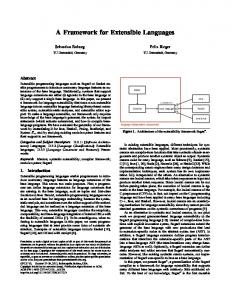
Figure 1. Evaluation framework for new taxonomic assignment methods. We provide test
692
data and an evaluation framework, facilitating the benchmarking of future methods for
33 PeerJ PrePrints | https://dx.doi.org/10.7287/peerj.preprints.934v1 | CC-BY 4.0 Open Access | rec: 27 Mar 2015, publ: 27 Mar 2015
short read taxonomy assignment in the context of the results presented here. All mock-‐
694
community and natural-‐community test data are provided in our data store (hosted on
695
GitHub). The developer of a new method can assign taxonomy to these test data and
696
generate BIOM(27) files (green). Those BIOM files can then be passed to the evaluation
697
framework, where they will be compared to pre-‐computed BIOM files from the data store
698
(red and blue) based on three evaluations of accuracy of the taxonomic assignments. If the
699
new method does not outperform the pre-‐computed results, it should be abandoned or
700
optimized before an attempt is made to apply or publish it. If it does out-‐perform the pre-‐
701
computed results, it indicates that the developer should pursue publication of the method.
702
Finally, the developer can submit their best BIOM tables to the data store using the GitHub
703
Pull Request mechanism, so a comparison against their methods will be included in future
704
evaluations by other method developers.
PrePrints
693
34 PeerJ PrePrints | https://dx.doi.org/10.7287/peerj.preprints.934v1 | CC-BY 4.0 Open Access | rec: 27 Mar 2015, publ: 27 Mar 2015
PrePrints 705
706
Figure 2. Taxonomy classifier selection critically shapes assignment accuracy of mock
707
communities. Violin plots illustrate the distribution of precision, recall, F-‐measure, Pearson
708
r, and Spearman rho values across all mock communities and all parameter configurations
709
for a given method for family-‐level (left), genus-‐level (middle), or species-‐level taxonomy
710
assignments (right). Heavy dashed lines indicate median values, fine dashed lines indicate
711
quartiles.
35 PeerJ PrePrints | https://dx.doi.org/10.7287/peerj.preprints.934v1 | CC-BY 4.0 Open Access | rec: 27 Mar 2015, publ: 27 Mar 2015
PrePrints 712
36 PeerJ PrePrints | https://dx.doi.org/10.7287/peerj.preprints.934v1 | CC-BY 4.0 Open Access | rec: 27 Mar 2015, publ: 27 Mar 2015
Figure 3. Taxonomy classifier configuration and mock community composition alter
714
assignment accuracy at genus-‐level. Heatmaps indicate the precision, recall, F-‐measure,
715
Pearson r, and Spearman rho values for taxonomy classification of each mock community
716
(columns) by each method configuration (rows). The shade of the intersecting box
717
indicates the score for a given evaluation metric, as indicated in the color keys on the right.
718
Bacterial mock communities B1-‐B8 are on the left side of each panel; Fungal mock
719
communities F1-‐F2 appear on the right side of each panel. Parameters: e = BLAST e-‐value; c
720
= confidence; f = minimum consensus fraction; d = similarity; b = best N alignments; a =
721
maximum accepts. Not all SortMeRNA parameters/configurations are marked, as different
722
coverage and e values did not measurably influence any scores. See the pre-‐computed
723
repository results for fully annotated plots: http://bit.ly/srta-‐010.
PrePrints
713
37 PeerJ PrePrints | https://dx.doi.org/10.7287/peerj.preprints.934v1 | CC-BY 4.0 Open Access | rec: 27 Mar 2015, publ: 27 Mar 2015
PrePrints 724
38 PeerJ PrePrints | https://dx.doi.org/10.7287/peerj.preprints.934v1 | CC-BY 4.0 Open Access | rec: 27 Mar 2015, publ: 27 Mar 2015
Figure 4. Taxonomy classifier configuration alters assignment accuracy of simulated
726
communities. Simulated reads were generated by randomly selecting 10% of the sequences
727
from the reference sequence databases (Greengenes for bacteria, UNITE for fungi);
728
taxonomy classifications were then made using either the full reference database (full
729
reference) or the remaining 90% of the sequences as the reference database (partial
730
reference). Heatmaps indicate the precision (P), recall (R), and F-‐measure (F) values for
731
taxonomy classification of each simulated community (columns) by each method
732
configuration (rows) at species levels. The shade of the intersecting box indicates the score
733
for a given evaluation metric, as indicated in the color key on the right. Bacterial simulated
734
communities B1-‐B2 are on the left side of each panel; Fungal simulated communities F1-‐F2
735
appear on the right side of each panel. B1 and F1 represent classifications of full-‐length
736
sequences, B2 and F2 represent classifications of simulated 100 nt sequencing reads. Four
737
iterations for each classifier are shown for each simulated community. Parameters: e =
738
BLAST e-‐value; c = confidence; f = minimum consensus fraction; d = similarity; b = best N
739
alignments; a = maximum accepts. Not all SortMeRNA parameters/configurations are
740
marked, as different coverage and e values did not measurably influence any scores. See
741
the pre-‐computed repository results for fully annotated plots: http://bit.ly/srta-‐010.
PrePrints
725
39 PeerJ PrePrints | https://dx.doi.org/10.7287/peerj.preprints.934v1 | CC-BY 4.0 Open Access | rec: 27 Mar 2015, publ: 27 Mar 2015
PrePrints
742
743
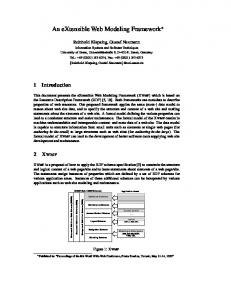
Figure 5. Classifier choice influences computational runtime. A) Computational runtime for
744
each classifier was tested as a function of query sequence count. Subsets of query
745
sequences were classified against a single reference sequence database. As total runtime
746
includes reference database indexing time (y-‐intercept), the slope of these curves is the
747
best indicator of query sequence classification time. Note, full BLAST results are not shown
748
due to the steep slope relative to other methods. B) Computational runtime as a function of
749
reference sequence count. A single query sequence was classified against increasingly large
750
subsets of the reference sequence database to determine the how reference database size
751
influences database indexing time for each classifier.
752
753
754
40 PeerJ PrePrints | https://dx.doi.org/10.7287/peerj.preprints.934v1 | CC-BY 4.0 Open Access | rec: 27 Mar 2015, publ: 27 Mar 2015