A statistical approach to reduce malware inside an Information System in Banking Sector Gustavo A Valencia-Zapata, Juan C Salazar-Uribe, Ph.D. Escuela de Estadística, Universidad Nacional de Colombia-Sede Medellín
[email protected],
[email protected]
Abstract— The aim of this article is to illustrate the first stages of the implementation of a statistical model to dose antivirus scans in an information system in banking sector (IS). As a result, IS is strengthened by increasing malware detection and by decreasing malware attacks inside the bank. In an IS there are many components which help to build a dosage model. The IS´s components are applications such as antivirus, web filtering, Human Capital/Resource Management (HCM), and Configuration Management Database (CMDB). A CMDB provides technical information about the computer population (i.e., hard disk, operating system and so on).We can establish an analogy of some of these components with some other components from an epidemiological system which allows building the statistical model. For instance: the patients can be seen as computers into the bank network, and the malware can be seen as diseases in a population. We use this analogy to build a statistical model based on both survival analysis and data mining methods. With this modeling strategy we identify a risk profile in the IS which allows to dose the antivirus scan in a more effective way. Keywords: Malware, Survival Analysis, Missing Values, Data Mining, CART.
I. INTRODUCTION
T
research is intended to be a resource to improve the information security levels in banking sector (IS). The research question is: How malware incidence can be decreased in an IS? As in human epidemiologic context is necessary to apply treatments (medicine, vaccines, therapies, etc.), on a computer environment would be the application of scanning. Based on that, we can reformulate the above question as: How antivirus scans (medical tests) can be dosed, in our population (computer network), for the reduction of malware (disease) incidence in banking IS? Different approaches have been made in modeling „disease‟ for Information Technology (IT) environment, using some analogies with the epidemiologic context [1]. In this sense, an exponential growth of malware has been observed in the last decades, as well as, the outlook and limitations of epidemiological concepts for malware prevention [1]. Also, malware spreading and measurements models had been elaborated [2], [3], [4]. Similarly, simulation of the networking topology influence in malware problems had been discussed by [5], [6]. Finally, epidemiological methodologies are used to estimate growth and propagation of worms in a network [7]. HIS
Anti-virus software A
CMDB B
Active Directory C
Web filtering software Data Mining Software
D
HCM software E
Fig. 1. Information collection stages. TABLE I CMDB PARAMETERS
Variable
Meaning/value
Type
Unit
Class
Laptop, CPU or server
Nominal NA
Brand
Computer brand
Nominal NA
Computer_Age
Operating time
Scale
Processor_Type
Type of computer processor
Nominal NA
Processor_Clock
The speed of a computer processor Scale
GHz
Processors
Number of processors
Integer
Count
Memory (RAM)
Memory size
Scale
GB
Week
Operation_System Operation System (OS)
Nominal NA
Service_Pack
Updates to a OS
Nominal NA
Hard_Disk
Hard disk size
Scale
GB
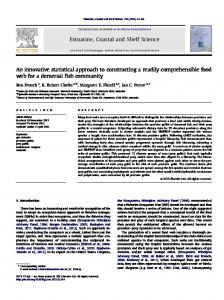
In this paper the first stages to build the model are: information extraction (IE), handling missing values, and statistics analysis. The main information source is the bank antivirus software. Secondary information sources are: web filtering, HCM (company employees), and CMDB. Physiological computer information is provided by CMDB such as: brand, operating system, processor type, random access memory (RAM), and so on. CMDB parameters are showed in Table I. Using data mining software (through Open Database Connectivity, ODBC) we collect information about malware attacks over a period of eleven weeks. Then, secondary sources information is added as can be seen in
Figure 1. Around 18.22% of CMDB data (infected computers) are missing values. Classification and Regression Trees (CART) are used for handling missing values (imputation) to avoid losing valuable information. This research used nonparametric Statistical tests for checking the quality of the imputed data. Moreover, statistical analysis is conducted to select variables that will be included into the antivirus scanning dosage model. II. INFORMATION COLLECTION STAGES A. Antivirus Software In this stage, amount and type of malware per computer are identified. Information over a period of eleven weeks about 8476 computers was collected. Antivirus software reports the active user account when malware was detected and some other technical information of the computer. The Table II shows the parameters reported by the Antivirus Software. B. CMDB Here, technical information about computers is identified as well as its relationship with user´s account. Table III shows CMDB variables, percent completed valid and missing records. This information is used to assess the influence of these variables over detected malware levels. TABLE II ANTIVIRUS SOFTWARE PARAMETERS
Variable
Meaning/value
Type
Units
Week
Time unit (1 to 11)
Integer
Count
Total_Malware
Number of malware per week
Integer
Count
Level_Malware
Level of malware per week
Nominal
NA
TABLE III CMDB DATAQUALITY
TABLE IV WEB FILTERING SOFTWARE
Variable
Meaning/value
Type
Units
Adult
Number of adult websites
Integer
Count
Security
Number of security websites
Integer
Count
Entertainment
Number of entertainment websites
Integer
Count
Games
Number of game websites
Integer
Count
Unblocked
Number of websites unblocked
Integer
Count
Blocked
Number of websites blocked
Integer
Count
Browse_Time
Internet browse time
Continuous
Minute
C. Active Directory At this point, the user‟s privileges are identified. For example: adding a user to the Local Administrator Group or some user accounts are allowed to use USB devices. In this way, privileges acquaintance is important to establish whether or not these variables have some influence over malware levels. D. Web Filtering Software At this step, user account is related to web surfing, identifying variables such as: number and type of blocked websites, web surfing time, etc. The main purpose of studying this association is to establish if web surfing behavior has influence on malware levels. The parameters for the Web Filtering Software are shown in Table IV. E. HCM Software In this stage, employee information is identified. Collected information such as position and work area is used to assess the influence of these variables over detected malware levels. III. CMDB DATA IMPUTATION
Percent Completed
Valid Records
Missing Records
Class
83.483
7076
1400
Brand
83.483
7076
1400
Computer_Age
81.784
6932
1544
Processor_Type
99.493
8433
43
Processor_Clock
99.493
8433
43
Processors
99.493
8433
43
Memory (RAM)
99.493
8433
43
Operation_System
99.493
8433
43
Service_Pack
99.457
8430
46
Hard_Disk
99.493
8433
43
Variable
A. Classification and Regression Trees, CART CART model is explained in detail in [8]. The classification and regression trees (CART) method was suggested by Breiman et al. [8]. According to Breiman, the decision trees produced by CART are strictly binary, containing exactly two branches for each decision node. CART recursively partitions the records with similar values for the target attribute. The CART algorithm grows by conducting for each decision node, an exhaustive search of all available variables and all possible splitting values, selecting the optimal split according to the following criteria [9].
Let be a measure of the “goodness” of a candidate split s at node , where (1) Split parameters are defined in Table V. One of the major contributions of CART was to include a fully automated and effective mechanism for handling missing values [10]. Decision trees require a missing value-handling mechanism at three levels: (a) during splitter evaluation, (b) when moving the training data through a node, and (c) when moving test data through a node for final class assignment [11].
B. Handling Missing Values through Classification and Regression Trees
TABLE V SPLIT PARAMETERS
Parameter
According to [11], regarding (a), the later versions of CART (the one we use) offers a family of penalties that reduce the improvement measure to reflect the degree of missingness. (For example, if a variable is missing in 20% of the records in a node then its improvement score for that node might be reduced by 20%, or alternatively by half of 20%, and so on.) For (b) and (c), the CART mechanism discovers “surrogate” or substitute splitters for every node of the tree, whether missing values occur in the training data or not. The surrogates are thus available, should a tree trained on complete data be applied to new data that includes missing values.
Meaning Left child node of node Right child node of node
Ten variables were imputed (Table III), that is, ten CART were used, a CART for each variable, which together make up a classification and regression forest. The imputation was made using PASW® Modeler (a data mining software). Model training was made with complete data and then, this trained model was applied to missing values. Table VI and Table VII show a nonparametric statistics test called McNemar Test for Significance of Changes [12], which evaluated model prediction by using complete data. In this case E_Class is the imputed value and Class is the real value. For instance, 5013 (99.6%) computers with Class equal to CPU were classified correctly by CART, and 2002 (99.3%) computers with Class equal to Laptop were classified correctly by the same CART. The formulated hypotheses for McNemar test (2-sided) were: Class is not changed after
TABLA VI CONTINGENCY TABLE CLASS
imputation. Class was changed after
E_Class Total
imputation. According to this analysis we cannot reject the null hypothesis, that is, CART doesn‟t change Class values after imputation (p-value=0.396). Figure 2 Shows a CART model for Class variable that was built using the software PASW® Modeler. In particular, Table VIII shows the variables for the computer number 0022. We can identify three out of ten variables with missing values. Node 0 indicates that CPU category has the higher probability (0.7) to be selected if a random imputation is conducted. On the other hand, Laptop variable has a smaller probability (0.28) than the first one and the Server variable has null probability (0.0). As can be seen, we should slide through CART's branches according to the values of the variables shown in Table VIII.
CPU
Laptop
CPU
5.013
20
5.033
Laptop
14
2002
2.016
5027
2022
7049
Class Total
TABLA VII CHI-SQUARE TEST
Value
Exact Sig. (Twosided)
McNemar Test
1.058
0.392
Nº Valid Cases
7049
Use binomial distribution
Class Node 0 Nominal
% 0.00 70.74 28.94 0.32 100.00
CPU Laptop Server Total
n 0 2229 912 10 3151
Processor_Clock Improvement=0.31
2,56
Node 1 Nominal
Node 2 % 0.00 16.41 83.50 0.09 34.43
CPU Laptop Server Total
n
Nominal
0 178 906 1 1085
% 0.00 99.27 0.29 0.44 65.57
CPU Laptop Server Total
Processor_Type Improvement=0.06
n 0 2051 6 9 2066
P08, P10, P23, P29, P37
P01, P02, P03, P04, P05, P06, P07, P09, P11, P12, P13, P14, P15, P16, P17, P18, P19, P20, P21, P22, P24, P25, P26, P27, P28, P30, P31, P32, P33, P34, P35, P36 Node 3 Nominal CPU Laptop Server Total
Node 4 % 0.00 1.06 98.94 0.00 26.98
n
Nominal
0 9 841 0 850
CPU Laptop Server Total
% 0.00 71.91 27.66 0.43 7.46
n 0 9 65 1 235
Memory Improvement=0.03
3.36
Node 9 Nominal CPU Laptop Server Total
Node 10 % 0.00 98.83 0.58 0.58 5.43
n
Nominal
0 169 1 1 171
CPU Laptop Server
Fig. 2. CART Model for variable Class.
Total
% 0.00 0.00 100.00 0.00 2.03
n 0 0 64 0 64
As Processor_Clock is less or equal than 2.56 GHz, then, Node 1 branch is selected. As Processsor_Type is P27, Node 3 branch is then selected. The final node (Node 3) indicates that CPU category has lower probability (0.01) and Laptop category has higher probability (0.98) than CPU. As a consequence, Class variable will be imputed as being Laptop (this imputation process is done with 99% confidence). In contrast, in random sampling imputation the result for the Class would be CPU as this category has the greater frequency.
TABLE IX KRUSKAL-WALLIS TEST
Rank
Computer_Age
N
Mean Rank
1
265
743,36
IV. ANTIVIRUS SCANNING DOSAGE STATISTICS MODEL
2
224
559.9
Following the imputation process we implement statistical analysis to assess the influence of these variables over malware levels inside an IS. In this study we believe that malware level depends on variables such as: Processors (number of processor in the computer), Computer_Age and Browse_Time. To illustrate Table IX and Table X show the results of performing a nonparametric statistics test called Kruskal-Wallis [13], which evaluates the dependence between Malware_Level and Computer_Age. The hypotheses for this test were:
3
134
576,66
4
203
617,10
5
313
634,68
6
31
650,73
≥7
100
633,06
Total
1270
Malware_Level
TABLE X TEST STATISTICS
Computer_Age is not associated with Malware_Level.
Malware_Level
Some levels of Computer_Age are associated with Malware_Level. According to this test, we reject the null hypothesis (pvalue=0.000), implying that Computer_Age has substantial influence over Malware_Levels.
Chi-square
37
gl
6
Asymp.Sig.
0.000
Grouping Variable: Computer_Age
TABLE VIII COMPUTER 0022 – CMDB PARAMETERS
Variable
Meaning/value
Units
Class
Missing
NA
Brand
Missing
NA
Computer_Age
Missing
Week
Processor_Tipe
P27
NA
Processor_Clock
2.19
GHz
2
Count
Processors Memory (RAM)
2.14
GB
Operation_System
SO_7
NA
Service_Pack
SP_3
NA
Hard_Disk
80.02
GB
Table XI and Table XII show a nonparametric statistic test called Chi-Squared Test for Independence [13], which assess the dependence between Malware_Level and USB. The formulated hypotheses for this test were: Variable Malware_Level and USB are independent. Variable Malware_Level and USB are not independent. According to this test, we do not reject the null hypothesis (p-value=0.9090), implying that that Malware_Level and USB are independent. However, as a recommendation to improve security, disabling USB ports is an effective strategy for preventing information leakage.
TABLA XI CONTINGENCY TABLE MALWARE_LEVEL VS USB Malware_Level Total High
Medium
Low
Yes
170
834
210
1214
NO
7
40
9
56
177
874
219
1270
USB
Total
TABLE XII CHI-SQUARE TEST
Value
gl Asymp.Sig, 2-sided
Pearson Chisquare
0.191
2
0.909
LRT
0.195
2
0.907
N
1270
Fig. 3.Kaplan-Meier Survival curve for Processors.
The Kaplan-Meier is used for estimating the survival function from life-time data [13]. To use this strategy we define the following outcome: Elapsed time to first malware infection in a computer. The goal is to compare the survival experiences of four processor types. Figure 3 shows the Kaplan-Meier curves associated to each the four Processor types. Survival curves show, for each time plotted on the X axis, the portion of all computers surviving at that time.
The Table XIII shows the Log-Rank Test to compare the survival distribution of two groups (we have four groups so we have to conduct six comparisons). The null hypothesis being tested is that there is no overall difference between the two survival curves. Computers with two processors showed statistical differences when they were compared with computers that had one, four, and eight processors, respectively (p-values=0.018, 0.00, 0.05). That means the computers with two processors were infected faster than other computers with different number of processors.
TABLE XIII PAIRWISE COMPARISONS
1 Processor Processors
ChiSquare
Sig.
2 Processors ChiSquare 5.58
4 Processors
8 Processors
Sig.
ChiSquare
Sig.
ChiSquare
Sig.
0.018
0.303
0.582
1.334
0.248
258.19
0.000
3.847
0.05
0.730
0.393
Log Rank
1 Processor
(MantelCox)
2 Processors
5.58
0.018
4 Processors
0.303
0.582
258.19
0.000
8 Processors
1334
0.248
3.847
0.05
0.73
0.393
[6]
V. CONCLUSION AND FUTURE WORK By using both standard statistical methodology and data mining we were able to explore the association between different variables and the malware levels in an IS. It is important to highlight that we used real data to perform all the analysis. These results may affect the malware scanning policy in a bank. On the other hand, missing values appear frequently in the real world, especially in business-related databases, such as in an IS inside a banking sector, and the need to deal with them is a vexing challenge for all statisticians and data mining modelers. One of the major contributions of CART was to include a fully automated and effective mechanism for handling missing values. CART Models, as were presented here, are more suitable for handling missing values than imputation through random sampling. Currently, data mining efficiently integrate large amounts of data stored in repositories and allows us to discover meaningful new correlations, patterns and trends by using pattern recognition. This is a competitive research advantage for business companies. The statistical and mathematical techniques are essential to data mining for built and check models, it means, statistical tests give more confidence on the results from data mining models. Thus in our case, we evaluated the quality of CART model for handling missing values with different nonparametric statistical tests. The observed results favored this statistical strategy. Future directions of this work include performing additional statistics analysis such as recurrence analysis and formulation of survival models through Cox-Models. This also will allow identifying significant variables to optimize the malware scanning policy in an IS as well as measure its effect size. ACKNOWLEDGMENT The authors wish to thank Juan Carlos Correa from School of Statistics of the Universidad Nacional de Colombia at Medellín for helpful feedback that contributed to improve this manuscript. Also the authors thank the Security Team of the Bank Company for their continuous encouragement and support. REFERENCES [1]
[2] [3]
[4]
[5]
Weiguo J, “Applying Epidemiology in Computer Virus Prevention: Prospects and Limitations”, 2010. Thesis, Computer Science, University of Auckland. Bailey, N.J.T, “The Mathematical Theory of Infectious Diseases and Its Applications” 1975, New York: Oxford University Press. Kephart J, and White S, “Directed-Graph Epidemiological Models of Computer Viruses", IEEE Computer Symposium on Research in Security and Privacy, Proceedings, pp. 343–359, May 1991. Kephart J, and White S, “Measuring and Modeling Computer Virus Prevalence, Research in Security and Privacy”, 1993, Proceedings, 1993 IEEE Computer Society Symposium on, pp. 2–15, May 1993. Kephart, J, “How Topology Affects Population Dynamics” in Langton, C.G. (ed.) Artificial Life III. Reading, MA: Addison-Wesley, 1994.
[7]
[8] [9]
[10] [11]
[12] [13]
Pastor-Satorras, R. and Vespignani, A, “Epidemic Dynamics and Endemic States in Complex Networks”. Barcelona, Spain: Universitat Politecnica de Catalunya, 2001. Rishikesh P, “Using Plant Epidemiological Methods To Track Computer Network Worms”, 2004. Thesis, Computer Science, Virginia Polytechnic and State University. Daniel T. Larose, “Discovering Knowledge in Data. An introduction to data mining” 2005. John Wiley & Sons, Inc Leo Breiman, Jerome Friedman, Richard Olshen, and Charles Stone, “Classification and Regression Trees”, 1984. Chapman & Hall/CRC Press. Vipin Kumar, “The Top Ten Algorithms in Data Mining”, 2009. Chapman & Hall/Crc. Quinlan, R, “Unknown attribute values in induction”. In Proceedings of the Sixth International Workshop on Machine Learning, 1989 pp. 164–168. Conover, “Practical Nonparametric Statistics”, 1999. John Wiley & Sons, Inc Hosmer Jr, D.W. and Lemeshow. “Applied Survival Analysis: Regression Modeling of Time to Event Data”, 1999. John Wiley Sons,