SEPTEMBER 1997
CARTER AND ELSNER
515
A Statistical Method for Forecasting Rainfall over Puerto Rico M. M. CARTER
AND
J. B. ELSNER
Department of Meteorology, The Florida State University, Tallahassee, Florida (Manuscript received 5 January 1996, in final form 14 April 1997) ABSTRACT Using results from a factor analysis regionalization of nontropical storm convective rainfall over the island of Puerto Rico, a statistical methodology is investigated for its potential to forecast rain events over limited areas. Island regionalization is performed on a 15-yr dataset, while the predictive model is derived from 3 yr of surface and rainfall data. The work is an initial attempt at improving objective guidance for operational rainfall forecasting in Puerto Rico. Surface data from two first-order stations are used as input to a partially adaptive classification tree to predict the occurrence of heavy rain. Results from a case study show that the methodology has skill above climatology—the leading contender in such cases. The algorithm also achieves skill over persistence. Comparisons of forecast skill with a linear discriminant analysis suggest that classification trees are an easier and more natural way to handle this kind of forecast problem. Synthesis of results confirms the notion that despite the very local nature of tropical convection, synoptic-scale disturbances are responsible for prepping the environment for rainfall. Generalizations of the findings and a discussion of a more realistic forecast setting in which to apply the technology for improving tropical rainfall forecasts are given.
1. Introduction and motivation Tropical convection is notoriously difficult to forecast. The value of such forecasts is large, however, due to the potential for flooding and mudslides. This is particularly important in the Tropics where rainfall can be locally intense. A conditionally unstable atmosphere and an abundance of low-level heat and moisture combine with forcing mechanisms, such as sea-breeze fronts, to explain the contingency of tropical rainfall. As an example, one of the greatest problems facing weather forecasters in Hawaii is the prediction of heavy rainfall and its associated flash floods (Kodama et al. 1995). Here we demonstrate a technology that holds promise in providing useful objective guidance for operational forecasters predicting tropical rainfall. The procedure involves a recently developed modification of the standard tree-structured classification method. Classification trees have been successfully applied to the problem of forecasting lake-effect snowfalls (Burrows 1991). The present test case is based on data from the eastern third of the island of Puerto Rico. Currently there is little in the way of objective guidance to aid forecasters in the prediction of tropical convection over limited spatial scales. In Puerto Rico, for instance, a WSR-88D Doppler radar is used in an an-
Corresponding author address: Matthew M. Carter, Department of Meteorology, The Florida State University, Tallahassee, FL 323063034. E-mail:
[email protected]
q 1997 American Meteorological Society
ecdotal capacity but is not continually in operation at the San Juan Weather Service Forecast Office (WSFO). Furthermore, high-resolution mesoscale numerical models are not available to forecasters in San Juan to provide guidance on a convective scale. The finest resolution model is the 29-km Eta Model, which covers the island with only eight grid points (S. Bennett 1996, personal communication). It is hoped that the model developed in this study will advance mesoscale forecasting. The utility of purely objective guidance is the independence from forecast experience or the skill of the forecaster (Ramage 1993). This can help stabilize the overall operational forecast performance of a WSFO in the event of staff turnover. The paper is divided into two main parts. First a summary of the important results of a factor analysis regionalization of convective rainfall over Puerto Rico is given, followed by an example of how the technology of classification trees can be used to build a statistical prediction model. Specifically, a description of the available data is given in section two, followed in section three by details of the rainfall regionalization. Section four is a description of the predictors chosen for the forecast model. Section five contains details of the classification tree used with results of a limited prediction study presented in section six. The paper ends with a summary and a discussion in section seven. We stress that this work is preliminary and it is meant to alert the operational forecast community to the utility of classification trees for developing objective forecast guidance. It is by no means the final word and, as is
516
WEATHER AND FORECASTING
FIG. 1. Stations in Puerto Rico that record rainfall on an hourly basis.
usual in statistics, it is often best to try several different empirical approaches. 2. Data The primary interest of this study is summertime convective rainfall. Therefore, only the months of May through September are considered. The study is based on two principal datasets: hourly rainfall from a network of stations and conventional hourly surface observations. The U.S. National Climate Data Center records data for 22 stations in Puerto Rico on an hourly basis. Rainfall is collected in Fischer–Porter gauges distributed throughout the island, represented by the dots in Fig. 1. Because the gauges automatically record their contents, they may be placed in remote and mountainous regions of the island with little maintenance. All hourly rainfall amounts are in tenths of an inch, except for San Juan WSFO and Benavente-Hormigueros, which report in a resolution of one-hundredth of an inch. The rainfall data record includes the summer months for the years 1973–88, for a total of 55 080 h. Hours for which rainfall amounts were not reported are removed from the original dataset, as are hours influenced by hurricanes and tropical storms. Tropical cyclones produce widespread, torrential amounts of rain. In 1996, Hurricane Hortense produced catastrophic flooding in the small rivers and tributaries of Puerto Rico. Because the spatial and temporal scales of rainfall associated with tropical cyclones are resolved by several forecast models at the Tropical Prediction Center, it is felt that the skill of our algorithm for predicting such rainfall would not approach that of the dynamical model products. For this reason, hurricanes and tropical storms are removed from the dataset. The forecast region for the predictive model developed in this study is the populous eastern third of the island. This designation is not entirely heuristic; it represents three convective regions of the island that exhibit similar diurnal rainfall frequencies, as will be shown in
VOLUME 12
section 3. Although all rainfall recording stations are incorporated into the factor analysis that regionalizes the island, only the 11 stations that compose the eastern third of Puerto Rico are used for designing a prediction algorithm. Hourly surface data for San Juan WSFO and Roosevelt Roads were retrieved from National Center for Atmospheric Research dataset ds472.0. The surface data encompass summer months May through September for the years 1977–79. Although the San Juan record is quite comprehensive, Roosevelt Roads surface data since 1980 does not contain mean sea level pressure, information used in building this prediction model. Fifteen summers (55 080 h, May through September, 1973–88) of hourly rainfall data are used in regionalizing the island of Puerto Rico. The surface dataset is not this extensive, so the hourly rainfall dataset used to construct the prediction algorithm was pared to match that of the surface data (3 yr). Next, we choose one hour from each day [0800 AST (Atlantic standard time)] to initialize the statistical model. The potential maximum number of hours we can use to build our prediction model is 459 (153 summer days times 3 yr). Rainfall parameters, such as 12-h area-wide total, are calculated as possible predictors for day in the developmental sample. Then surface and rainfall data are matched chronologically so that for each day in the 3-yr period a complete data line is available. Any day that has missing information is discarded. All 12 h of rainfall data previous to 0800 AST must be present to fully complement the initialization hour. Each piece of missing persistence data effectively eliminates 1 of the 459 days. Data was more likely to be missing at Roosevelt Roads than at San Juan, curtailing the number of initialization hours. Therefore, from a possible 459 initialization hours, 125 are used in the model building phase of our study. Each month in the 3-yr period is represented by an initialization hour. Each of the 3 yr is well represented: 1977 has 30 initialization hours, 1978 has 53, and 1979 has 42. In part because we only have 125 prediction hours, we verify the stability of our results through cross validation, described in section 6. 3. Regionalization The island of Puerto Rico is on a horizontal scale of a hundred kilometers. Synoptic-scale phenomena occur on a scale of a thousand kilometers, an order of magnitude larger. Large-scale midlatitude frontal passages do not occur during the summertime in Puerto Rico. Therefore, regions on the island that exhibit distinct variance signatures seek to capture rainfall forcings on the mesoscale. Such phenomena include, but are not limited to, sea breezes, mountain-top convection, orographic rain, and standing gravity waves. Passing easterly waves may also be included in this category. Though on the mesoscale, the horizontal scale of sum-
SEPTEMBER 1997
CARTER AND ELSNER
517
mertime rain phenomena is sufficiently large to encompass multiple stations. The average distance of proximal stations is only 10.7 km. Therefore, it is reasonable to suggest that several stations may share a common rainfall variance signature. This provides the impetus for identifying common regions of convective rainfall on this rather small tropical island. We identify regions of mesoscale rainfall variance through the analysis of variance technique of factor analysis. We present the salient features of factor analysis while a complete description of the factor analysis regionalization is given in Carter and Elsner (1996). A more rigorous treatment of the factor analysis model is also presented in appendix A of this paper. In contrast to the commonly employed principal component analysis, factor analysis starts with the assumption of an underlying basic model for the data. This model is given as S 5 LLT 1 C, where S is the population covariance matrix, L is the matrix of common factor loadings (the superscript T denotes the matrix transpose), and C is the matrix of covariances of the specific factors. Shared variance among two or more rainfall stations is called communality and appears as a component in the matrix L. For instance, Several coastal stations may exhibit rainfall variance due to a sea breeze. This communality is manifest in one component of L. One of those coastal stations may further display a rainfall variance due to a very localized forcing, such as a nearby mountain peak. This peak does not affect the other stations, nor can it explain away the shared sea-breeze effect. It is an additive forcing of the rainfall variance for that particular station. This added variance appears in the vector ci, which is the specific factor component of C for station i. Each station has a unique component in C, while each common region has a component in L. The goal is to determine the common factor loadings that relate individual stations to a shared variance signature. The loadings will determine to some extent to which region a particular rainfall station belongs based on covariance relationships between all other stations. This is accomplished by a spectral decomposition of the sample correlation matrix computed from the hourly rainfall amounts at each of the 22 stations. A key decision to make in any factor analysis is how many common factors are necessary to best describe the covariance relationships among the variables. It is important that the sampling method for selecting the hourly rainfall is stable with respect to adjacent eigenvalues. A first-order approximation is given by perturbing the empirical orthogonal functions and calculating error bars for each estimated eigenvalue. If the error bars of adjacent eigenvalues overlap, then ‘‘effective degeneracy’’ occurs, with one estimation of the eigenvalues leading to a particular linear combination, and a second estimation leading to another (North et al. 1982). Over-
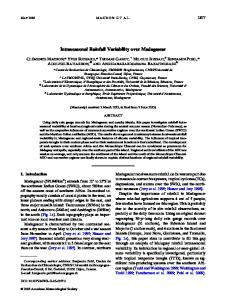
FIG. 2. Scree plot showing the 22 eigenvalues of the sample correlation matrix. The dashed line represents the 95% significance line from a Monte Carlo simulation of white noise. Nine of the 22 eigenvalues are above the significance line.
lapping will occur when the upper bound of an eigenvalue error interval exceeds the lower bound of its previous eigenvalue error interval. In other words, if (li 1 dli) . (li21 2 dli21), where li and dli are the eigenvalue and eigenvalue shift, respectively, for station i, then effective degeneracy may occur. For our sample size of 55 080, only the error bars of eigenvalues 21 and 22 overlapped. Even if we restrict the degrees of freedom to 2295 by treating each day as independent, only eigenvalues 21 and 22 had an overlap in their error bars. Since it is not pragmatic to characterize the variance of 22 rainfall stations with 20 regions, we develop a more stringent criteria to choose the number of factors in our regionalization. A Monte Carlo procedure that provides an upper bound on the number of statistically significant factors is used. The eigenvalues are plotted in Fig. 2. By spectrally decomposing 100 randomly generated surrogate rainfall data matrices, we choose the fifth largest eigenvalue for each mode to represent the 95% significance level (Overland and Presendorfer 1982; Elsner and Tsonis 1991). This significance level, which is based on the assumption of white noise, is shown as the dashed line in Fig. 2. The leading nine original data eigenvalues exceed this significance level and thus provide an upper bound on the number of factors to retain. Because we found nine modes to be significant with respect to white noise, each rainfall recording station does not by itself represent a unique rainfall region (if it did, all 22 modes would be significant). Stations may be grouped into regions, as long as the number of regions does not exceed nine. The significance test provides an important ‘‘first guess’’ as to how many factors should be considered in the analysis. Additionally, we employ an orthogonal rotation that
518
WEATHER AND FORECASTING
FIG. 3. Geographic regionalization of Puerto Rico based on a factor analysis (with an orthogonal rotation of the loadings) of summertime convective rainfall. Data are hourly rainfall amounts from 22 stations (dots) for the months of May–September over the years 1973–88 with hours influenced by tropical storms and hurricanes removed. Percentages reflect the relative contribution of each region to the hourly rainfall variance on Puerto Rico.
has the property of conserving the inner product of the loading vectors (columns of L) and geometrically represents a rigid rotation about the coordinate axis (Kreyszig 1993). Rotation helps to reveal simple structure in the data. The rotated factor loadings may be plotted pairwise on an x–y axis (not shown). Simple structure occurs when the pairs align along the coordinate axes, indicating that a station is loading heavily on one factor and lightly on the rest (Carter and Elsner 1996). We choose a varimax rotation, performing the calculations through the FROTA subroutine of the International Mathematical and Statistical Library (IMSL). Using the white noise significance test and orthogonal rotation as guides, we now proceed to regionalize Puerto Rico. We apply the factor analysis model for each m in the intervals 1 through 9 and carefully examine the factor loadings. We want to find an m for which all 22 stations optimally load on only one factor. It is the magnitude of the factor loadings that will determine the regions, since they are contributing to the common variance. We call stations that load heavily on two or more common factors ‘‘freeloading’’ stations since they are free to load on more than one factor. Stations that do not significantly load on any common factor are called ‘‘homeless’’ stations, since they cannot be placed in a region based upon simple threshold criteria. We call the sum of freeloading and homeless stations the ‘‘nonsingularity sum.’’ If every station loaded above a predetermined threshold on only one factor, this sum would be zero and little subjectivity would be required. This is what we strive to achieve. In such a case, the only subjectivity lies in our initial choice of a loading threshold. More common, however, are analyses where some stations load on more than one common factor, while others load on none at all. In other words, the nonsin-
VOLUME 12
FIG. 4. The number of rainfall events for the summer months of May–September over the period 1973–88 is plotted for each hour of the day. Hours 24 through 30 represent ‘‘wraparound’’ times corresponding to 0000 through 0600 AST. A rainfall event is defined as any recorded amount of 0.25 cm or more occurring at any station within a region. Rainfall associated with tropical storms and hurricanes is excluded.
gularity sum is almost always greater than zero. In our study, we found that a factor analysis with a choice of m 5 six factors provided the smallest nonsingularity sum. Based upon our loading threshold criteria, only three stations had to be placed subjectively because of their nonsingularity. For the three nonsingular stations, we draw the line on (or very close to) their locations. The regionalization using six common factors is shown in Fig. 3. The six regions point to important physical mechanisms that force precipitation over the island and indicate that the factor analysis model is sensitive to variations in weather regimes (Carter and Elsner 1996). Since our goal is to identify homogeneous rainfall regions to be used as forecast model targets, we seek characteristics of the rainfall regions that make the development of predictive algorithms tractable. We begin by examining the diurnal variability of precipitation in each of the six regions. This is done by considering the empirical probability of measurable precipitation for each hour. Figure 4 shows the frequency of rainfall (again excluding rainfall from tropical storms and hurricanes) for each hour of the day for each of the six regions. Factors 1, 3, and 5, characterized by low-amplitude frequency maxima and minima, show small hourly variability. The ratio of maximum frequency to minimum frequency is greatest for region 5 and is no greater than 2.2:1. More importantly, the frequency maxima tend to occur in early morning. These factors correspond to regions on the island’s eastern third. Factors 2, 4, and 6, on the other hand, have definitive afternoon frequency maxima. The ratio of maximum frequency to minima
SEPTEMBER 1997
519
CARTER AND ELSNER
TABLE 1. Predictor variables used to build the statistical forecast models in this study. Label
Predictor variable
X1 X2 X3 X4 X5 X6
San Juan surface wind (u component) m s21 Roosevelt Roads surface wind (u component) m s21 San Juan sea level pressure anomaly mb Roosevelt Roads sea level pressure anomaly mb San Juan sea level pressure anomaly tendency mb 12 h21 Roosevelt Roads sea level pressure anomaly tendency mb 12 h21 Eleven station composite: % stations reporting rain during previous hour Eleven station composite: past 12-h total rainfall
X7 X8
FIG. 5. Cumulative relative frequency distribution of 12-h total precipitation from the 11 rainfall stations in the eastern third of Puerto Rico. The period considered is from 0800 to 2000 AST during the months of May–September for the years 1973–88 excluding rainfall from tropical storms and hurricanes.
frequency exceeds 2.5:1 for all three of these regions and for region 4 is greater than 17:1. Factors 2, 4, and 6 compose the western two-thirds of the island. We distinguish this dichotomy first by the temporal occurrence of the frequency maxima and second by the amplitude of these maxima. Based on their hourly frequency signatures, the island may be further separated into two larger regions: a western and an eastern region. Summarizing, the common factor analysis divided Puerto Rico into six distinct regions of hourly rainfall variability, and the empirical hourly rainfall probability reveals a dichotomy of diurnal variability. The forecast target for building the prediction model is the eastern ‘‘superregion,’’ comprised of convective regions 1, 3, and 5. Since we target the 11 station total precipitation over the 12-h period from 0800 to 2000 AST for developing the prediction algorithms below, here we present a brief rainfall climatology of this region. Only days on which all stations were reporting each hour over the period 1973–88 (May–September) were used in the climatology. There are a total of 1529 rainfall values. The minimum 12-h total is zero and this occurred 24% of the time. The maximum total is 75.0 cm. The average 12-h rainfall total over the eastern superregion is 3.5 cm with a standard deviation of 6.9 cm. The cumulative frequency distribution is shown in Fig. 5. 4. Selecting the predictors We now attempt to build a prediction algorithm for daytime convective rainfall. On many conditionally un-
stable days, convective rainfall is on a small enough scale that it may not reach a rain gauge in the vicinity of the shower. Only rainfall that falls into the gauge will appear in the record, even if it is raining heavily nearby. This aspect of convective rainfall makes it very difficult to predict. This is especially true in Puerto Rico during the summer because variations in such variables as temperature, dewpoint, and wind direction are small on a diurnal basis. Predicting for an entire rainfall region instead of a single point is more reflective of the prevailing convective forcing. Large-scale disturbances are often responsible for creating an environment favorable for rain in the Tropics. Predictors based on a physical understanding are the most natural candidates for producing a successful forecast model (Ramage 1993). We choose a set of eight variables that we feel are important in setting up a favorable convective environment. This is done by first considering the following potential predictors. R Surface winds: Tropical waves and diurnal sea breezes change the wind speed and direction, and may have a significant effect on convective rainfall in Puerto Rico (Gere Gallup, personal communication). R Sea level pressure anomalies: Tropical waves and their attendant moisture are often characterized by an inverted trough in the pressure field. Mean sea level pressure is calculated for each hour of the day throughout the entire data record. The appropriate mean is subtracted from each hourly sea level pressure value to give the anomaly. In this way, the semidiurnal pressure oscillation is removed. R Sea level pressure anomaly tendencies: The pressure tendency determines whether the tropical wave is approaching or departing the region. The net change in sea level pressure anomaly is calculated over the 12 h previous to 0800 AST. R Past rainfall: Persistence can often be an important parameter in short-range weather forecasting. These variables are considered as potential predictors. From them, and based on data availability from both San Juan and Roosevelt Roads, we extract eight predictors (Table 1) for building the prediction model. We note that this is a small subset of variables and includes
520
WEATHER AND FORECASTING
no upper-air, no satellite, and no radar information. It does, however, provide a starting point for evaluating prediction technologies. We add that a stepwise linear regression (not shown) using data from San Juan and a larger set of potential predictors also identified the above variables as the most important predictors. The exclusion of upper-air humidity variables in the predictor set implies that their predictive information is contained within the persistence rainfall variables. Since we seek to predict daytime convective rain, our predictor data is taken only at 1200 UTC (0800 AST). This is the time at which we initialize the model. The predictand data is taken from rainfall over the period from 1200 UTC (0800 AST) to 0000 UTC (2000 AST). 5. Classification trees To develop an effective set of prediction rules for forecasting convective rainfall, we desire that the method have several characteristics to ensure its usefulness and validity. Among the most important of these considerations is that the methodology allow for statistical significance testing by way of cross validation, allow for nonfunctional relationships between predictor variables and the predictand, and provide useful and easily interpretable results. Methods such as linear programming do not allow for statistical validation of the results, while purely statistical methods like regression and discriminant analysis do not easily allow for nonfunctional relationships. Therefore, to create a set of prediction rules for convective rainfall, we experiment with a statistical classification algorithm known as partially adaptive classification trees, or PACT (Shih 1993). PACT unifies the multivariate statistical methodology of linear discriminant analysis (LDA; Mardia et al. 1979) and tree-structured classification methods (CART; Breiman et al. 1984). As will be discussed, PACT combines the advantages of both methodologies and meets the desired criteria specified above. We note that among classification methods the algorithm chosen here is not unique; however, it is quite simple to implement and yields satisfactory results for the purposes here. Readers wishing to investigate other classification methods are encouraged to refer to Breiman et al. (1984) and Hand (1981). Here, Q is the universe of J disjoint subsets, A1, . . . , Aj, that may be expressed by Q 5