applied sciences Article
A Stochastic Bi-Level Scheduling Approach for the Participation of EV Aggregators in Competitive Electricity Markets Homa Rashidizadeh-Kermani 1 , Mostafa Vahedipour-Dahraie 1 , Hamid Reza Najafi 1, *, Amjad Anvari-Moghaddam 2 ID and Josep M. Guerrero 2 ID 1 2
*
Department of Electrical & Computer Engineering, University of Birjand, 9856 Birjand, Iran;
[email protected] (H.R.-K.);
[email protected] (M.V.-D.) Department of Energy Technology, Aalborg University, 9220 Aalborg East, Denmark;
[email protected] (A.A.-M.);
[email protected] (J.M.G.) Correspondence:
[email protected]; Tel.: +98-56-32202049
Received: 4 October 2017; Accepted: 19 October 2017; Published: 24 October 2017
Abstract: This paper proposes a stochastic bi-level decision-making model for an electric vehicle (EV) aggregator in a competitive environment. In this approach, the EV aggregator decides to participate in day-ahead (DA) and balancing markets, and provides energy price offers to the EV owners in order to maximize its expected profit. Moreover, from the EV owners’ viewpoint, energy procurement cost of their EVs should be minimized in an uncertain environment. In this study, the sources of uncertainty—including the EVs demand, DA and balancing prices and selling prices offered by rival aggregators—are modeled via stochastic programming. Therefore, a two-level problem is formulated here, in which the aggregator makes decisions in the upper level and the EV clients purchase energy to charge their EVs in the lower level. Then the obtained nonlinear bi-level framework is transformed into a single-level model using Karush–Kuhn–Tucker (KKT) optimality conditions. Strong duality is also applied to the problem to linearize the bilinear products. To deal with the unwilling effects of uncertain resources, a risk measurement is also applied in the proposed formulation. The performance of the proposed framework is assessed in a realistic case study and the results show that the proposed model would be effective for an EV aggregator decision-making problem in a competitive environment. Keywords: bi-level stochastic programming; balancing market; conditional value at risk (CVaR); day-ahead (DA) market; electric vehicle (EV) aggregator
1. Introduction Due to the fast development of electric vehicle (EV) technology, optimal scheduling of EVs integration in the electricity trading floor is required. Several frameworks have been suggested to develop the decision-making of an EV aggregator in electricity markets [1,2]. In [3], an optimization method for aggregator’s participation in the day-ahead and secondary reserve is proposed. In [4] conditional value at risk (CVaR) is applied as a risk measurement in the decision-making process of a wind producer to confront the uncertainties in day-ahead (DA) and balancing markets. In [5], a stochastic model for energy and reserve scheduling considering risk management strategy is investigated. In [6], the impact of the market price and reserve market uncertainties via a stochastic programming structure is expressed to obtain the EV scheduling problem. Integrated scheduling of EVs and renewable resources in a microgrid is investigated in [7] in order to control the intermittency of renewable energy generations through the stored energy in EVs’ batteries. Coordination of charging schedules of EVs with the objective of minimizing the total charging cost while considering varying
Appl. Sci. 2017, 7, 1100; doi:10.3390/app7101100
www.mdpi.com/journal/applsci
Appl. Sci. 2017, 7, 1100
2 of 16
charging power of EVs is proposed in [8]. An aggregator-based interactive charging management scheme adopting interruptible load pricing is investigated in [9] in which the EV aggregator will respond to the load control command of the grid. An economic framework of responsive load based on the elasticity factor is proposed in [10] to schedule the energy and reserve of a microgrid in the presence of renewable energy resources and EVs. In some of the related literature the optimization of the aggregator’s expected profit is considered subject to the constraints related to the EVs’ demand [11]. Authors in [12] propose a stochastic model in which the bidding strategy of an EV aggregator in DA and reserve markets is optimized without considering any risk aversion. In [13], a stochastic optimization problem for participation of plug-in EVs in electricity markets considering value at risk (VaR) as a measurement tool is investigated. A plug-in EV charging load is formulated in [14] to assess the influence of EVs on urban distribution networks. The authors in [15] tried to model the market price uncertainties to obtain fixed pricing, time-of-use pricing and real-time pricing by a retailer in a smart grid. In [16] a stochastic aggregated model of the EVs exchanging energy is formulated and the EVs’ reaction to the stochastic balancing requests is presented. Also, the influence of vehicle-to-grid (V2G) service features of balancing contract is discussed. Optimal bidding strategies of EV aggregators in DA energy and ancillary services markets while considering renewable generation is proposed in [17] within a stochastic optimization model. Authors in [18] proposed a stochastic linear program for the participation of aggregator in DA and balancing markets while considering risk via CVaR terms and in [19] the authors discussed the effects of charging program of EVs on the grid. Since the EV aggregators can compensate the stochastic behavior of renewables or load forecasting errors, a cooperative game model has been presented in [20] to capture the interactions between utilities and parking lots in the spinning reserve market, considering the V2G scenario. EV aggregators could also form a non-cooperative game where they try to maximize their own profit in a competitive environment. Therefore, a given EV aggregator has difficulties making energy trading decisions and offering appropriate bids to the EV owners to make more profit. In this regard, a mathematical program with equilibrium constraints optimizing the aggregator’s decisions is proposed in [21] to determine the optimal profit and to minimize the charging cost paid by the final customers. However, the work does not consider the performance of rival aggregators. In [22], in contrast to what is commonly assumed, the aggregator is supposed to affect market prices. Also, the impact of the aggregator’s bids on prices is assessed using a bi-level problem, however the impact of the prices offered by other aggregators is not discussed. The problem of decision-making of the interaction between the parking lot and distribution system operator in a bi-level framework is provided in [23]. It gives a model for participation of parking lots in both energy and reserve markets in order to compensate renewable generation and load uncertainties. In [24], authors propose an integrated model of plug-in EVs and renewable distributed generators in a market floor where users can sell back the energy generated from their renewables or the energy stored in their plug-in EVs. In this paper, a bi-level stochastic model for the decision-making of an EV aggregator in a competitive electricity market is proposed. Then an equivalent single-level linear formulation based on the Karush–Kuhn–Tucker (KKT) optimality conditions and duality theory is used to combine the upper and lower levels. This concept has been applied to a hub manager problem in [25] and to a retailer problem in [26], previously. Here, this concept is extended to an EV aggregator decision-making problem while considering the reaction of EV owners to the selling prices offered by the aggregator and its rivals. The main contributions of this paper are as follows:
•
•
Proposing a stochastic bi-level model for the decision making of an EV aggregator in which the profit of the aggregator is maximized in the upper level and the cost paid by the EV owners is minimized in the lower level; Considering the reaction of consumers to the offered selling prices by the aggregators in a competitive environment;
Appl. Sci. 2017, 7, 1100
•
3 of 16
Considering risk aversion measurement to decrease the unfavorable influence of risk in the decision-making program. Appl. Sci. 2017, 7, 1100
3 of 16
The remaining sections of this paper are organized as follows: Section 2 describes the features Considering risk aversion measurement to decrease the unfavorable influence of risk in the of the problem; Sections 3 and 4 presents the problem formulation of the decision-making of an EV decision-making program. aggregator as a two-stage stochastic programming model; and Section 5 provides numerical results The remaining sections of this paper are organized as follows: Section 2 describes the features of and discussion. Finally, a relevant conclusion is drawn in Section 6. the problem; Section 3 and 4 presents the problem formulation of the decision-making of an EV aggregator as a two-stage stochastic programming model; and section 5 provides numerical results 2. Problem Description and discussion. Finally, a relevant conclusion is drawn in Section 6.
In this section the main characteristics of the problem of the decision-making of an EV aggregator Problem Description in DA2.and balancing market with considering the EV owners’ payments in a competitive environment are described. In this section the main characteristics of the problem of the decision-making of an EV aggregator in DA and balancing market with considering the EV owners’ payments in a competitive
2.1. Market Framework environment are described.
The decision-making problem of an EV aggregator is considered as a bi-level problem which 2.1. Market Framework involves two optimization parts. In the upper level, the aggregator participates in short-term trading The decision-making problem an EVtrading aggregator is considered asmarket a bi-level problem which the floors to maximize its expected profitoffrom energy in the DA and to minimize involves two optimization parts. In the upper level, the aggregator participates in short-term trading imbalance cost entailed in the balancing market. In the DA market, the energy transaction within floors to maximize its expected profit from trading energy in the DA market and to minimize the the next day is cleared. Then, due to the delay between the ending of the DA market and the time of imbalance cost entailed in the balancing market. In the DA market, the energy transaction within the the energy delivery, correcting actions should be performed to eliminate the differences between the next day is cleared. Then, due to the delay between the ending of the DA market and the time of the expected and the scheduled consumption that clearedtoineliminate the DA market. energy delivery, correcting actions should bewas performed the differences between the In fact, inand thethe balancing the deviation between theDA forecasted expected scheduledmarket, consumption that was cleared in the market. demand in DA and the expected In one near the balancing real time market, is compensated. Thereafter, in the lower-level, theinEV fact, in the the deviation between the forecasted demand DAowners and thetry to minimize theirone costs purchasing from the aggregator and also fromthe itsEV rivals. expected nearby the real time is energy compensated. Thereafter, in the lower-level, owners try to minimize their costs by purchasing energy from the aggregator from its rivals. The complexity of the decision-making problem is due toand thealso uncertainty in DA and balancing The complexity of the decision-making problem is due to the uncertainty in DA balancing market prices and EVs’ demand. In fact, the aggregator tries to buy energy from theand network and sell market prices and EVs’that demand. In fact, the to buy from the network it to the EV owners such it maximizes itsaggregator expected tries profit. So, energy the aggregator should and offersell selling it to the EV owners such that it maximizes its expected profit. So, the aggregator should offer selling prices to the EV owners such that they do not change their aggregator and go to its rivals and also, prices to the EV owners such that they do not change their aggregator and go to its rivals and also, the prices should not be too low which leads to lower profits. Figure 1 illustrates the upper and lower the prices should not be too low which leads to lower profits. Figure 1 illustrates the upper and levelslower of the problem. levels of the problem.
Figure 1. Bi-level framework of the problem.
Figure 1. Bi-level framework of the problem.
Appl. Sci. 2017, 7, 1100
4 of 16
2.2. Uncertainty Characterization When the aggregator wants to participate in a short term trading structure, it may face three sources of uncertainty including: DA prices, positive/negative balancing prices and EVs’ demand. These uncertainties are discretizednwith scenarios and the o vector of stochastic processes is represented as follows: Scenario ω =
DA , λ+,B , λ− B , E D λt,ω t,ω t,ω t,ω
t∈ T,
ω ∈Ω
DA , λ+,B , λ− B where, λt,ω t,ω t,ω
D are DA, positive/negative balancing prices and EVs’ demand at time t and scenario ω. and Et,ω Each scenario has a probability of occurrence ω, such that the sum of the probabilities over all scenarios is unity: ∑ p(ω ) = 1. ω ∈Ω
Moreover, it is assumed that the aggregator has a forecast of the expected demand of EVs. In addition, it is considered that EVs’ demand is correlated to DA prices. Thus, it is possible to generate EVs demand scenarios as follow [26]: " # DA − λ ˆ DA λt,ω t D D ˆ Et,ω = Et 1 + ∆( ) ∀t ∈ T, ∀ω ∈ Ω (1) λˆ tDA where, λˆ tDA is the expected DA price in period t and ∆ is a parameter representing the relationship between DA price and the EVs’ demand in each scenario ω that can be assumed as ∆ = 0.2 [26]. Based on the above equation, EVs’ demand at time t and scenario w is equal to the sum of the forecasted demand and an additional value that is variable with the DA price. Therefore, EVs’ demand at each scenario w is determined based on the DA price at that scenario. Here, historical data is used to generate DA and balancing price scenarios based on time series. The EVs’ demand is also obtained from (1). Then, for the sake of tractability of the problem, the size of the set of DA and positive/negative balancing price scenarios are reduced by scenario-reduction techniques [27]. Similarly, rival aggregators’ prices are also uncertain sources. The prices offered by rivals are considered as random variables, λs (ξ ), for a finite set of scenarios Ξ where ∑ υ(ξ ) = 1. ξ ∈Ξ
Scenario ξ = {λs1 (ξ ), λs2 (ξ ), . . . , λs (ξ )}, s ∈ S Here, the uncertainty associated with the prices offered by the rival aggregators is modeled with Probability Distribution Function (PDF) with the related standard deviation that is used to generate scenarios based on historical forecasting errors. In order to model the forecast inaccuracies stemming from the uncertain nature of offered prices by the rival aggregators, normal PDF is used [25]. In this case, the mean values are equivalent to the forecasted values of prices. Then the PDFs are divided into three discrete intervals with different probability levels as illustrated in Figure 2. The forecasted errors which correspond to the mentioned uncertain resources are obtained based on historical forecasting errors. These errors are considered within intervals equal to the standard deviation. The price forecasting state is centered as the base case and its forecasted errors as the standard deviations are considered with the other intervals. In order to model each probability level associated with the selling prices offered by the rival aggregators, the Roulette Wheel Mechanism (RWM) is used. Each interval throughout the RWM represents a specific forecasting error corresponding to the offered prices by the rivals. Then, the probabilities of the intervals on the Roulette Wheel are normalized such that their summation equals unity. To generate a scenario corresponding to each forecast error of the offered prices, first Monte Carlo simulation is used to generate a random number in the range of [0–1]. Each interval on the Roulette Wheel in which the generated random number falls corresponds to a scenario of the rival prices.
Appl. Appl.Sci. Sci.2017, 2017,7,7,1100 1100
5 5ofof1616
Figure 2.2. The probablity density function function corresponding corresponding to to the the forecasted forecasted errors errors ofof rival rival Figure aggregators′prices. prices. aggregators’
ProblemFormulation Formulation 3.3.Problem Theproblem problemassociated associatedwith withaggregator’s aggregator’sparticipation participation ininthe theDA DAand andbalancing balancingmarket marketisis The formulated as a bi-level problem as follows. formulated as a bi-level problem as follows. 3.1.Upper UpperLevel: Level:Aggregator’s Aggregator′sViewpoint Viewpoint 3.1. Theunderstudy understudy aggregator participates theand DAbalancing and balancing market to maximize its The aggregator participates in theinDA market to maximize its expected expected profit byEVs’ supplying EVs’ demand. This profit includesobtained the revenue from to selling profit by supplying demand. This profit includes the revenue fromobtained selling energy the energy to the owners andload frombased reducing load based on negative The upper EV owners andEV from reducing on negative imbalance prices.imbalance The upperprices. level problem is level problem is presented below: presented below:
∑
, ζ, ι(ω )
Maximize
∑
ch ch p(ωch ) chEt,ω λt,ωDA− t ∈ T t , t , t ,
DA , E+,B , E−,B Maximize p( ) E Et,ω t,ω t,ω , ω ∈Ω
DA
,B
, B
ch , Et , , Eλt ,ch ,,EE t , t,ω t,ω ch ch E ) , , , ( t , t ,
−
∑
h
t∈ T
h
E
+,B +,B DA DA EDA t,ω λt,ω − , Bλt,ω , B Et,ω
t , Et , t , Et , t ,
"
1 +β ζ − 1 1 − α
−,B −,B + Et,ω , B ,λ Bt,ω
tT
i
∑
ω∈
∀t ∈ T, ∀ω ∈ Ω i chDA DA DA , B,B +,B ,B + −,Bt −T,B, ch ch λEt,ω EEt,t,ω Et,ω λt,ω −EEt ,t,ω + E λ λE t , − t , t,ω t,ω t,ω + ζ − ι ( ω ) ≤ 0, ch ch t, t,
tT
p(ω )ι(ω )
p( ) ( ) Ω 1
+,B −,B ch DA Et,ω = Et,ω + Et,ω − Et,ω
E E Eι(ω) ≥ 0, E ∀ω ∈ Ω() 0, DA DA t, t,
, B , B t, t,
,B , B t, t,
ch D Et,ω = Et,ω υ(ξ ) X (ξ ) ∀t ∈ T, ∑ ( ) 0, S0 ξ ∈Ξ
∀ω ∈ Ω
D DA Etch ( )EXDA t) ∈ T,t T,∈ ∀ω Ω , Et ,Et,ω = S 00 (∀ t,ω
+,B Et,ω ≤ Pmax DA Et , −,BEtDA , ' ch Et,ω ≤ Et,ω
∀t ∈ T, ∀ω ∈ Ω t T , ∀t ∈ T, ∀ω ∈ Ω
#
(2)
(2) (3)
∀ω ∈ Ω
(3) (4) (5) (4) (6) (5) (7) (6) (8) (7) (9)
max where, α and ι(ω ) are the confidence and to calculate risk, respectively. Et,, B Plevel t auxiliary T , variable (8) Equation (2) explains the objective function from the aggregator’s perspective in which β is the risk coefficient that keeps the tradeoffbetween the expected profit and CVaR. Constraint (3) expresses ,B ch E E t T , Constraints (9) , , t t the energy balance in each time period and scenario. (4) and (5) are related to the CVaR term. The EVs’ demand that is supplied by the aggregator is considered by Equation (6). where, and ( ) are the confidence level and auxiliary variable to calculate risk, respectively. The non-anticipativity is expressed in (7). The limitation for the energy traded in the positive and Equation (2) explains the objective function from the aggregator’s perspective in which is the negative balancing market is represented in (8) and (9), respectively. risk coefficient that keeps the tradeoff between the expected profit and CVaR. Constraint (3) expresses the energy balance in each time period and scenario. Constraints (4) and (5) are related to the CVaR term. The EVs’ demand that is supplied by the aggregator is considered by equation (6).
Appl. Sci. 2017, 7, 1100
6 of 16
3.2. Lower Level: EV Owners’ Viewpoint The lower-level problem that relates to the decision-making of EV owners and their reaction to the prices offered by all the aggregators is modeled below:
Xs0 (ξ ) ∈ arg{ Minimize 0
Xs (ξ ),Z S,S (ξ )
_D 0 0 ∑ λs,t,ξ Xs (ξ ) + ∑ ∑ E t Ks,s ZS,S (ξ ) (10) s∈S 0 s∈S s ∈S s 6= 0 s0 6= s
_D ch Et λt,ω Xs0 (ξ ) +
Xs (ξ ) = Xs0 (ξ ) +
∑
0
Z S ,S (ξ ) −
s0 ∈ S s0 6= s _D Et
0
∑
Z S,S (ξ )
∀s ∈ S
(11)
s0 ∈ S s0 6= s
=
∑
ω ∈Ω
D p(ω ) Et,ω
(12)
∑ Xs ( ξ ) = 1
(13)
s∈S
Xs ( ξ ) ≥ 0 Z
S,S0
(ξ ) ≥ 0
∀s, ∈ S,
∀ξ ∈ Ξ
∀s, s0 ∈ S, s 6= s0
∀ξ ∈ Ξ
(14) (15)
The first term in the objective function of the lower-level problem comprises the cost of purchased energy by the EV owners from both the understudy and rival aggregators, and the second term models the reluctance of EV owners to change their aggregator. Constraint (11) discusses the contribution of each aggregator to supply EVs and considers the EVs switching between the aggregators. Equation (12) explains the total expected demand of EVs at each hour and Equation (13) expresses that all of the EVs’ demand should be supplied by all of the aggregators. The last two constraints explain the limitation for the variables. From the upper-level problem, the amount of energy purchased from DA and balancing markets and the selling price offered to the EV owners can be determined. From lower-level problem, the percentage of EVs’ demand that will be supplied by the aggregator would be obtained. It should be mentioned that the problem explained above is a nonlinear problem due to the product of terms ch and λch in Equations (2) and (4). Et,ω t,ω 4. Single Level Equivalent Linearization ch and λch , the partial derivative of the In order to obtain a linearized form of the production of Et,ω t,ω Lagrangian function of (10) with respect to primal decision variables is considered. In addition to the constraints explained in (11)–(15), the KKT optimality conditions for the lower-level problem are also taken into account. With considering the dual objective function, the lower-level problem is written as follows [26]: Maximize ∑ Xs0 (ξ )ε s (ξ ) + φ(ξ ) (16) ε s (ξ ),φ(ξ ) s∈S
ε s0 (ξ ) + φ(ξ ) ≤ Eˆ tD λch t,ω ε s (ξ ) + φ(ξ ) ≤ Eˆ tD λs,t,ξ , 0 ε s (ξ ) − ε s0 (ξ ) ≤ Eˆ tD K s,s
(17)
s = 1, 2, . . . , S
(18)
∀s, s0 ∈ S, s 6= s0
(19)
Appl. Sci. 2017, 7, 1100
7 of 16
Then, the dual objective function and the primal one should be equal as below [26]:
s,s0 S Eˆ tD λch X ( ξ ) + λ X ( ξ ) + K Z ( ξ ) = ∑ Xs0 (ξ )ε s (ξ ) + φ(ξ ), 0 ∑ ∑ ∑ t,ω s0 s s,t,ξ e,s,s s∈S s ∈ S 0 s∈S s ∈S 0 s 6= 0 s 6= s
∀ξ ∈ /Ξ
(20)
ch and λch is linearized as follows [26]: Therefore, the Revenuet,ω that is the production of Et,ω t,ω
Revenuet,ω =
D Et,ω
∑
_D E t ξ ∈Ξ
υ ( ξ ).[ −
∑
Eˆ tD λSs,t,ξ Xs (ξ ) −
s∈S s 6= 0
∑
s∈S
s0
∑
0 0 Eˆ tD K S,S Z S,S (ξ ) +
∑ Xs0 (ξ )ε s (ξ ) + φ(ξ )]
(21)
s∈S
∈S s0 6= s
Finally, the bi-level problem explained in (2)–(15) is transformed into an equivalent single-level mixed integer linear programming problem (MILP) including the objective function of the upper-level, the constraints of both levels as well as the equivalent expression of lower-level objective function. In the following, the equivalent single-level MILP problem is represented: Maximize DA , E+,B , E−,B , Et,ω t,ω t,ω ch λch t,ω , Et,ω , ζ, ι ( ω )
∑
ω ∈Ω
" h i +,B +,B −,B −,B DA DA p(ω ) ∑ Revenuet,ω − Et,ω λt,ω − Et,ω λt,ω + Et,ω λt,ω + β ζ − t∈ T
1 1−α
∑
# p(ω )ι(ω )
(22)
ω ∈Ω
Subject to constraints (3)–(9), (10)–(15) and the relation in (21) and the following constraints: Eˆ tD λch t,ω − ε s0 ( ξ ) − φ ( ξ ) ≥ 0, Eˆ tD λs,t,ξ − ε s (ξ ) − φ(ξ ) ≥ 0, 0 Eˆ tD K S,S + ε s0 (ξ ) − ε s (ξ ) ≥ 0,
∀ξ ∈ Ξ
s = 1, 2, . . . , S
∀s, s0 ∈ S,
X Eˆ tD λch t,ω − ε s0 ( ξ ) − φ ( ξ ) ≤ M1 e0 ( ξ ) ,
(23)
∀ξ ∈ Ξ
s 6= s,
∀ξ ∈ Ξ
∀ξ ∈ Ξ
Eˆ tD λs,t,ξ − ε s (ξ ) − φ(ξ ) ≤ M1 esX (ξ ) , s = 1, 2, . . . , S ∀ξ ∈ Ξ h i Xs (ξ ) ≤ M2 1 − esX (ξ ) , ∀s ∈ S, ∀ξ ∈ Ξ 0 Eˆ tD K S,S + ε s0 (ξ ) − ε s (ξ ) ≤ M1 eYs,s0 (ξ ) , ∀s, s0 ∈ S, s 6= s0 , ∀ξ ∈ Ξ h i 0 Z S,S (ξ ) ≤ M2 1 − eYs,s0 (ξ ) , ∀s, s0 ∈ S, s 6= s0 , ∀ξ ∈ Ξ
esX (ξ ) ∈ {0, 1}, eYs,s0 (ξ ) ∈ {0, 1},
∀s ∈ S,
∀ξ ∈ Ξ
∀s, s0 ∈ S, s 6= s0 ,
∀ξ ∈ Ξ
(24) (25) (26) (27) (28) (29) (30) (31) (32)
where, the ε s (ξ ) and φ(ξ ) are the dual variables, esX (ξ ) and eYs,s0 (ξ ) are binary variables and M1 and M2 are chosen large enough such that the optimality of the problem would be kept. 5. Numerical Results and Discussion In order to illustrate the applicability of the above-presented bi-level model, short-term scheduling for a test case with realistic electricity market prices is considered. 5.1. Test Case The formulation proposed above is tested on a realistic case study based on the electricity market of the Nordpool. The 2016 data for the DA and balancing prices are obtained from [28] and are used to estimate parameters of the auto-regressive integrated moving average (ARIMA) models [29]. The ARIMA models are characterized by the number of auto-regressive terms, the differencing order and the number of moving-average terms, respectively. Here, 200 scenarios for DA, positive and negative prices are generated over a 24 h horizon using the error terms from the time-series estimation,
The formulation proposed above is tested on a realistic case study based on the electricity market of the Nordpool. The 2016 data for the DA and balancing prices are obtained from [28] and are used to estimate parameters of the auto-regressive integrated moving average (ARIMA) models [29]. The ARIMA models are characterized by the number of auto-regressive terms, the differencing Appl. Sci. 2017, 7, 1100 8 of 16 order and the number of moving-average terms, respectively. Here, 200 scenarios for DA, positive and negative prices are generated over a 24 h horizon using the error terms from the time-series estimation, shown in respectively. Figures 3–5,Itrespectively. It shouldthat be the mentioned that the prices are as shown inas Figures 3–5, should be mentioned prices are generated for one generated forshow one the week, butmore to show the prices accurately, theshown. prices Also, for one are week, but to prices accurately, only more the prices for one only day are theday dashed shown. Also, the dashed blue lines in the Figures 3–6 show the mean of DA, positive and negative blue lines in the Figures 3–6 show the mean of DA, positive and negative prices and EVs’ demand, prices and EVs’ demand, respectively. In this is assumed that EVs charge with domestic respectively. In this study, it is assumed that EVsstudy, chargeit with domestic chargers. The battery capacity chargers. Theisbattery each EVefficiency is 24 kWh the charging efficiency is 0.9 it takes for each EV 24 kWhcapacity and thefor charging is and 0.9 and it takes about 4 hours to and be charged about 4 hours to be charged fully [19]. The amount of energy that each EV requires depends ontrip its fully [19]. The amount of energy that each EV requires depends on its driving profile as well as its driving profile as well as its trip distance. Also, the final state-of-charge of EVs on the operating day distance. Also, the final state-of-charge of EVs on the operating day is equal to the initial state-of-charge is to the forexchange the nextover daythe duescheduling to equal net energy exchange over the forequal the next dayinitial due tostate-of-charge equal net energy horizon [20]. With considering scheduling horizon [20]. With considering the correlation between EVs’ demand and DA prices, the the correlation between EVs’ demand and DA prices, the model in [26] is used to generate the EVs’ model inscenarios [26] is used generate the EVs’ demand scenarios withscenario respect provides to DA prices. Thisdemand means demand withtorespect to DA prices. This means each DA the EVs’ each DA scenario provides the EVs’ demand scenario that is shown in Figure 6. scenario that is shown in Figure 6. In from thethe network is In this this figure, figure, the the uncertainty uncertaintyinindriving drivingbehavior behaviorand andenergy energyrequirement requirement from network represented bybydifferent cause is represented differentscenarios. scenarios.Considering Consideringthetheactual actualnumber numberofof scenarios scenarios may may cause computational problems and too few scenarios may yield inaccuracies. So, a proper scenario computational problems and too few scenarios may yield inaccuracies. So, a proper scenario reduction reduction is used omit the lowand probable and similar [27], scenarios [27], and seven remained scenarios algorithm algorithm is used to omit thetolow probable similar scenarios and seven scenarios remained and are to theas program and are applied toapplied the program entries. as entries. The prices offered by the three rival aggregators aggregators are are also also considered. considered. The The prices offered by the three rival The forecasted forecasted errors errors are are generated proposed model model through through different different scenarios. scenarios. The distribution function generated in in the the proposed The normal normal distribution function is is used to model the forecasting errors as shown in Figure 2 [27]. Here, one segment is centered as the used to model the forecasting errors as shown in Figure 2 [27]. Here, one segment is centered as the predicted mean that that is predicted mean is extracted extracted from from [30] [30] and and two two slices slices are are created created to to forecast forecast errors errors with with standard standard deviation [23]. 0 . 15 deviation δ = 0.15 [23].
DA price (€/MWh)
60 45 30 15 0
2
4
6
8
10
12
14
16
18
20
22
24
Time (hour) Figure 3. Scenarios and mean of day-ahead price.
Appl. Sci. 2017, 7, 1100
9 of 16
Positive imbalance price (€/MWh)
80 60 40 20 0
2
4
6
8
10
12
14
16
18
20
22
Time (hour)
gative imbalance price (€/MWh)
Figure Figure 4. 4. Scenarios Scenarios and and mean mean of of positive positive imbalance imbalance price. price.
60
40
20
24
Posi Posit
20 20 00
Appl. Sci. 2017, 7, 1100
22
44
66
88
10 10 12 12 14 14 16 16 18 18 20 20 22 22 24 24
Time Time (hour) (hour)
Negativeimbalance imbalanceprice price Negative (€/MWh) (€/MWh)
Figure Figure 4. 4. Scenarios Scenarios and and mean mean of of positive positive imbalance imbalance price. price.
9 of 16
60 60 40 40 20 20 00
22
44
66
88
10 10 12 12 14 14 16 16 18 18 20 20 22 22 24 24
Time Time (hour) (hour)
Figure Figure5. 5.Scenarios Scenariosand andmean meanof ofnegative negativeimbalance imbalanceprice. price. Figure 5. Scenarios and mean of negative imbalance price.
EVsload load(MWh) (MWh) EVs
0.9 0.9 0.7 0.7 0.5 0.5 0.3 0.3 0.1 0.1
22
44
66
88
10 10 12 12 14 14 16 16 18 18 20 20 22 22 24 24
Time Time (hour) (hour)
Figure6. 6.Scenarios Scenariosof ofElectric Electricvehcles’ vehcles’demand. demand. Figure Figure 6. Scenarios of Electric vehcles’ demand.
The The cost cost of of modeling the reluctance reluctance of of EV modeling the EV owners owners to to change change their their aggregator aggregator is is neglected neglected and the initial EVs’ demand supplied by all aggregators is generated randomly. 0 ) and the initial EVs’ demand supplied by all aggregators is generated randomly. ( K 0) and the initial EVs’ demand supplied by all aggregators is generated randomly. The The maximum limitation for positive balancing energy is equal to the maximum rate of charging for each The maximum limitation for positive balancing energy is equal to the maximum rate of charging for maximum limitation for positive balancing energy is equal to the maximum rate of charging for each EV battery that is 3.6 kWh. The value of is 0.95. each EV battery that is 3.6 kWh. The value of α is 0.95. EV battery that is 3.6 kWh. The value of is 0.95. The stochastic programming problem formulated MILP problem The bi-level formulated as as an equivalent MILP problem and The bi-level stochastic stochasticprogramming programmingproblem problemisis is formulated as an an equivalent equivalent MILP problem and solved CPLEX in the software environment aa computer 44 GBs of solved withwith CPLEX in the software environment [31] [31] on computer withwith 4 GBs of RAM and and solved with CPLEX inGAMS the GAMS GAMS software environment [31]aon on computer with GBs of RAM RAM and Ci5 CPU. Ci5 CPU. and Ci5 CPU. s ,s0 s ,s 0 ((K K s,s =)
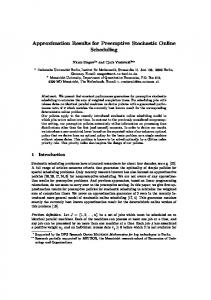
5.2. Simulationsand and Discussion 5.2. 5.2. Simulations Simulations and Discussion Discussion In this study, study, risk aversion aversion is considered considered in the form of CVaR weights. Figure Figure 7 shows the the In In this this study, risk risk aversion is is considered in in the form of CVaR weights. Figure 22 shows shows the cumulative distribution functions of the scenario profits plotted for different levels of β. In order to cumulative cumulative distribution distribution functions functions of of the the scenario scenario profits profits plotted plotted for for different different levels levels of of β. β. In In order order to to prevent data crowding crowding in the the figure, only only four βs βs are selected selected to show show the cumulative cumulative distribution prevent prevent data data crowding in in the figure, figure, only four four βs are are selected to to show the the cumulative distribution distribution function of profits for all scenarios at hour 4:00. At this time the DA prices are too low and as a result, the aggregator can economically supply the EVs. It is observed that with increasing risk aversion (increasing β), the worst scenarios are eliminated. Also, it shows that with increasing risk aversion, the profits which are far from the mean profit are ignored. This implies that when the CVaR concept is modeled, lower-profit scenarios with a low probability are not considered in the decision-making process. In fact, CVaR results in an average value with a higher probability and a lower variance with respect to the cases with the lowest risk aversion factor (β = 0.1). It can be observed that with increasing β and improvements in the lower tail of the distribution and omitting the worst scenarios with lower probabilities, the cumulative distribution function has higher values. Also, with increasing β, the upper profits with high probabilities are also omitted and the scenarios which are near the expected profit would remain. That is why the cumulative function for higher risk aversion factor reaches 1 before the other curves.
Cumulative probability
with respect to the cases with the lowest risk aversion factor (β = 0.1). It can be observed that with increasing β and improvements in the lower tail of the distribution and omitting the worst scenarios with lower probabilities, the cumulative distribution function has higher values. Also, with increasing β, the upper profits with high probabilities are also omitted and the scenarios which are nearSci. the2017, expected Appl. 7, 1100 profit would remain. That is why the cumulative function for higher risk aversion 10 of 16 factor reaches 1 before the other curves.
1
=0.1 =10 =25 =100
0.8 0.6 0.4 0.2
0 -17 -13 -9
-5
-1
3
7
11 15 19 23 27 31
Scenario profit (€) Figure Figure7.2. Cumulative Cumulativedistribution distributionfunctions functionswith withvarying varyingββ at at hour hour 4:00. 4:00.
Expected profit (€)
Expected profit (€)
Figure 88 depicts depicts the the variation variation of of expected expected profits profitsfor forthe thewhole wholeday dayagainst against their theircorresponding corresponding Figure CVaR for different values of β. The efficient frontier illustrates how the risk averse EV aggregator CVaR for different values of β. The efficient frontier illustrates how the risk averse EV aggregator can can trade off in the electricity market for different levels of β. It is observed that with increasing the trade off in the electricity market for different levels of β. It is observed that with increasing the risk risk aversion weighting factor, the expected decreases and CVaR increases. means as aversion weighting factor, the expected profitprofit decreases and CVaR increases. ThisThis means that that as the the aggregator becomes more risk averse, its expected profit decreases. Also it shows that beyond aggregator becomes more risk averse, its expected profit decreases. Also it shows that beyond a criticala β (i.e., beyond β = expected 10), the expected profit decreases significantly. negative CVaR βcritical (i.e., beyond β = 10), the profit decreases significantly. Moreover,Moreover, negative CVaR indicates indicates there isprofit negative profit of the With scenarios. With increasing riskfactor, aversion these there is negative in some ofin thesome scenarios. increasing risk aversion thesefactor, undesired undesired scenarios are ignored. Figure 7 shows that with increasing values of β, negative scenarios scenarios are7,ignored. Figure 7 shows that with increasing values of β, negative scenarios are eliminated; Appl. Sci. 2017, 1100 11 of 16 are means eliminated; thisincreasing means that with increasing β, profits in more the scenarios become when more itpositive, this that with β, profits in the scenarios become positive, because hedges because when it hedges against volatilities, theare profits that areawareness far from mean profit would be against volatilities, the profits that are far from the mean profit would bethe ignored. In other words, under uncertainty, while balancing purchases made with of prices. Also, when the ignored. In other words, lower profit scenarios with low probabilities would be eliminated. lower profittakes scenarios probabilities would beaeliminated. Therefore, expected for aggregator part with in thelow balancing market, it has perfect knowledge ofthe EVs’ energyprofit requests Therefore, the expected profit for the all hours of the day would be reduced. the hours of the day would be reduced. andall their availability. Figure 9 illustrates the expected profit versus its standard deviation for different values of β. It is observed that with increasing β, since low profit scenarios are not considered, the profit volatility 3900 =1 associated decreases. So, the standard =0.1 deviation =5with profit scenarios reduces. In other words, a =10 3850 conservative aggregator prefers minimizing risk; therefore, it chooses a large value of β to increase =20 the weight of the risk aversion in the objective function. In contrast, a non-conservative aggregator =25 3800a higher profit, hence it selects values for β close to 0. might be willing to obtain =30 In order to assess the effect of risk aversion on the purchased power by the aggregator, Table 1 represents the expected3750 DA, positive and negative procurements in different values of β. It should be =100in the DA purchases such mentioned that a higher risk aversion weighting factor leads to a decrease 3700 that less negative and more positive balancing These results are -16 -14 -12is provided. -10 -8 -6 -4 consistent with the CVaR (€) results provided in [4,18]. It has to be mentioned that the strong shift from DA into the balancing market is because assumption of full insight of balancing market within β. the 24 h. When Figureof 8. the Variation profit and conditional conditional value at risk riskprices with varying varying of expected profit and value at with β. future markets and contracts are not considered, the aggregator can control risk only by participation in the DA3940 and balancing markets. It should be noted that DA procurements are made Figure 9 illustrates the expected profit versus its standard deviation for different values of =0.1 =10 3900 increasing β, since low profit scenarios β. It is observed that with are not considered, the profit =1 =5 3860 volatility decreases. So, the standard deviation associated with profit scenarios reduces. In other words, =25 =20 =30 risk; therefore, it chooses a large value of β to increase a conservative aggregator prefers minimizing 3820 the weight of the risk aversion in the objective function. In contrast, a non-conservative aggregator 3780 might be willing to obtain a higher profit, hence it selects values for β close to 0. 3740 In order to assess the effect =100 of risk aversion on the purchased power by the aggregator, Table 1 represents the expected3700 DA, positive and procurements in different values of β. It should 1800 1900negative2000 2100 2200 be mentioned that a higher risk aversionProfit weighting factor leads(€) to a decrease in the DA purchases standard deviation such that less negative and more positive balancing is provided. These results are consistent with Figure 9.inExpected versus profit standard forshift different of β.the balancing the results provided [4,18]. Itprofit has to be mentioned that deviation the strong fromlevels DA into market is because of the assumption of full insight of balancing market prices within the 24 h. Table 1. Total expected energy (MWh) traded by the aggregator in DA and balancing markets.
p()E
DA t,
tT
0.1
546.350
p()E
, B t,
tT
118.816
p( ) E
, B t,
tT
280.705
Appl. Sci. 2017, 7, 1100
Expected profit (€)
3900 =0.1 =1
=5
3850
=10
=20 =25 =30
3800
11 of 16
3750 When future markets and contracts are not considered, the aggregator can control risk only by =100 participation in the DA3700 and balancing markets. It should be noted that DA procurements are made -16 -14 -12 -10 -8 -6 under uncertainty, while balancing purchases are made with awareness of -4 prices. Also, when the CVaR (€) aggregator takes part in the balancing market, it has a perfect knowledge of EVs’ energy requests and their availability. Figure 8. Variation of expected profit and conditional value at risk with varying β.
Expected profit (€)
3940 =10
3900 3860 =30
3820
=25
=5
=20
=0.1 =1
3780 3740
=100
3700 1800
1900
2000
2100
Profit standard deviation (€)
2200
Figure Figure9.9.Expected Expectedprofit profitversus versusprofit profitstandard standarddeviation deviationfor fordifferent differentlevels levelsof ofβ.β. Table Table1.1.Total Totalexpected expectedenergy energy(MWh) (MWh)traded tradedby bythe theaggregator aggregatorin inDA DAand andbalancing balancing markets. markets.
β 0.1 1 5 10 20 25 30 100
0.1 1 5 10 20 25 30 100
E ∑p()p(ω)E p(∑)E p(ω)E p( ) E ∑
tT t∈
DA t , DA t,ω tT
T ω∈Ω 546.350 545.499 546.350 545.499 536.463 536.463 535.274 535.274 516.907 516.907 501.044 501.044 492.955 492.955 467.315 467.315
, B t,
t∈T ω ∈Ω 118.816 118.960 118.816 118.960 121.184 121.184 121.456 121.456 122.922 122.922 123.902 123.902 125.648 125.648 126.899 126.899
+,B t,ω t T
, B t ,
−,B p(ω)Et,ω
t∈T ω 280.705 ∈ Ω 279.998 280.705 273.186 279.998 272.269 273.186 262.474 272.269 254.940 262.474 254.940 248.596 248.596 235.772 235.772
For a detailed discussion and elaboration of the DA and balancing purchases, the expected For a detailed elaboration the DA and illustrate balancing purchases, the expected procurements duringdiscussion the whole and day are assessed.of Figures 10–12 the expected DA, positive procurements during the whole day are assessed. Figures 10–12 illustrate the expected DA, and negative supplements at each hour during a given day, respectively. During midnight and early positive and negative supplements each hour a given respectively. During and in the morning, EV owners usually at connect theirduring vehicles to theday, network to charge themmidnight for the next early in the morning, EV owners usually connect their vehicles to the network to charge them for the work-day hours. Since, at this time the DA prices are very low, the aggregator purchases a high next work-day hours. Since, at this time the DA prices are very low, the aggregator purchases a high amount of DA energy. Accordingly, less energy is purchased in the positive balancing market, since amount of DA bought energy. high Accordingly, lessofenergy in the positive balancing market, since the the aggregator quantities energyisinpurchased the DA market, so it is not required to purchase a aggregator bought high quantities of energy in the DA market, so it is not required to purchase a high high bulk of energy from positive balancing. Also, it can be a good source of revenue for the bulk of energy from positive balancing. Also, it market can be asuch goodthat source of revenuethe for EV the owners aggregator aggregator to participate in negative balancing it encourages to to participate in negative balancing market such that it encourages the EV owners to decrease their decrease their demand, (i.e., unplug their vehicles or shift the charging of their EVs to other hours). demand, unplug theirthe vehicles or shift thedemand chargingisoflower their EVs other hours). From to 21:00, From 7:00(i.e., to 21:00, when predicted EVs’ thantothe other hours, the 7:00 aggregator when the demand is lower than market the other aggregator decides to participate decides to predicted participateEVs’ in the positive balancing tohours, supplythe EVs during this operating period. in the positive balancing market to supply EVs during this operating period. Moreover, the aggregator can deal economically with this low amount of demand in joint DA and positive markets. However, from 19:00 to 21:00, the EVs’ demand increases, so the aggregator purchases more energy from the positive market to meet their energy requirements. During these hours, it participates in negative balancing to obtain some profits from load decrements. After 22:00, there are many EV owners who want to charge their EVs for the next day; so the aggregator participates in the DA market to buy energy. In this regard, it purchases less energy from the positive balancing market. Also, the aggregator is paid based on the negative balancing price to decrease its demand. It should be mentioned that
DA purchase (MWh) DA DApurchase purchase(MWh) (MWh)
there are are many many EV EV owners owners who who want want to to charge charge their their EVs EVs for for the the next next day; day; so so the the aggregator aggregator there there are many EV owners who want to charge their EVs for the next day; so the aggregator participates in in the the DA DA market market to to buy buy energy. energy. In In this this regard, regard, itit it purchases purchases less less energy energy from from the the participates participates in the DA market to buy energy. In this regard, purchases less energy from the positive balancing market. Also, the aggregator is paid based on the negative balancing price to positive balancing market. Also, the aggregator is paid based on the negative balancing price positive balancing market. Also, the aggregator is paid based on the negative balancing price to to decrease its demand. It should be mentioned that negative prices fluctuate more than the positive decrease decrease its its demand. demand. ItIt should should be be mentioned mentioned that that negative negative prices prices fluctuate fluctuate more more than than the the positive positive Appl. 2017, 7, the 1100 ones,Sci. because the aggregators aggregators should shouldbe beencouraged encouraged to to decrease decreasetheir their demand demandbased basedon on that. that. 12 of 16 ones, because ones, because the aggregators should be encouraged to decrease their demand based on that. Generally, the the expected expected DA DA and and balancing balancing procurements procurements during during the the day day also also demonstrate demonstrate that that Generally, Generally, the expected DA and balancing procurements during the day also demonstrate that increment of risk factor leads to lower participation in the DA and negative balancing energy trading increment of factor lower in the trading incrementprices ofrisk risk factorleads leads tothan lower participation inbecause theDA DAand and negativebalancing balancing energy trading negative fluctuate moreto theparticipation positive ones, the negative aggregators shouldenergy be encouraged floor and and higher higher positive positive balancing balancing purchases purchasesat at each eachhour. hour. floor floor and higher positive balancing purchases at each hour. to decrease their demand based on that. 70 70 70 60 60 60 50 50 50 40 40 40 30 30 30 20 20 20 10 10 10 000 000
=0.1 =0.1 =0.1 =10 =10 =10 =25 =25 =25 =100 =100 =100
222
444
666
10 12 12 14 14 16 16 18 18 20 20 22 22 24 24 888 10 10 12 14 16 18 20 22 24
Time (hour) (hour) Time Time (hour)
ExpectedDA differentlevels levelsof ofβ. β. Figure 10. DAprocurement procurement for different levels of β. Figure Figure10. 10.Expected Expected DA procurementfor fordifferent different levels of β.
Positive balancing energy Positive Positivebalancing balancingenergy energy (MWh) (MWh) (MWh)
15 15 15
=0.1 =0.1 =0.1
=10 =10 =10
=25 =25 =25
=100 =100 =100
10 10 10 555 000 000
222
444
666
10 12 12 14 14 16 16 18 18 20 20 22 22 24 24 888 10 10 12 14 16 18 20 22 24
Time (hour) (hour) Time Time (hour)
Figure11. 11.Expected Expectedpositive positivebalancing balancingprocurement procurementfor fordifferent differentlevels levelsof ofβ. β. Figure Figure Expected positive balancing different levels of β. 11. procurement for different β.
Negative balancing energy Negative Negativebalancing balancingenergy energy (MWh) (MWh) (MWh)
000 -5 -5 -5 -10 -10 -10 -15 -15 -15 -20 -20 -20 -25 -25 -25 -30 -30 -30 -35 -35 -35 000
=0.1 =0.1 =0.1 =10 =10 =10 =25 =25 =25 =100 =100 =100
222
444
666
10 12 12 14 14 16 16 18 18 20 20 22 22 24 24 888 10 10 12 14 16 18 20 22 24
Time (hour) (hour) Time Time (hour)
Figure12. 12.Expected Expectednegative negativebalancing balancingprocurement procurementfor fordifferent differentlevels levelsof ofβ. β. Figure Figure Expected negative balancing different levels of β. 12. procurement for different β.
Figure13 13shows showsthe theexpected expectedvalues valuesof ofthe theselling sellingprices pricesoffered offeredby bythe therivals rivalswith withspotted spottedlines lines Figure Figure 13 shows the expected values of the selling prices offered rivals spotted lines Generally, the expected DA and balancing procurements duringby thethe day alsowith demonstrate that and the the price price signal signal offered offered by by the the understudy understudy aggregator aggregator with with aaa solid solid line line at at each each hour hour of of the the day. day. and and the price signal offered understudy aggregator with solid line at each hour of the day. increment of risk factor leadsby to the lower participation in the DA and negative balancing energy trading The rivals’ rivals’ prices prices shown shown in in this this figure figure are are the the expected expected values values of of the the considered considered scenarios scenarios that that are are The The rivals’ prices shown in this figure are the values of the considered scenarios that are floor and higher positive balancing purchases atexpected each hour. Figure 13 shows the expected values of the selling prices offered by the rivals with spotted lines and the price signal offered by the understudy aggregator with a solid line at each hour of the day. The rivals’ prices shown in this figure are the expected values of the considered scenarios that are generated based on normal PDF as explained in Section 2.2. Moreover, the price signal offered by the understudy aggregator is obtained based on the optimization problem. As can be seen, from 1:00 to 2:00, because the demand is high and the DA and positive balancing prices are relatively high, the aggregator buys a low amount of energy from these markets. Also, the negative price that should be paid due to the load reduction is low. Therefore, the aggregator would not obtain substantial profit from taking part in the negative balancing market. So, it offers high prices to avoid profit losses.
Offered Offered price price (€/MWh) (€/MWh)
generated based on normal PDF as explained in Section 2.2. Moreover, the price signal offered by the understudy aggregator aggregator is is obtained obtained based based on on the the optimization optimization problem. problem. As As can can be be seen, seen, from from 1:00 1:00 to to understudy 2:00, because the demand is high and the DA and positive balancing prices are relatively high, the 2:00, because the demand is high and the DA and positive balancing prices are relatively high, the aggregator buys buys aa low low amount amount of of energy energy from from these these markets. markets. Also, Also, the the negative negative price price that that should should be be aggregator paid due due to to the the load load reduction reduction is is low. low. Therefore, Therefore, the the aggregator aggregator would would not not obtain obtain substantial substantial profit profit paid Appl. Sci. 2017, 7, 1100 13 of 16 from taking taking part part in in the the negative negative balancing balancing market. market. So, So, itit offers offers high high prices prices to to avoid avoid profit profit losses. losses. from From 3:00 3:00 to to 6:00 6:00 and and 21:00 21:00 to to 24:00, 24:00, the the understudy understudy aggregator aggregator offers offers lower lower prices prices because because itit From buysFrom the energy energy from the DA market at lower price rates. During these hours, the aggregator buys the from the DA market at lower price rates. During these hours, the aggregator 3:00 to 6:00 and 21:00 to 24:00, the understudy aggregator offers lower prices because it manages to provide provide high amount of lower energy from DA During to benefit benefit from lowthe prices (see Figure Figure 10). manages to high energy from DA to from low prices (see 10). buys the energy fromaathe DAamount market of at price rates. these hours, aggregator manages Moreover, during the working working period (i.e.,DA 7:00–21:00), as mentioned before, the aggregator mostly Moreover, the period (i.e., 7:00–21:00), mentioned before, aggregator mostly to provide during a high amount of energy from to benefitas from low prices (seethe Figure 10). Moreover, participates in the positive balancing market. Also, the aggregator participates in the negative participates in the period positive(i.e., balancing market. Also, thebefore, aggregator participates in participates the negative during the working 7:00–21:00), as mentioned the aggregator mostly in balancing market and obtains obtains adequate adequate revenues due due to the the load load reduction. So,balancing its low low offered offered price balancing market and to So, its the positive balancing market. Also, the revenues aggregator participates inreduction. the negative marketprice and would be be compensated with the earnings from the theSo, negative balancing market. In compensated the working working would compensated with earnings from negative balancing market. the obtains adequate revenues duethe to the load reduction. its low offered price would In be period, although it purchases energy with higher prices, it suggests cheap selling prices to keep its its period, purchases energybalancing with higher prices, suggests cheap selling pricesitto keep with thealthough earningsitfrom the negative market. In itthe working period, although purchases clients and and compete againstitits its rivals, cheap especially aggregators andits2, 2,clients whichand offer low prices prices in this this clients against rivals, especially aggregators 11 and which offer low in energy withcompete higher prices, suggests selling prices to keep compete against its period. Also, during this period, the aggregator participates in the negative balancing market and period. Also, during this period, the aggregator participates in the negative balancing market and rivals, especially aggregators 1 and 2, which offer low prices in this period. Also, during this period, could achieve some some money in due tonegative load decrement. decrement. Inmarket this period, period, although thesome negative balancing could achieve money due load this although the negative balancing the aggregator participates theto balancingIn and could achieve money due to prices are high, the aggregator does not participate in the negative balancing market, since the prices are high, the aggregator does not participate in the negative balancing market, since the load decrement. In this period, although the negative balancing prices are high, the aggregator does requested load is low. requested load in is low. not participate the negative balancing market, since the requested load is low. 30 30 25 25 20 20 15 15
S1 S1
10 10
22
44
66
88
S2 S2
S3 S3
S0 S0
10 12 12 14 14 16 16 18 18 20 20 22 22 24 24 10
Time (hour) (hour) Time
Figure13. 3. Price Price offered to the EV owners by the aggregators. 3. Figure Priceoffered offeredto tothe theEV EVowners ownersby bythe theaggregators. aggregators.
The EVs’ demand demand supplied by by the aggregators aggregators during the the whole day day is illustrated in in Figure 14. 14. The The EVs’ EVs’ demand supplied supplied by the the aggregators during during thewhole whole dayisisillustrated illustrated inFigure Figure 14. It is observed that when the rivals offer lower prices and the price offered by the understudy It is observed observedthat that when rivals the priceby offered by the understudy It is when thethe rivals offeroffer lowerlower pricesprices and theand price offered the understudy aggregator aggregator is is high high (i.e., (i.e., 1:00–2:00), 1:00–2:00), the the total total demand demand is is supplied supplied by by other other rivals. rivals. On On the the other hand, hand, at at aggregator is high (i.e., 1:00–2:00), the total demand is supplied by other rivals. On the other hand,other at hours that hours that that the the aggregator‘s aggregator‘s price price is is the the lowest lowest value value (3:00 (3:00 to to 6:00 6:00 and and 21:00 21:00 to to 24:00), 24:00), the the total total hours the aggregator‘s price is the lowest value (3:00 to 6:00 and 21:00 to 24:00), the total demand is supplied demand is is supplied supplied by by the the understudy understudy aggregator. aggregator. demand by the understudy aggregator. XS0 X S0
XS1 X S1
XS2 X S2
XS3 X S3
Demand Demand share share (%) (%)
100 100 80 80 60 60 40 40 20 20 00
22
44
66
88
10 12 12 14 14 16 16 18 18 20 20 22 22 24 24 10
Time (hour) (hour) Time
day. Figure 14. 14. EVs’ EVs’ demand demand share share during during the the whole whole day. day. Figure
However, in the working period, the aggregator contributes to supply a high portion of demand. As it is observed, rivals 1 and 3 supply the demand only in some of the hours. Generally, it should be noted that EV owners select the most competitive aggregator to purchase energy which leads the aggregator to compete against other aggregators that offer similar services.
Appl. Sci. 2017, 7, 1100
14 of 16
6. Conclusions A bi-level framework for the problem of decision-making by an EV aggregator in a competitive environment was proposed in this paper. The problem was formulated such that the aggregator and the EV owners were placed in the upper and the lower level, respectively. The bi-level nonlinear stochastic model was transformed into the linear single-level using the KKT optimality and the strong duality condition. The EV aggregator offered selling prices in an uncertain environment to compete against its rivals. The risk aversion of the EV aggregator was modeled by the CVaR of the profit. The results showed that when the aggregator becomes more risk averse, it decreases its DA purchases and increases the positive balancing procurements as well as reduces its participation in the negative balancing market. This is because of the uncertainties in the DA market but perfect knowledge of prices when reaching to the real time. Moreover, the EV owners choose the lowest electricity prices and shift between the aggregators in order to minimize their costs. Additionally, the effect of risk aversion was assessed and the results showed that ignoring the influence of unwilling scenarios caused the decrement of profit volatility and reduction of its standard deviation. Author Contributions: Homa Rashidizaheh-Kermani and Mostafa Vahedipour-Dahraie developed the model; Homa Rashidizaheh-Kermani simulated the case studies; Homa Rashidizaheh-Kermani, Mostafa Vahedipour-Dahraie and Amjad Anvari-Moghaddam analyzed the data; Homa Rashidizaheh-Kermani, Mostafa Vahedipour-Dahraie and Hamid Reza Najafi wrote the manuscript; Amjad Anvari-Moghaddam and Hamid Reza Najafi and Josep M. Guerrero provided their comments on the paper. Conflicts of Interest: The authors declare no conflict of interest.
Nomenclature
ξ t ω s esX (ξ )/eY s,s0 ( ξ ) ch Et,ω −,B +,B Et,ω /Et,ω 0 s,s K Xs ( ξ ) Xs0 (ξ ) 0 Z S,S (ξ ) λch t,ω ι(ω ) ε s (ξ )/φ(ξ ) D Et,ω _D Et DA Et,ω Xs0 (ξ )
p(ω ) ,B −,B λ+ t,ω /λt,ω λs,t,ξ DA λt,ω ˆλ DA t υ(ξ ) α β ∆
Indices Rival aggregator scenario index Time index Scenario index of DA, balancing prices and EVs’ demand Rival aggregator index Variables Binary variable used in the linear expressions of the complementary slackness conditions of the lower-level problem in scenario ξ EVs’ demand which is supplied by the aggregator ω Positive/negative balancing energy deviation (MWh) Cost to model the reluctance of EV owners for shifting between the aggregators (€) Percentage of EVs supplied by rival aggregators in scenario ξ Percentage of EVs’ demand supplied by the aggregator Percentage of EVs shifted between the aggregators Selling price offered by the aggregator Auxiliary variable to control CVaR in scenario ω(€) Lagrange multiplier Parameters Total demand of EVs at time t and scenario ω Total expected EVs’ demand (MWh) DA EVs’ demand at time t and scenario ω Initial percentage of EVs supplied by each aggregator in scenario ξ Probability of occurrence of DA, balancing prices and EVs’ demand Positive/negative balancing price (€/MWh) Selling prices offered by each rival aggregator in scenario ξ Day-ahead price at time t and scenario ω Expected day ahead price at time t Probability of occurrence of prices offered by rival aggregators in scenario ξ Confidence level for calculation of CVaR Risk factor The parameter to show the relationship between the EVs’ demand and DA prices
Appl. Sci. 2017, 7, 1100
T S Ω Ξ
15 of 16
Sets Number of time periods Number of rival aggregators Number of scenarios for DA price, balancing market price and Evs‘ demand Number of rival aggregator scenarios
References 1.
2. 3. 4. 5.
6.
7.
8. 9. 10.
11.
12. 13. 14. 15.
16. 17.
18. 19.
Shafie-khah, M.; Heydarian-Forushani, E.; Hamedani Golshan, M.E.; Siano, P.; Parsa Moghaddam, M.; Sheikh-El-Eslami, M.K.; Catalão, J.P.S. Optimal trading of plug-in electric vehicle aggregation agents in a market environment for sustainability. Appl. Energy 2016, 162, 601–612. [CrossRef] Ortega-Vazquez, M.; Bouffard, F.; Silva, V. Electric vehicle Aggregator/System operator coordination for charging scheduling and services procurement. IEEE Trans. Power Syst. 2013, 28, 1806–1815. [CrossRef] Bessa, R.; Matos, M.; Soares, F.; Lopes, J. Optimized bidding of a EV aggregation agent in the electricity market. IEEE Trans. Smart Grid 2012, 3, 443–452. [CrossRef] Morales, J.M.; Conejo, A.J.; Perez-Ruiz, J. Short-term trading for a wind power producer. IEEE Trans. Power Syst. 2010, 25, 554–564. [CrossRef] Vahedipour-Dahraie, M.; Rashidizadeh-Kermani, H.; Najafi, H.R.; Anvari-Moghaddam, A.; Guerrero, J.M. Stochastic Security and Risk-Constrained Scheduling for an Autonomous Microgrid with Demand Response and Renewable Energy Resources. IET Renew. Power Gener. 2017. [CrossRef] Alipour, M.; Mohammadi-Ivatloo, B.; Moradi-Dalvand, M.; Zare, K. Stochastic scheduling of aggregators of plug-in electric vehicles for participation in energy and ancillary service markets. Energy 2017, 118, 1168–1179. [CrossRef] Vahedipour-Dahraie, M.; Rashidizadeh-Kermani, H.; Najafi, H.R.; Anvari-Moghaddam, A.; Guerrero, J.M. Coordination of EVs Participation for Load Frequency Control in Isolated Microgrids. Appl. Sci. 2017, 7, 539. [CrossRef] Han, J.; Park, J.; Lee, K. Optimal Scheduling for Electric Vehicle Charging under Variable Maximum Charging Power. Energies 2017, 10, 933. [CrossRef] Xia, M.; Lai, Q.; Zhong, Y.; Li, C.; Chiang, H.-D. Aggregator-Based Interactive Charging Management System for Electric Vehicle Charging. Energies 2016, 9, 159. [CrossRef] Vahedipour-Dahraie, M.; Rashidizadeh-Kermani, H.; Najafi, H.R.; Anvari-Moghaddam, A.; Guerrero, J.M. Study of the Effect of Time-Based Rate Demand Response Programs on Stochastic Day-Ahead Energy and Reserve Scheduling in Islanded Residential Microgrids. Appl. Sci. 2017, 7, 378. [CrossRef] Neyestani, N.; Damavandi, M.D.; Shafie-khah, M.; Bakirtzis, A.G.; Catalão, J.P.S. Plug-In Electric Vehicles Parking Lot Equilibria With Energy and Reserve Markets. IEEE Trans. Power Syst. 2017, 32, 2001–2016. [CrossRef] Vagropoulos, S.I.; Bakirtzis, A.G. Optimal bidding strategy for electric vehicle aggregators in electricity markets. IEEE Trans. Power Syst. 2013, 28, 4031–4041. [CrossRef] Pantos, M. Exploitation of electric-drive vehicles in electricity markets. IEEE Trans. Power Syst. 2012, 27, 682–694. [CrossRef] Mu, Y.; Wu, J.; Jenkins, N.; Jia, H.; Wang, C. A spatial-temporal model for grid impact analysis of plug-in electric vehicles. Appl. Energy 2014, 114, 456–465. [CrossRef] Nojavan, S.; Zare, K.; Mohammadi-Ivatloo, B. Risk-based framework for supplying electricity from renewable generation-owning retailers to price-sensitive customers using information gap decision theory. Int. J. Electr. Power Energy Syst. 2017, 93, 156–170. [CrossRef] Vayá, M.G.; Andersson, G. Self Scheduling of Plug-In Electric Vehicle Aggregator to Provide Balancing Services for Wind Power. IEEE Trans. Sustain. Energy 2016, 7, 886–899. [CrossRef] Wu, H.; Shahidehpour, M.; Alabdulwahab, A.; Abusorrah, A. A Game Theoretic Approach to Risk-Based Optimal Bidding Strategies for Electric Vehicle Aggregators in Electricity Markets With Variable Wind Energy Resources. IEEE Trans. Sustain. Energy 2016, 7, 374–385. [CrossRef] Momber, I.; Siddiqui, A.; Gómez, T.; Söder, L. Risk averse scheduling by a PEV aggregator under uncertainty. IEEE Trans. Power Syst. 2015, 30, 882–891. [CrossRef] Shahidinejad, S.; Filizadeh, S.; Bibeau, E. Profile of charging load on the grid due to plug-in vehicles. IEEE Trans. Smart Grid 2012, 3, 135–141. [CrossRef]
Appl. Sci. 2017, 7, 1100
20. 21. 22. 23. 24. 25. 26. 27. 28. 29. 30. 31.
16 of 16
Aghajani, S.; Kalantar, M. A cooperative game theoretic analysis of electric vehicles parking lot in smart grid. Energy 2017, 137, 129–139. [CrossRef] Momber, I.; Wogrin, S.; Román, T.G.S. Retail Pricing: A Bilevel Program for PEV Aggregator Decisions Using Indirect Load Control. IEEE Trans. Power Syst. 2016, 31, 464–473. [CrossRef] Vayá, M.G.; Andersson, G. Optimal Bidding Strategy of a Plug-In Electric Vehicle Aggregator in Day-Ahead Electricity Markets Under Uncertainty. IEEE Trans. Power Syst. 2015, 30, 2375–2385. [CrossRef] Aghajani, S.; Kalantar, M. Operational scheduling of electric vehicles parking lot integrated with renewable generation based on bilevel programming approach. Energy 2017. [CrossRef] Tan, Z.; Yang, P.; Nehorai, A. An optimal and distributed demand response strategy with electric vehicles in the smart grid. IEEE Trans. Smart Grid 2014, 5, 861–869. [CrossRef] Najafi, A.; Falaghi, H.; Contreras, J.; Ramezani, M. A Stochastic Bilevel Model for the Energy Hub Manager Problem. IEEE Trans. Smart Grid 2017, 8, 2394–2404. [CrossRef] Carrión, M.; Arroyo, J.M.; Conejo, A.J. A bilevel stochastic programming approach for retailer futures market trading. IEEE Trans. Power Syst. 2009, 24, 1446–1456. [CrossRef] Conejo, A.J.; Carrión, M.; Morales, J.M. Decision Making Under Uncertainty in Electricity Markets, 1st ed.; Springer: New York, NY, USA, 2010; pp. 80–84, ISBN 978-1-4419-7421-1. Nord Pool. Available online: http://www.nordpoolspot.com (accessed on 15 September 2016). Box, G.E.P.; Jenkins, G.M.; Reinsel, G.C. Time Series Analysis: Forecasting and Control, 4th ed.; John Wiley & Sons: Hoboken, NJ, USA, 2008; pp. 305–325, ISBN 978-1-118-67502-1. Kiaee, M.; Cruden, A.; Sharkh, S. Estimation of cost savings from participation of electric vehicles in vehicle to grid (V2G) schemes. J. Mod. Power Syst. Clean Energy 2015, 3, 249–258. [CrossRef] The General Algebraic Modeling System (GAMS) Software. Available online: http://www.gams.com (accessed on 15 September 2016). © 2017 by the authors. Licensee MDPI, Basel, Switzerland. This article is an open access article distributed under the terms and conditions of the Creative Commons Attribution (CC BY) license (http://creativecommons.org/licenses/by/4.0/).