call-chain based algorithm for inserting software prefetch ... tively on a 2-socket, 4-way Power5 multiprocessor running ..... In International Conference on.
A Study of Instruction Cache Performance and the Potential for Instruction Prefetching in J2EE Server Applications Priya Nagpurkar† Harold W. Cain‡ Mauricio Serrano‡ Jong-Deok Choi‡ Chandra Krintz† † ‡ University of California, Santa Barbara IBM T.J. Watson Research Center Pre-fetch points, Methods to pre-fetch
Abstract
1
Introduction
Despite an abundance of research over the years, instruction cache (icache) miss stalls remain a source of performance degradation for many commercial applications [2][5][8][9][12][14]. Due to the relatively larger performance cost of data cache misses in most applications, research and development has largely focused on the data cache miss problem instead. As evidence, only a few architectures (IA-64, PA-RISC, and SPARC v9) include instruction cache prefetch instructions, while many architectures (e.g. IA-32, x86-64, and PowerPC), include no support for instruction prefetching. In contrast, all major architectures include support for software-directed data prefetching. In theory, the icache miss problem is an easier problem to solve, because choosing blocks for instruction prefetching is solely a function of predicting control flow, while a data prefetching mechanism must also solve the considerably more difficult problem of predicting the data address that will be touched. In addition, control flow, through both branch prediction and phasing behavior [17, 15], has been shown to be highly predictable. Consequently, given hardware support for software-directed instruction cache
WAS Application (SPEC jAppServer)
WebSphere 6.1 Java VM (J9)
Trace-based
MAMBO
We present a detailed characterization of instruction cache performance for IBM’s J2EE-enabled web server, WebSphere Application Server (WAS). When running two J2EE benchmarks on WebSphere, we find that instruction cache misses cause a 12% performance penalty on current-generation Power5-based multiprocessor systems. To mitigate this performance loss, we describe a new call-chain based algorithm for inserting software prefetch instructions and evaluate its potential for improved instruction cache performance. The performance of this algorithm depends on the selection of several independent parameters which control the distance and number of prefetches inserted for a particular method. Through characterization of the WebSphere applications, we select these parameters, and ultimately find that our call-chain based insertion algorithm achieves an 18% reduction in instructon cache miss rate for Java methods.
OS (AIX)
Instruction pre-fetching Method Entry/Exit, L1 I-Cache miss trace
scheme
Evaluation
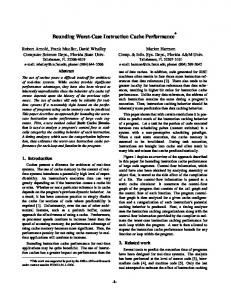
Figure 1: Methodology
prefetching, we believe that it should be possible to significantly reduce instruction cache miss stalls for all applications (large and small). In this paper, we present a detailed characterization of instruction cache performance across three Java server workloads running natively on an IBM Power5 multiprocessor, showing that instruction misses are indeed still a problem for large-scale server applications. We follow this characterization with a detailed study of the industry-standard SPECjAppServer2004 J2EE benchmark [10] running in a full-system simulator, investigating the potential of an allsoftware instruction prefetch mechanism as a means of reducing icache miss rate. Prior work also proposed a call-graph based software prefetch mechanism for instruction misses which uses caller-callee relationships, inserting prefetches for a callee at the entrance of a caller [4]. In object-oriented programs which are characterized by small method sizes (such as WebSphere), this may result in late prefetches due to the short distance between the caller being invoked and its subsequent calls. We investigate moving prefetches up the call chain, inserting them at a greater distance from the callee. This leads to a trade off between prefetch coverage, accuracy, and timeliness, which we explore in section 4.
2
Methodology
Our study uses a two-pronged experimental setup. We first experiment with WebSphere performance running natively on a 2-socket, 4-way Power5 multiprocessor running AIX 5.3, configured with 16GB of DRAM. We use SPECjAppServer2004 and Trade6 [6], a J2EE online brokerage benchmark internally developed by IBM. These heavily-
3
Instruction Cache Miss Characterization
WebSphere J2EE applications. SPECjbb2000 exhibits only a small (2%) instruction miss penalty; we have observed similar results for SPECjbb2005. Figure 3 shows the number of L1 icache misses per 100 committed instructions, broken down by the location from which they are serviced. The vast majority of icache misses (92% and 93% for SPECjAppServer2004 and Trade6, respectively) are satisfied from the 1.8MB L2, and nearly all of the remaining misses are satisfied from the 36MB L3. An insignificant fraction of misses (less than 1%) are satisfied from memory or from another remote cache.
1.8 1.6
L1I cache misses per 100 instr
multithreaded applications run in a three-tier configuration with a DB2 8.2 back-end tier and a client/driver front-end tier. We report results for the middle-tier only, which is running the WebSphere application server, running on top of IBM’s Java virtual machine [11]. Performance counters are sampled after a 15 minute warmup period, with three 30-second sampling intervals for each set of counters. We solely focus on the L1 instruction cache in our study, which is 64KBytes, 2-way set-associative with 128-bytes cache lines. These results are presented in section 3. For more detailed analysis (solely on SPECjAppServer2004), we use Mambo [7], a full system simulator developed at the IBM Austin Research Lab. Mambo simulates the underlying hardware in enough detail that it can run the entire software stack used in our native system (AIX 5.3, J9 v2.3, WebSphere 6.1). Figure 1 illustrates this experimental methodology. Using Mambo, we gather a method entry/exit trace augmented with information about cache misses, and analyze it to select delinquent methods for which prefetching will be useful, and points at which we will insert prefetches (which we refer to as prefetch points) for these delinquent methods. The trace is gathered over the execution of 1 billion instructions (post-SPECjAppServer2004 warmup), which is also the length of our simulations.
1.4 1.2 1
serviced by L2 serviced by L3
0.8 0.6 0.4 0.2 0 SPECjAppServer2004
Trade6
SPECjbb2000
Figure 3: i-cache misses per 100 committed instructions
100%
100% 90% 80%
60%
40%
20%
0% SPECjAppServer2004
Trade6
SPECjbb2000
Other front-end stall Br Mispred I Cache FPU Stall FXU Stall LSU basic latency LSU Reject DERAT D Cache Other back-end stall Instr Completion
% of icache misses
% cycles
80%
70% 60% Java Code All Code
50% 40% 30% 20% 10% 0% 0
250
500
750 1000 1250 1500 1750 2000 number of methods
Figure 2: Commit Stall Cycle Categorization (icache miss stalls in striped bar).
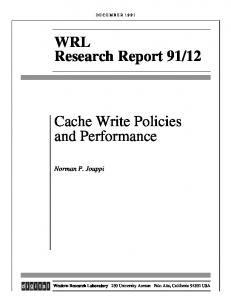
Figure 4: Per-method Contribution to Total iCache Misses (cumulative distribution)
The Power5 performance counter facility offers a set of counters that are incremented at each stall of the processor’s commit stage, where each counter corresponds to the cause of the stall. Figure 2 shows a breakdown of stall cycles created using these counters, for SPECjAppServer2004 [10], Trade6 [6], and SPECjbb2000 [18]. Power5’s 2-way SMT feature does a relatively good job of keeping the pipeline busy, however instruction cache misses still account for a significant fraction of stall cycles (12%) for both of the
Using our Mambo-based simulation methodology [7], we have also collected a profile of these instruction cache misses for WebSphere running SPECjAppServer2004, mapping each cache miss back to the individual method that caused it. In terms of high-level software components, JITTED java code accounts for the majority of icache misses (71%), followed by the AIX kernel (12%), and the J9 runtime system (7%). The remaining 10% of misses are distributed over a large set of system libraries.
When taking a closer look at the individual methods in this profile, we find that the profile is extremely flat; no single method accounts for more than 2%, and the largest contributor from the Java portion of code is merely 0.525%. Figure 4 shows the contribution of total instruction cache misses by the number of methods causing those misses. This chart includes data for all misses, and data for misses that are caused by Java code. In both cases, 50% of all misses can be attributed to the 300 worst offending methods. In order to cover 75% of all misses, more than 700 methods must be considered. Obviously, in order for an instruction prefetching mechanism to be beneficial, it must target a large number of methods. We analyzed the top ten Java methods with the highest number of misses in more detail. Table 5 summarizes this information. The columns list percentage icache misses, average per-invocation miss count, number instruction cache blocks that are ever actually touched, and the number of direct callers for each method. The last row shows the average values, averaged across all Java methods. Note that the fourth column refers to the static number of used blocks for a method and is an indication of method size. We observe that the number of callers for a method varies and is not always small. Consequently, code positioning schemes [16, 11] might not be effective in addressing the cache miss problem, because each method often has many callers. In addition, the IBM J9 JIT [11] already optimizes code layout by reordering basic blocks such that the commonly executed code appears close in memory, thus we expect the benefits of further code reordering to be small. We also observe that in most cases, excluding method numbers 3 and 5, the average per-invocation misses for a method is low. This bi-modal data suggests a bi-modal optimization: for methods with a small number of blocks and small number of misses per invocation, prefetches should be inserted for the entire method; for methods with a large number of blocks or a large number of misses per invocation, some of the blocks should be prefetched upon entry to the method, since there will be ample time to overlap the prefetch latency within the method. We plan to explore such a bi-modal mechanism in future work. For now, we adopt the all-or-nothing approach: at each prefetch point, we perform prefetching for all of the blocks that have been identified as useful (i.e. all of the method’s blocks, excluding those blocks that are never used during our one billion instruction profile).
4
Instruction Prefetching Characterization
We now present our prefetching mechanism, the parameters used to select the prefetch points, the metrics used to evaluate them, and some results.
Top Methods 1 2 3 4 5 6 7 8 9 10 Average (4562 total)
Num. Used Num. Direct Cache Blocks Callers (Static)
ICache Misses (% of Total)
Avg. Perinvocation Misses
0.525 0.468 0.446 0.436 0.377 0.350 0.280 0.277 0.273 0.259
4.404 2.833 54.897 2.720 61.214 0.844 16.431 7.100 1.194 13.044
20 14 64 16 64 3 16 9 21 14
2 94 9 3 1 7 1 1 1 2
0.013
3.094
4.203
2.168
Figure 5: Prefetch Target Characteristics
4.1
Overview
Call-chain based prefetching is an all software approach which individually targets delinquent methods (methods which cause significant icache misses). For each delinquent method, predecessor methods in the call-chain are chosen as prefetch points, whose method prologue is augmented with instruction cache prefetch instructions for one or more delinquent targets. These prefetch points are selected based on criteria defined in the next subsection. There can be multiple prefetch points for a single target to ensure sufficient coverage of the target.
4.2
Choosing Prefetch Points
Prefetching needs to meet several criteria: it needs to be timely enough to be able to overlap the prefetch request with other work before the block’s next use, but not too far in advance because the prefetch request may be evicted from the cache before its use. The confidence in the request needs to be high to reduce the risk of cache pollution with data which will never be used. Confidence and miss distance are the two parameters we use in selecting prefetch points from the call-chain of the method to be prefetched. Confidence: given a call-graph G, containing a prefetch point at node m, and prefetch target at node n, confidence is the probability of reaching n by following a call path starting from m. When choosing prefetch points for a method, points with high confidence values will minimize the amount of cache pollution due to bad prefetches, because it is an indication that a target will be called if a prefetch point is reached. Miss distance is the parameter we use to ensure prefetch timeliness. It is computed as the number of misses on the path between the entry for the potential prefetch point and the entry for the target method. It is an indication of the amount of changing code and thus replacement demand on the path. By requiring a miss distance of at least one between the prefetch point and the target, we can ensure that
ually, followed by experiments to evaluate the effect of simultaneously prefetching for multiple methods. Before describing these experiments, we present the metrics we used to assess the effectiveness of our instruction prefetching.
90 80
Percentage
70
Potential Coverage
60
4.3.1
Same-methodinterference
50
Other-methodsinterference
40 30 20 10 0 8
16
24
32
40
Miss Distance
(a) Top Methods 1 2 3 4 5 6 7 8 9 10
Num. Prefetch Points 8 1 0 0 19 0 27 0 2 4 1
16
24
3 2 0 40 0 50 0 2 8 1
5 4 0 51 0 76 0 2 8 2
32 6 11 0 61 0 89 0 3 8 2
40 7 18 0 66 0 97 0 3 8 2
(b) Figure 6: Effect of Miss distance. The graph (a) shows potential coverage and interference at five different upper bounds of miss distance (x-axis), averaged across ten methods. When choosing a miss distance range, we want to maximize coverage, but at the same time keep interference low. The table (b) shows the number of prefetch points for each method at different miss distance upper bounds
the prefetch will not be late (the miss latency can be used to fulfill the prefetch). A suitable upper bound is used to avoid early prefetches. Early prefetches can increase cache pollution and lead to useless prefetches, where the prefetched data is evicted before it can be used by the target method. We use a confidence threshold and miss distance range to select prefetch points from predecessors in the call-chain for the method to be prefetched.
4.3
Results
Due to our interest in building a dynamic instruction prefetching mechanism into a Java Virtual Machine, we only consider prefetching for Java 1 methods (Java methods also constitute the majority of icache misses, at 71%.) We have implemented a trace-based algorithm to select prefetch points and studied its effects in simulation. We first studied the top ten delinquent methods listed in Figure 5 individ1 We
only consider JITTED Java methods
Metrics
Potential Coverage is the percentage of original (without prefetching) misses in the target method(s), that the chosen prefetch points issue prefetches for. Depending on the prefetch points chosen, prefetching will be carried out only for some invocations of the target method, and can therefore only eliminate misses incurred by these instances. Potential coverage is a measure of the maximum number of misses that can be eliminated using the chosen set of prefetch points. Actual coverage obtained can be less than potential coverage in the presence of same-method-interference described below. Interference gauges the negative effects of prefetching. We use two measures to quantify interference, namely same-method-interference and other-methods-interference. We define same-method-interference as misses incurred by a method in spite of issuing prefetches for that particular invocation of the method (indication of having prefetched too soon, resulting in eviction of the prefetched block before its use). For example, when m, a prefetch point for method n is entered, it will issue prefetches for n. Any misses that occur in n between this point and the exit of n will be counted as same-method-interference. Other-methods-interference refers to the increase in number of misses for other methods, compared to the original number of misses without prefetching, and is an indication of cache pollution resulting from prefetching. Percentage same-method-interference is calculated as a percentage of total original misses in the prefetched method (or methods if multiple methods are prefetched). Percentage other-methods-interference is calculated as a percentage of the total overall original misses. Measured Coverage is the percentage of original misses that are eliminated as a result of prefetching. We measure coverage for prefetched methods, all Java methods and all methods. Increase in Bandwidth represents the cost of prefetching in terms of additional data that must be transferred to the L1 icache. 4.3.2
Deciding When to Prefetch
Miss distance is one of the parameters we use in selecting prefetch points. A good miss distance value is one that yields prefetch points with high potential coverage and low interference. To gain a better understanding of how miss distance affects potential coverage and interference, and to help us choose a suitable miss distance upper bound, we studied the ten methods listed in Figure 5 individually. For each of the ten methods, we selected prefetch points using
Num. Num. Unique Prefetched Prefetch (Num Points Considered) 7 (10) 84 (100) 201(250)
95 589 952
% Potential Coverage (Prefetched Methods)
Prefetched Methods
76.6 75.8 76.6
52.4 58.4 60.2
% Measured Coverage Java 1.4 9.7 18.0
% Interference
Overall
Samemethod
1.0 6.8 12.6
22.1 16.8 14.6
Othermethods 0.3 1.3 1.2
% Bandwidth Increase 0.9 7.1 10.8
Figure 7: Prefetching Multiple Methods. This table presents results for cases when prefetching is performed for the top 10, 100, and 250 delinquent methods. We compute measured coverage, interference, and increase in bandwidth to evaluate the efficacy of our scheme. Measured coverage can also be interpreted as reduction in icache misses due to prefetching.
a confidence threshold of 0.9, a miss distance lower bound of 2 and five different values of miss distance upper bound: 8, 16, 24, 32, 40. The table in Figure 6 lists the number of prefetch points selected at different miss distance upper bounds. The number of prefetch points per method increases as miss distance increases. It is interesting to note that three methods have no prefetch points that fit the chosen criteria, whereas two methods have significantly more prefetch points than others. Comparing this information with the number of direct callers (last column) in Figure 5, we see that there is no strong correlation between number of prefetch points and number of direct callers. We gathered potential coverage and interference information for each prefetch point. Figure 6 shows the average behavior (averaged across the ten methods) for total (all prefetch points in the miss distance range) potential coverage and interference at different miss distance upper bounds. As the miss distance increases, potential coverage increases indicating that it might be late to trigger prefetching closer to the target. However, as expected, both samemethod-interference, and other-methods-interference also increase as miss distance increases. We choose a miss distance upper bound of 24, since it has good potential coverage without the slight increase in interference shown by higher values, to perform our simultaneous prefetching study described next. 4.3.3
Prefetching Multiple Methods
In the previous subsection, we analyzed the effects of our prefetching scheme when a single method was being prefetched at a time. But, as observed before, to obtain significant benefit, prefetching must be carried out for a large number of methods. Figure 7 presents the results for employing prefetching simultaneously for the top 10, 100, and 250 delinquent methods. Prefetch points are chosen using a confidence threshold of 0.9 and a miss distance range of [2,24]. The first column lists the number of methods with at least one prefetch point that fit the chosen criteria, and the number of methods targeted by the prefetching mechanism in braces. The second column lists the number of unique prefetch points found. Remember that it is possible for a single prefetch point to have multiple targets. The next column displays potential coverage for the prefetched methods
with the chosen set of prefetch points. The three columns under % Measured Coverage list the achieved coverage for: prefetched methods, all Java methods, all methods respectively. Interference and % Increase in Bandwidth form the last two columns. Potential coverage for prefetched methods at a 0.9 confidence threshold and a [2,24] miss distance range is similar for all three cases, and is approximately 76%. Achieved coverage for prefetched methods is maximum in the third case at 60.2%, due to lower same-method-interference; From Figure 4, the top 250 Java methods account for roughly 40% of Java code. We are able to carry out prefetching for only 201 of these methods, and with a coverage of 60.2% for the prefetched methods, obtain an 18% coverage for Java code This comes at a cost of a 10.8% increase in bandwidth. As such coverage for Java methods, and overall coverage improvement scales linearly with the number of methods prefetched. Other-methods-interference, on the other hand, does not increase much, making it feasible to target a large number of methods. Refinements to our current algorithm for choosing prefetch points might further improve the coverage we can achieve.
5
Related Work
Code placement inspired by Pettis and Hansen [16] is widely employed in many systems. Their algorithm uses edge-profiling to build an undirected cyclic graph and uses a greedy approach to produce a code placement ordering. Our IBM Java [11] uses a dynamic approach to separate hot code from cold code, which brings most of the benefits of code placement. Annavaram et al [3, 4] discuss a profile-based software scheme for call graph prefetching for database applications. Their scheme uses a labeled call graph to insert a prefetch instruction for the first callee; a prefetch for the second callee function is inserted immediately after the call to the first callee function, and so on. To reduce cache pollution, only the first n cache lines of a function are prefetched; the rest of the callee function is prefetched after entering the callee function. Their scheme may not be timely enough for some prefetches due to the distance between the prefetching point and the first miss, although it may achieve some partial overlapping of misses. They also conclude that code positioning alone is not effective enough to reduce instruc-
tion cache misses because of several factors. For example, a number of small functions used in the design, each function called from many places, which could render procedure placement ineffective. Although code duplication or aggressive function inlining may be useful to eliminate some of the callers of a function so that code placement is more effective, the resulting code increase may result in an increase of the number of instruction cache misses. Based on the data presented in figure 5, we believe this will also be the case for WebSphere. Luk et al [13] discuss a cooperative hardware-software approach to prefetching. The compiler aggressively inserts prefetch instructions to prefetch the targets of control transfers far enough in advance, often in multiple ways. To reduce cache pollution by the software prefetches, hardware has a filtering mechanism to allow it to get far ahead without polluting the cache. Other approaches to instruction prefetching include using helper prefetching threads whose only purposes is to run ahead to provide prefetching for the main thread. [1]. This option is not explored here because server applications are typically highly multithreaded so the use of helper threads instead of worker threads may be a liability rather than an advantage. Another problems of their approach are the overhead of triggering helper threads and that helper threads need to run ahead enough of the worker threads to be able to hide latency.
6
Conclusions and Future Work
We presented a detailed characterization of instruction cache performance for IBM’s WebSphere Application Server and proposed a new call-chain based instruction prefetching mechanism to improve cache performance of large scale server applications. We evaluated the potential of our mechanism and found an 18% reduction in icache misses for Java code by targeting only a subset of executed methods. As part of future work, we plan to investigate several enhancements to our current scheme including: considering more events, in addition to method entry, in choosing prefetch points, refining our algorithm to optimize prefetch decisions in the presence of multiple methods to prefetch, and minimizing redundant or useless prefetches. We also plan to pursue our idea of bi-modal prefetching, which would distinguish between small and large methods and apply method-level or intra-procedural prefetching accordingly. Finally, we plan to convert our trace-based approach into an efficient, online prefetching mechanism for Virtual Execution Environments, like Java Virtual Machines.
References [1] T. M. Aamodt, P. Marcuello, P. Chow, A. Gonzalez, P. Hammarlund, H. Wang, and J. Shen. A framework for modeling and optimization of prescient instruction prefetch. In International Conference on Measurement and Modeling of Computer Systems (SIGMETRICS), June 2003. [2] A. Ailamaki, D.J. Dewitt, M.D. Hill, and D.A. Wood. DBMSs on a modern processor: where does time go? In The VLDB Journal, pages 266–277, 1999. [3] M. Annavaram, J. Patel, and E. Davidson. Call graph prefetching for database applications. In International Symposium on High Performance Computer Architecture (HPCA), February 2000. [4] M. Annavaram, J. Patel, and E. Davidson. Call graph prefetching for database applications. ACM Transactions on Computer Systems, 21(4):412–444, November 2003. [5] L. Barroso, K. Gharachorloo, and E. Bugnion. Memory system characterization of commercial workloads. In Proc. of the 26th Intl. Symp. on Computer Architecture, May 1999. [6] IBM Trade Performance Benchmark. Trade6. https://www14.software.ibm.com/webapp/iwm/web/preLogin.do?source=trade6. [7] P. Bohrer, J. Peterson, M. Elnozahy, R. Rajamony, A. Gheith, R. Rockhold, C. Lefurgy, H. Shafi, T. Nakra, R. Simpson, E. Speight, K. Sudeep, E. Hensbergen, and L. Zhang. Mambo: A full system simulator for the powerpc architecture. ACM SIGMETRICS Performance Evaluation Review, 31(4):8–12, March 2004. [8] H. W. Cain, R. Rajwar, M. Marden, and M. H. Lipasti. An architectural evaluation of Java TPC-W. In Proc. of the Seventh Intl. Symp. on High-Performance Computer Architecture, pages 229–240, Monterrey, Mexico, January 2001. [9] Q. Cao, P. Trancoso, J. Larriba, J. Torrellas, B. Knighten, and Y. Won. Detailed characterization of a quad pentium pro server running TPCD. In Proc. of the IEEE International Conference on Computer Design, 1999. [10] Standard Performance Evaluation Corporation. Specjappserver2004 benchmark. http://www.spec.org/jAppServer2004/, 2004. [11] N. Grcevski, A. Kielstra, K. Stoodley, M. Stoodley, and V. Sundaresan. Java just-in-time compiler and virtual machine improvements for server and middleware applications. In Proceedings of the 3rd Virtual Machine Research and Technology Symposium (VEE), 2004. [12] K. Keeton, D. Paterson, Y.Q. He, R. C. Raphael, and W. Baker. Performance characterization of a quad pentium pro smp using oltp workloads. In Proc. of the 26th Intl. Symp. on Computer Architecture, pages 25–26, May 1998. [13] C-K. Luk and T. C. Mowry. Architectural and compiler support for effective instruction prefetching: A cooperative approach. ACM Transactions on Computer Systems, 19(1):71–109, February 2001. [14] A. M. G. Maynard, C. M. Donnelly, and B. R. Olszewski. Contrasting characteristics and cache performance of technical and multi-user commercial workloads. In Proc. of the Sixth Intl. Conf. on Architectural Support for Programming Languages and Operating Systems, pages 145–156, 1994. [15] P. Nagpurkar, M. Hind, C. Krintz, P. Sweeney, and V.T. Rajan. Online Phase Detection Algorithms. In International Symposium on Code Generation and Optimization (CGO), 2006. [16] K. Pettis and R. Hansen. Profile guided code positioning. In International Conference on Programming Language Design and Implementation (PLDI), June 1990. [17] T. Sherwood, S. Sair, and B. Calder. Phase tracking and prediction. In 30th Annual International Symposium on Computer Architecture, June 2003. [18] The Standard Performance Evaluation Corporation. SPEC JBB 2000. http://www.spec.org/osg/jbb2000, 2000.