IEEE TRANSACTIONS ON MEDICAL IMAGING, VOL. 27, NO. 2, FEBRUARY 2008
161
A Surface-Based Approach to Quantify Local Cortical Gyrification Marie Schaer*, Meritxell Bach Cuadra, Lucas Tamarit, François Lazeyras, Stephan Eliez, and Jean-Philippe Thiran, Senior Member, IEEE Abstract—The high complexity of cortical convolutions in humans is very challenging both for engineers to measure and compare it, and for biologists and physicians to understand it. In this paper, we propose a surface-based method for the quantification of cortical gyrification. Our method uses accurate 3-D cortical reconstruction and computes local measurements of gyrification at thousands of points over the whole cortical surface. The potential of our method to identify and localize precisely gyral abnormalities is illustrated by a clinical study on a group of children affected by 22q11 Deletion Syndrome, compared to control individuals. Index Terms—Cortical complexity, gyrification, neuroimaging, statistical analysis, surface-based anatomical modeling.
I. INTRODUCTION PPREHENDING the complexity of cortical folding remains one of the most formidable challenges following recent advances in neuroimaging techniques [1], [2]. The increasing interest in the study of cortical complexity is driven by its potential to delineate and understand normal maturation [3]–[5], abnormal brain development [6]–[16], or neurodegenerative processes [2], [17], [18]. For example, an increase in the frontal cortical complexity during childhood suggests that normal ongoing maturational processes continuously remodel the cortical shape [4]. As the elastic properties and microstructure of neuronal sheets [19] and axonal connectivity [20] influence cortical folding, cortical complexity may reveal the underlying structural configuration of the brain. Also, cortical complexity may convey crucial information in the understanding of pathological processes associated with neurodevelopmental dis-
A
Manuscript received March 8, 2007; revised June 19, 2007. This work was supported in part by the Swiss National Research Funds under Grant 323500111165, Grant 3200-063135, Grant 3232-063134, and Grant PP00B-102864 and by a grant from the NARSAD Institute. This work was also supported by the Center for Biomedical Imaging (CIBM) of the Geneva—Lausanne Universities and the EPFL, as well as the foundations Leenaards and Louis-Jeantet. Asterisk indicates corresponding author. *M. Schaer is with Service Médico-Pédagogique, Department of Psychiatry, University of Geneva School of Medicine, 1211 Geneva, Switzerland and with Signal Processing Institute, Ecole Polytechnique Fédérale de Lausanne, 1015 Lausanne, Switzerland (e-mail:
[email protected]). M. Bach Cuadra and J.-P. Thiran are with Signal Processing Institute, Ecole Polytechnique Fédérale de Lausanne, 1015 Lausanne, Switzerland (e-mail:
[email protected];
[email protected]). L. Tamarit is with Image and Signal Processing Laboratory, School of Engineering, 1211 Geneva, Switzerland (e-mail:
[email protected]). F. Lazeyras is with Department of Radiology, Geneva University Hospitals, 1205 Geneva, Switzerland (e-mail:
[email protected]). S. Eliez is with Service Médico-Pédagogique, Department of Psychiatry, University of Geneva School of Medicine, 1211 Geneva, Switzerland and with Department of Genetic Medicine and Development, University of Geneva School of Medicine, 1205 Geneva, Switzerland (e-mail:
[email protected]). Digital Object Identifier 10.1109/TMI.2007.903576
orders. For example, it has been suggested that increased gyrification in Williams syndrome relies on a developmental arrest due to microvascular infarcts during early cortical development [15]. Altogether, these findings suggest that cortical complexity subtly reflects underlying biological processes associated with normal or abnormal cognitive functioning. Therefore, the development of reliable and precise algorithms to study gyrification is certainly key in our future understanding of normal and abnormal brain development. Initial moves to assess cortical complexity were made in the second half of the twentieth century by comparative neuroanatomists, who had observed that an increase in the cortical area during mammalian evolution was accompanied by an increase in folding [21], [22]. They proposed the use of a simple zero-order surface ratio to quantify cortical folding. The Gyrification Index (GI) was defined as the ratio of the total folded cortical surface over the perimeter of the brain, delineated on 2-D coronal sections [23]. Because of its easy interpretation and its simplicity in implementation, many studies have been conducted using the Gyrification Index to identify abnormal cortical complexity in neurodevelopmental and psychiatric disorders [8]–[10], [12], [14]–[16], [24], [25]. However, dissent regarding traditional methodological usage of the Gyrification Index remains a major issue. First, surfaces are delineated on coronal sections, which do not take into account the inherent 3-D nature of the cortical surface. Perimeter measurements may be biased by slice orientation, and buried sulci cannot always be included. Also, the precise localization of gyral anomalies in sublobar regions is not possible in 2-D slices. Last but not least, most studies (except [14], [15], [26]) used manual delineation of the contours, which raises the question of reliability and reproducibility in the context of large-scale studies. Recently, there have been some attempts to adapt the Gyrification Index to a fully automated 2-D method [27]. Technological developments now provide high quality 3-D reconstructions of the cortex (e.g., FreeSurfer [28] or SureFit [29]). The use of 3-D reconstruction overcomes the problems caused by manual tracing, as well as the problem of buried sulci. To date, attempts to advance a 3-D extension of the Gyrification Index were either global [30] or based on sulcal regions of interest [31]. As the cortex is thought to grow by radial expansion [32], a 3-D approach of the Gyrification Index that is not restrained by the sulcal walls would be of great interest in specifying the regions of abnormal cortical expansion associated with specific pathological conditions. In this paper, we present a new method to quantify and compare local cortical gyrification at thousands of points over the whole hemisphere. Our local 3-D Gyrification Index ( GI) measures the amount of cortical surface invaginated in the sulci,
0278-0062/$25.00 © 2007 IEEE
162
IEEE TRANSACTIONS ON MEDICAL IMAGING, VOL. 27, NO. 2, FEBRUARY 2008
Fig. 1. Illustration of the 2-D Gyrification Index as originally described by Zilles [23] (figure from [14]). GI is classically computed on coronal sections, after volume realignment in the AC-PC plane, as the ratio of the pial perimeter (in white) over the outer perimeter (in gray).
in circular regions of interest. We tested the potential of our method to identify and localize subtle gyral anomalies, by conducting a group comparison between 12 girls affected by 22q11 Deletion Syndrome, a neurodevelopmental condition of genetic origin [33], and 12 typically developing children matched for ). age (girls only, mean age The rest of this paper is organized as follows. In Section II, we introduce the new method for quantifying the local Gyrification Index ( GI). Section III presents a clinical implementation of the method based on 24 young girls. Finally, in Section IV, we briefly discuss the results of our statistical analysis, and develop the relationship between GI and the other methods for measuring cortical shape. II. A NEW SURFACE-BASED METHOD FOR QUANTIFYING LOCAL GYRIFICATION The Gyrification Index is commonly computed on coronal sections using the following equation [23]:
(1) is the pial cortical perimeter of where indexes the slice, slice is the outer perimeter of slice is slice thickness, and is the number of slices in the image (see Fig. 1). A. Three-Dimensional Extension of GI We first extend the Gyrification Index in a 3-D space, using the areas of cortical mesh models instead of perimeters. In our implementation using mesh models with triangular faces, the following equation replaces the classical 2-D GI:
(2)
and are the area of the face in the 3-D mesh where of the pial surface and of the outer surface, respectively, and and are the total number of faces in the pial and outer mesh, respectively. In order to compute the outer surface, Batchelor [30] proposed the use of the convex hull of the pial surface. However, as mentioned in [35] and [36], the convex hull is not really an accurate representation of the envelope of the brain, because it does not adhere to the hemisphere. That is why Batchelor called it a convexity ratio and not a 3-D-Gyrification Index [30]. The minimal value for the convexity ratio correspond a smooth and perfectly convex object (i.e., convexity ratio equal to 1). We want the 3-D-Gyrification Index to be minimal for a smooth object having the same general shape as the hemisphere (i.e., with no sulci). Therefore, the outer surface was specifically reconstructed for that purpose. The following section presents the surface reconstruction process. The whole process is summarized in Fig. 2. 1) Pial Surface: The pial cortical surface is first reconstructed in 3-D space, with a submillimeter accuracy. In our work, this is done using the FreeSurfer [28] software that subdivides the process into several subtasks. First, the intensity of the original medical resonance imaging (MRI) is normalized and voxels not considered as brain tissue are removed using a “skull-stripping” procedure. Second, brain tissue segmentation is completed, based on intensity information, on the laminar structure of the gray–white matter interface [28] and on an automated atlas-based subcortical masking [37]. The segmentation process thus results in a single filled white matter volume for each hemisphere, which is covered with a triangular tessellation (white surface). Then, this initial tessellation is repositioned using a deformable surface algorithm that minimizes an energy term guided by local MRI intensity values [38], resulting in two smoothed tessellated cortical hemispheres. Finally, the same surface deformation algorithm is applied from the white surface toward the gray matter—CSF interface, resulting in the pial surface. Moreover, the self-intersection in the surfaces is prevented [38]. The white matter and pial surfaces are careful inspected, and topological defects resulting in inaccurate or nonspherical surfaces are removed manually. The resulting pial surface is derived from the white surface with a point-to-point correspondence [28], and is topologically correct with no self-intersection [39]. For these reasons, 3-D reconstructions of the cortical surface cope more successfully with the problem of buried sulci than 2-D perimeters, which are not continuous and have no correspondence between the inner and outer faces of the cortical mantle. At this point, a 3-D mesh of the pial surface consisting of vertices, with an average face area of 0.5 mm , becomes available and its envelope (outer surface) needs to be computed. 2) Outer Surface: As proposed in [35] and [36], an outer hull tightly warping the pial surface can be efficiently computed using a morphological closing operation. For this purpose, we first convert the pial mesh into a binary volume, and then close the sulci using a sphere of 15 mm diameter as the structural element. The diameter of 15 mm was experimentally chosen in that it closes the main sulci. Kao et al. [35] used 10 mm, but observed in their experiment that a 50% increase or decrease in
SCHAER et al.: A SURFACE-BASED APPROACH TO QUANTIFY LOCAL CORTICAL GYRIFICATION
163
Fig. 2. Block diagram summarizing the main steps of our method for pial surface reconstruction (top row) and outer surface reconstruction (bottom row) before measuring the local Gyrification Index.
this parameter does not substantially affect the result. Finally, we create a 3-D triangulated mesh on the binary closed volume. The resulting outer mesh is typically made of an average vertices number of 55 000, with an average face area of 0.4 mm . At this point, a global 3-D extension of the Gyrification Index can be computed using (2). The main purpose of this work is, however, to propose a local measurement of the Gyrification Index, which we set out in detail in the following section. B. Local Gyrification Measurements for Each Vertex of the Outer Surface In 2005 [31], Rettmann proposed a local Gyrification Index based on sulcal regions of interest, with the purpose of quantifying the local amount of cortex buried within the sulcal folds, in specific sulcal regions. This measurement is an interesting localized variation of the 3-D Gyrification Index, but remains constrained in areas defined by the sulcal walls. Thus, sulcal-based GI depends heavily on accurate and robust sulcal segmentation, and could be related to a sulcal depth measurement. We propose a local Gyrification Index measurement, that we here denote GI, which is not constrained by the sulci. The GI at a given point on the cortical surface is computed as the ratio between the surface of a circular region of interest on the outer surface, centered at this point, and the surface of the corresponding region of interest on the pial surface. At each point on the outer surface, it reflects the amount of cortex buried within the sulcal folds in the surrounding area. Formally
(3) where is the area of the face of the outer surface. The surface • of the region of interest ROI on the outer surface is calculated as the sum of those areas for all faces comprised with a sphere in the intersection of the outer surface centered on vertex of the outer surface with a radius . is the area of the face of the pial surface. The surface • of the region of interest ROI on the pial surface is calculated as the sum of those areas for all faces belonging to
. The corthe corresponding pial region of interest respondence between the regions of interest on the outer (ROI ) and pial (ROI ) surfaces is described in the following section. 1) ROI on the Outer Surface, ROI : For each vertex of the outer envelope, we define a circular region of interest with a sphere through the intersection of the outer surface centered on with a radius [Fig. 3(a)]. To set this radius, we specifically kept in mind that its diameter has to remain larger than the gyral width, so that it can take into account more than one sulcus at a time. Based on visual inspection, we first choose a radius of 25 mm for the GI calculation, as it integrates an appropriate number of sulci but still allows for an accurate localization in sublobar regions [see Fig. 3(c)–(e)]. In a second time, we tested the effect of different radii on GI measurements; the results of this analysis are presented in Section II-D. 2) Region of Interest on the Pial Surface, ROI : For each ROI , we define a corresponding area ROI on the pial surface. First, we isolate the vertices of the outer surface that are situated on the perimeter of the ROI [Fig. 3(b)]. To avoid redundancies, we retain only one fifth of the vertices situated on the perimeter of the ROI . Then, we find the vertices of the pial mesh that are closest to each of the outer perimeter’s selected points [Fig. 3(c)]. The vertices defined on the pial mesh at that point are considered as the perimeter of the future ROI . In order to close the pial ROI, the vertices are linked via the geodesic path1 between them [Fig. 3(d)]. The ROI comprises all the faces of the pial mesh contained within the resulting closed path [Fig. 3(e)]. Thus, the ROI considers the full depth and width of all the sulci opening at the brain surface in the perimeter defined by the ROI . At this point, GI value is computed for each of the vertex of the outer surface according to the (3). C. Cortical Maps of GI In order to obtain cortical maps of local gyrification for subsequent statistical comparisons, we propagate the GI values from the outer mesh to the pial mesh. Accurate comparison of any 1Using the “dijk” function by Michael G. Kay, MATLOG toolbox, http:// www.ise.ncsu.edu/kay/matlog/
164
IEEE TRANSACTIONS ON MEDICAL IMAGING, VOL. 27, NO. 2, FEBRUARY 2008
Fig. 3. Illustration of the different steps for l GI computation. In the upper row, the creation of the outer region of interest ROI is shown on the outer surface (red); in the lower row, the creation of the pial region of interest ROI on the pial surface (blue) is illustrated. In (a), a sphere S (v ; r) centered on v of radius and the sphere defines the outer region of interest ROI (b in r = 25 mm is plotted on the outer surface (red). The intersection between the outer surface S blue). The perimeter of the ROI is delineated in blue in (c). In (d), the points of the pial surface (blue) corresponding to the ROI perimeter are highlighted in red. Linking of these points is achieved through the geodesic path between them, resulting in the ROI perimeter (in red, in e). The faces of the pial mesh enclosed by the ROI perimeter define the pial region of interest. Finally, the l GI value attributed to the vertex v (b, red point) is computed as the ratio of the areas of both corresponding regions of interest.
cortical feature (i.e., cortical thickness, sulcal depth, gyrification, etc.) between two different subjects relies on a precise mapping between each cortical region in the brain of individual and a corresponding region in another. Surface-based registration using spherical coordinates system guided by sulcal aligment has proven its accuracy in localizing structural and functional features of the human cortex [40]. As the GI quantifies the spatial frequency and the depth of sulci, a precise intersubject registration based on sulcal patterns is crucial, to avoid differences in gyrification caused by misalignment. For this reason, we need to put the data back to the subject’s own coordinate system, in other words we need pial cortical maps in which each vertex is attributed an GI value. The aim of the propagation is to redistribute GI values to the pial surface, with respect to their prior involvement in the whole computational process. Each vertex of the pial surface will receive a weighted part of the GI value for which he contributed to, weighting being inversely proportionate to the distance between the and the normal axis to the outer surface at the vertex at which GI was measured (the center of the outer ROI). Mathematically
(4)
where the sum is taken over all GI values associated with in which the vertex of the pial surface was considered; is the local GI as defined in (3) at the vertex belonging to the outer surface , and is the distance to the normal axis X of the vertex . Note from the vertex that (5) D. Effect of the Sphere Radius on the GI Cortical Maps As expected, the individual variance of the GI values plotted in Fig. 4 indicates that maximal values are located around the sylvian fissure. This major maximum reflects the large amount of insular cortex hidden within the sylvian fissure during early gyrogenesis. Using a radius of 20 or 25 mm, other (more moderate) local maxima are observed along the intraparietal sulcus, the superior temporal sulcus, and near the intersection of the parieto-occipital sulcus and the calcarine sulcus. Similar to the sylvian fissure, the other moderate maxima are located in sulci that are among the first to appear in the fetal cortex during development [41], strengthening the hypothesis that GI may be closely tied to neural development. With larger radii, GI cortical maps are progressively smoothed; and the maxima on the lateral aspect of the hemisphere are diluted, resulting in a single large maximal convergence around the sylvian fissure. This convergence brings to mind images from Toro and Burnod’s [42]
SCHAER et al.: A SURFACE-BASED APPROACH TO QUANTIFY LOCAL CORTICAL GYRIFICATION
165
Fig. 4. Example of color overlays of l GI, using a radius of 20, 25, 30, and 35 mm. For each radius, lateral, dorsal, and medial views of the right hemisphere are presented, along with their corresponding scale. The histograms in the bottom row display the distribution of l GI measurements. Using a radius of 20 mm, l GI values range from 1.2 and 5.1, whereas increasing the radius narrows the range of l GI values (for 35 mm: 1.5–3.5). On the 20-mm color-coded cortical map, maximal l GI measurements are observed around the sylvian fissure, the intraparietal sulcus, the superior temporal sulcus and, on the medial view, at the intersection of the parieto-occipital with calcarine sulci). Those maxima are progressively smoothed by larger radii, so that only two diffuse maxima are visible with a 35 mm radius. The histograms resulting from larger radii show a concomitant evolution toward a Gaussian distribution of l GI values.
and Clouchoux et al. [43] work on parameterization of the cortical surface. Both group’s attempts at registering cortical surfaces with minimal distortion suggest an orthogonal organization schema of cortical folding patterns, with the main sulci oriented in longitudinal and latitudinal directions around the insular pole and the central sulcus. Therefore, it is of developmental interest that cortical GI maps using a large radius also demonstrate convergence in the sylvian fissure. Given that our method aims to delineate local anomalies in gyrification, we use a more contrasted GI distribution for subsequent clinical analysis (a radius of 20 or 25 mm). III. CLINICAL APPLICATION 22q11 Deletion syndrome (22q11DS) is a neurogenetic condition affecting one per 5000 live births [44]. Typical symptoms include physical anomalies [44], [45], cognitive impairment [46], and psychiatric symptoms [46], [47].
Specifically, one-third of individuals affected will develop schizophrenia [47], [48], and 22q11DS is therefore considered as a genetic model for schizophrenia [49]. Cortical anomalies are thought to be key in the cognitive and psychiatric phenotype, as decreased cortical volume is classically observed [50], [51]. Clinical observations reported severe cases of polymicrogyria mainly restricted to the frontal, parietal, and perisylvian regions [52]–[57], providing evidence that cortical morphology is altered in the syndrome. To complement these qualitative observations, we previously conducted a quantitative analysis [14], using an automated algorithm for measuring the classical 2-D Gyrification Index [15]. In this earlier study, we identified decreased gyrification in the frontal and the parietal lobes of 37 patients with 22q11DS compared to 36 control subjects. We also observed that decreased Gyrification Index manifests with smaller gyri and shallower sulci in the patients’ brain, so that reduced GI in 22q11DS may represent a mild cortical malfor-
166
IEEE TRANSACTIONS ON MEDICAL IMAGING, VOL. 27, NO. 2, FEBRUARY 2008
Fig. 5. Statistical differences in the l GI values between patients and control subjects (lateral, frontal, and medial views of the average cortical surface). The regions showing significantly decreased l GI in patients with 22q11DS compared with normal controls are highlighted (colorbar: p value). Increased l GI in patients compared with controls is not observed in any of the cortical regions.
mation in a continuum toward the polymicrogyric appearance of the cortex reported in the most severely affected patients. In the present study, we aimed at conducting a clinical validation of our new method in a syndrome where abnormal gyrification has been qualitatively and quantitatively reported. Measuring gyrification at thousands of points over the whole hemisphere, we postulate that GI will provide a more precise localization of the gyral anomalies in the brain of patients affected by 22q11 Deletion Syndrome. A. Subjects and Imaging As a preliminary study intended to test the GI method, the analysis is restricted to the right hemisphere on a small sample of individuals only. Also, in order to avoid potential confounding effects, we selected stringently our groups with regards to age and gender. The control group consisted of 12 typically developing girls with no history of neurological or psychiatric disorders and with an average age of years old, and a mean IQ of 113. The patient group comprised 12 girls affected by 22q11 Deletion Syndrome, with an average , and a mean IQ of 74. Written informed consent age of was received from all the parents of the subjects, in accordance with protocols approved by the Institutional Review Board of University of Geneva. Cerebral T1-weighted MRIs were obtained using a Philips Intera 1.5 T scanner. Coronal images were acquired with a 3-D volumetric pulse sequence using the following scan parameters: ms, ms, cm mm, 124 slices. Cortical mesh models and local Gyrification Index at each vertex of the reconstructed surface were obtained according to the procedures described above. For GI calculations, we used a sphere radius of 25 mm. B. Statistical Analysis In order to compare the local value of the Gyrification Index obtained for each individual, the cortical surface was registered
to an average spherical surface representation that optimally align sulcal and gyral features across subjects [38], [40]. A study-specific template was created averaging the surfaces from the right hemisphere of the 24 subjects from our sample [40]. Data were then resampled for each participant into the common average spherical coordinate system aligning cortical folding patterns [38], [40]. Smoothing of the data on the mesh employed an iterative nearest-neighbor averaging procedure with full-width at half-maximum (FWHM) of 10 mm. Statistical GI difference maps were created computing a general linear model to assess the effect of diagnosis on the local GI value at each vertex. Due to the severely restricted age range, age was not included as a variable in the general linear model. Correction for multiple comparison was done using a false discovery rate of 0.01 to set the significance threshold, corresponding to an in our sample [58]. uncorrected C. Results Fig. 5 shows the statistical comparison of the GI in the right hemisphere between 12 girls affected by 22q11 Deletion Syndrome and 12 typically developing girls. We observe a significant GI decrease in the parietal region of the 22q11DS affected patients, with a large cluster extending from the posterior cinon the medial aspect gulate into the precuneus of the hemisphere, and a cluster around the postcentral sulcus on the lateral aspect. We also observe another cluster in the temporal lobe, around the medial and superior tem. There is no region of increased GI in poral sulci 22q11DS individuals compared to control subjects. Fig. 6 provides a comparison between the average value of GI and the classical 2-D GI for all vertices over the right hemisphere. Mean 2-D-GI values for the right hemisphere are consistent with our previous study on a larger sample of individuals with 22q11DS [14], no significant differences observed between . Perimeters measurements on coronal secgroups tions are sensitive to slice orientation [59] or may be biased by the difficulty to include buried sulci, resulting in a large variance in whole-hemisphere 2-D-GI measurements. Due to their
SCHAER et al.: A SURFACE-BASED APPROACH TO QUANTIFY LOCAL CORTICAL GYRIFICATION
167
be related to differences in age, gender or sample size between the two studies. Although the present study was intended as a proof-of-concept on a restricted sample of individuals, these preliminary results further define the pattern of cortical malformations associated with 22q11DS syndrome. Replication of the analyses on both hemispheres in a more diversified sample of patients will certainly help in the understanding of the biological basis associated with the cognitive and psychiatric phenotype of affected individuals. B. Methods Measuring Cortical Complexity
Fig. 6. Plots showing mean and standard deviation of right hemisphere l GI values and classical 2-D-GI measurements in each group. The 2-D-GI values resulting from the semi-automated method, as measured in [14], show a large standard deviation, with average 2-D-GI appearing even higher in patients with 22q11DS than controls. This difference is far from significant (F = 0:803; p = 0:380), as demonstrated by the overlapping confidence intervals. By contrast, despite the small sample size, 3-D GI detects a difference between the groups, showing reduced average l GI in patients compared to = 11:776; p = 0:002). controls (F
large standard deviations, classical 2-D approaches for measuring Gyrification Index may not be appropriate for delineating group differences. However, the use of accurate 3-D cortical reconstruction drastically reduces the variance in these measurements, and we observe a significantly smaller average GI value in the right hemisphere of patients compared to controls . IV. DISCUSSION A. Clinical Results The aim of the clinical study was to test the behavior of our local Gyrification Index on patients affected by 22q11 Deletion Syndrome. Radiologists reported several cases of polymicrogyria in the syndrome, affecting particularly the parietal, perisylvian, and frontal regions. The only quantitative study to date [14] uses automated delineations of contours on coronal sections [15]. In this study, we previously found a decreased Gyrification Index in the frontal and parietal lobes of patients as compared to those with normal development. Despite the small sample size of the current study, the present results using GI are able to replicate previous qualitative and quantitative observations of decreased cortical complexity. Further, our method provides a finer topological localization of the anomalies, previously observed in the whole right frontal and parietal lobes. Specifically, we find decreased gyrification in the parietal lobe in two constricted regions: on the medial face of the parietal lobe, and around the postcentral gyrus on the lateral face (see Fig. 5). Also, we observe decreased GI in the medial third of the temporal lobe, which was missed by 2-D algorithm. In the frontal lobe, we, however, do not replicate our previous finding of decreased cortical complexity in this small sample of young girls with 22q11 Deletion syndrome. The latter discrepancy may
Apart from the classical GI, many different approaches have been described to study the interindividual variability in sulcal patterns. We offer a brief overview of the most frequently used in clinical studies, from the most global to the more localized approaches, and consider elements of comparison between these methods and GI. Fractal dimension (FD) has been proposed to provide global measurements of the cortical complexity based on a 3-D parametric mesh [60] or on a skeletonized binary volume [61]. Fractal dimension condenses information about the irregularity in the cortical shape over the whole hemisphere [7], [61], or in lobar regions [4], [13], [62]. FD is a compact measure that has been widely used to assess normal and abnormal brain development [7], [61], [63]–[65]. However, as recently discussed in [66], concrete geometrical interpretation of fractal dimension remains challenging. Compared to FD, GI is also able to condense information about the frequency and depth of sulci, but is easier to interprete. GI quantifies the proportion of cortical area which is buried within the sulci in a given area, and therefore directly depends upon the amount and size of the sulci. Other methods for assessing sulcal depth [17], [67], length [67], width [17], or asymmetry index [5] are grouped under the heading of sulcal morphometry. Sulci are classically identified with automated procedures using a congregation of neural networks [68]. Compared to sulcal morphometry, GI also reflects the sulcal conformation, but in a circular approach. Sulcal morphometry is based on the interesting idea that sulcal configuration can convey information about the early development of cortex. Analyses of sulcal pattern reveal the existence of “plis de passage,” which are reminiscent of the first folds [69]. As the cortex grows primarily by radial expansion [32], we postulate that GI is also able to reflect early cortical development, but in a different manner. Indeed, GI quantifies the excess or defect in cortical expansion in specific regions over the whole hemisphere. More recently, a curvature-based approach has been proposed for estimating local gyrification at thousands of points over the entire cortical surface [6], [70]. Smoothed absolute mean curvature quantifies the amount of local curvature on spherically-parameterized cortical mesh models. Among all the measurements of cortical complexity, smoothed absolute mean curvature is the closest to our algorithm. However, the essence of both measures differs, as can be illustrated using notions of differential geometry. Differential geometry is defined with respect to surfaces with zero-thickness, and thus may not
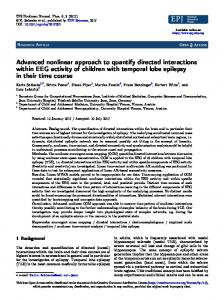
168
Fig. 7. Illustration of extrinsic and intrinsic properties of a surface using differential geometry. Extrinsic curvature refers to folding which is created with no distortion, as a sheet of paper that we can crumple. As illustrated by the triangle drawn on the left sheet, distances on the surface are not altered by bending; in other terms, extrinsic properties of a surface are not directly related to its area. Extrinsic curvature is measured mathematically using mean curvature, and directly characterizes the geometrical configuration of the surface in space. Intrinsic curvature denotes folding that has been created by distortion, or shearing, and is best understood using an example: folding a spherical surface without modifying its area is impossible. The figure on the right shows how the distortion of a sheet alters distances on its surface. Gaussian curvature measures the intrinsic curvature of a surface, in the sense that it captures the excess or deficit in the surface as compared to a plane at the point. (Adapted from [30]).
always be appropriate to characterize the cortical shape. However, differential geometry has been widely used to understand more fully and characterize measures of cortical shape (see [30], [71]–[73]). Mathematically, differential geometry allows the distinction of two kinds of curvature: extrinsic or mean curvature, and intrinsic or Gaussian curvature (see Fig. 7). Smoothed absolute mean curvature [70] is characteristically an extrinsic measurement, highly dependent upon surface configuration. Gaussian curvature quantifies the excess of deficit in area as compared to a plane in the nearest neighborhood on each point of the surface. GI resembles Gaussian curvature, but covers a wider area of 50 mm diameter. GI would be an alternative surface-based measure of Gaussian curvature only if the ROI perimeter exactly superposes the ROI contour, but, nevertheless, the ratio GI provides similar information. Thus, the mathematics of curvature illustrates that smoothed absolute mean curvature and GI capture different properties of the cortical geometry smoothed absolute curvature typically measures the shape of the cortical surface, whereas GI conveys information about the underlying cortical area. Therefore, we postulate that GI reflects easily interpretable biological correlates, such as cortical volume, or neuronal number. It is however important to note that intrinsic and extrinsic properties of a surface may be hardly distinguishable for highly convoluted surfaces, so that smoothed absolute curvature and GI may be geometrically related in some way which is difficult to a priori infer. Recently, inspired by smoothed absolute curvature method, other curvature-based descriptors were proposed to characterize more precisely local shape and size of cortical complexity [74]. Future work will certainly be needed to propose an integrative interpretation of the increasing variety of cortical complexity measures, toward a better understanding of normal gyral conformation and a clear etiopathogenic approach of cortical malformations. A last divergence between curvature-based methods and GI resides in the preprocessing of the images. To date, curvature-based approaches typically used affine transformation of the brain volume into the standard space of the International Consortium for Brain Mapping-305 (ICBM-305) average brain
IEEE TRANSACTIONS ON MEDICAL IMAGING, VOL. 27, NO. 2, FEBRUARY 2008
Fig. 8. Schematic 2-D illustration of the variation in the area of the outer region of interest ROI . As the outer surface is not perfectly planar, the area delineated through the intersection of the outer surface (in light gray) with a sphere centered at v (gray point) of radius r is larger than the area of a circle having the same radius r . This results in slight variations in the area of the outer region of interest. However, we assume that these variations are negligible as compared to the area of the pial region of interest (in dark gray).
[75] prior to cortical mesh models reconstruction [6], [70], [74], which may affect curvature measurements. In the current study, all the GI measurements were computed on cortical surfaces based on images in their native space. Independently of intersubject registration, the absence spatial normalization ensures that the observed differences are due to a real decrease in cortical area (related to diminished frequency and depth of sulci) rather than to an effect of scaling. V. LIMITATIONS OF THE PRESENT STUDY In the present study, we have proposed a new method for quantifying local gyrification, and promising results were shown. There are, however, some limitations in our approach. One limitation in our implementation of the GI is that the surface ratio is not measured on exactly the same outer area for each vertex. This means that we measure the amount of invaginated cortical surface in a slightly varying perimeter. In the present study, the ROI is obtained with the intersection of the outer surface with a sphere. As the outer surface is not (Fig. 8). planar, the resulting ROI area is not of exactly Specifically, in regions of high curvature of the outer surface, such as those near to the superior sagittal sinus, the area of the ROI is larger. We tested the impact of such variations on two subjects in the study. We found a standard deviation of less than 7.5% of the mean ROI area value for all the vertices of the hemisphere. This corresponds to a circular region on the outer surface having a mean radius of 28.8 mm (instead of the 25 mm of our sphere), with the minimum found at 26.4 mm and the maximum at 32.2 mm. In comparison, the standard deviation for the pial region of interest is of 31.5% of the mean ROI area (corresponding to planar circular regions from 29 mm radius to 64.5 mm); we therefore assume that the slight variation in the ROI areas is negligible compared to the differences between the ROI and ROI areas. The proposed approach requires a high amount of time to compute the GI evaluation for all the vertices. To compute each ROI perimeter, we first use the “Dijkstra” algorithm1 to find the shortest geodesic path between the selected vertices. Then, the whole ROI enclosed by the perimeter is found using neighborhood information. Both perimeter delineation and
SCHAER et al.: A SURFACE-BASED APPROACH TO QUANTIFY LOCAL CORTICAL GYRIFICATION
ROI reconstruction are time consuming, but robust. Furthermore, our code is implemented in MATLAB, which is probably not the most suitable for computing so many loops. However, the present manuscript is intended to present a feasibility study, and future developments will include an optimization for the speeding-up of the computational process. VI. CONCLUSION In this paper, we presented a new method for quantifying the Gyrification Index with a fine topological resolution over the whole hemisphere. Using validated procedures for accurate cortical reconstructions, we first implemented an outer surface closely enveloping the hemisphere. Then, we proposed a new algorithm for measuring a local Gyrification Index at each vertex of the entire cortical surface. The outcome of our method suggests that the decreased cortical complexity reported in 22q11 Deletion Syndrome may be powered by restricted regions of abnormal cortical expansion mostly located in the parietal lobe and on the medial surface of the hemisphere. ACKNOWLEDGMENT The authors would like to thank J. van Oosterom for proofreading the manuscript and J.-F. Mangin for helpful comments on parameterization of the cortical surface. REFERENCES [1] J. F. Mangin, D. Riviere, A. Cachia, D. Papadopoulos-Orfanos, D. L. Collins, A. C. Evans, and J. Regis, “Object-based strategy for morphometry of the cerebral cortex,” Inf. Process. Med. Imag., vol. 18, pp. 160–171, 2003. [2] P. M. Thompson, J. Moussai, S. Zohoori, A. Goldkorn, A. A. Khan, M. S. Mega, G. W. Small, J. L. Cummings, and A. W. Toga, “Cortical variability and asymmetry in normal aging and alzheimer’s disease,” Cereb. Cortex, vol. 8, no. 6, pp. 492–509, 1998. [3] E. Armstrong, A. Schleicher, H. Omran, M. Curtis, and K. Zilles, “The ontogeny of human gyrification,” Cereb. Cortex, vol. 5, pp. 56–63, 1995. [4] R. E. Blanton, J. G. Levitt, P. M. Thompson, K. L. Narr, L. CapetilloCunliffe, A. Nobel, J. D. Singerman, J. T. McCracken, and A. W. Toga, “Mapping cortical asymmetry and complexity patterns in normal children,” Psych. Res.: Neuroimag., vol. 107, pp. 29–43, 2001. [5] J. F. Mangin, D. Riviere, A. Cachia, E. Duchesnay, Y. Cointepas, D. Papadopoulos-Orfanos, P. Scifo, T. Ochiai, F. Brunelle, and J. Regis, “A framework to study the cortical folding patterns,” Neuroimage, vol. 23, pp. 129–138, 2004. [6] C. Gaser, E. Luders, P. M. Thompson, A. D. Lee, R. A. Dutton, J. A. Geaga, K. M. Hayashi, U. Bellugi, A. M. Galaburda, J. R. Korenberg, D. L. Mills, A. W. Toga, and A. L. Reiss, “Increased local gyrification mapped in williams syndrome,” Neuroimage, vol. 33, pp. 46–54, 2006. [7] T. H. Ha, U. Yoon, K. J. Lee, Y. W. Shin, J. M. Lee, I. Y. Kim, K. S. Ha, S. I. Kim, and J. S. Kwon, “Fractal dimension of cerebral cortical surface in schizophrenia and obsessive-compulsive disorder,” Neurosci. Lett., vol. 384, pp. 172–176, 2005. [8] A. Y. Hardan, R. J. Jou, M. S. Keshavan, R. Varma, and N. J. Minshew, “Increased frontal cortical folding in autism: A preliminary MRI study,” Psychiatry Res., vol. 131, pp. 263–268, 2004. [9] J. M. Harris, H. Whalley, S. Yates, P. Miller, E. C. Johnstone, and S. M. Lawrie, “Abnormal cortical folding in high-risk individuals: A predictor of the development of schizophrenia?,” Biol. Psychiatry, vol. 56, pp. 182–189, 2004. [10] J. M. Harris, S. Yates, P. Miller, J. J. Best, E. C. Johnstone, and S. M. Lawrie, “Gyrification in first-episode schizophrenia: A morphometric study,” Biol. Psychiatry, vol. 55, pp. 141–147, 2004.
169
[11] R. J. Jou, A. Y. Hardan, and M. S. Keshavan, “Reduced cortical folding in individuals at high risk for schizophrenia: A pilot study,” Schizophr. Res., vol. 75, pp. 309–313, 2005. [12] J. J. Kulynych, L. F. Luevano, D. W. Jones, and D. R. Weinberger, “Cortical abnormality in schizophrenia: An in vivo application of the gyrification index,” Biol. Psychiatry, vol. 41, no. 10, pp. 995–999, May. 15, 1997. [13] K. L. Narr, R. M. Bilder, S. Kim, P. M. Thompson, P. Szeszko, D. Robinson, E. Luders, and A. W. Toga, “Abnormal gyral complexity in first-episode schizophrenia,” Biol. Psychiatry, vol. 55, pp. 859–867, 2004. [14] M. Schaer, J. E. Schmitt, B. Glaser, F. Lazeyras, J. Delavelle, and S. Eliez, “Abnormal patterns of cortical gyrification in velo-cardio-facial syndrome (deletion 22q11.2): An MRI study,” Psychiatry Res., vol. 146, pp. 1–11, 2006. [15] J. E. Schmitt, K. Watts, S. Eliez, U. Bellugi, A. M. Galaburda, and A. L. Reiss, “Increased gyrification in williams syndrome: Evidence using 3-D MRI methods,” Dev. Med. Child. Neurol., vol. 44, pp. 292–295, 2002. [16] K. Vogeley, T. Schneider-Axmann, U. Pfeiffer, R. Tepest, T. A. Bayer, B. Bogerts, W. G. Honer, and P. Falkai, “Disturbed gyrification of the prefrontal region in male schizophrenic patients: A morphometric postmortem study,” Am. J. Psychiatry, vol. 157, pp. 34–39, 2000. [17] P. Kochunov, J. F. Mangin, T. Coyle, J. Lancaster, P. Thompson, D. Riviere, Y. Cointepas, J. Regis, A. Schlosser, D. R. Royall, K. Zilles, J. Mazziotta, A. Toga, and P. T. Fox, “Age-related morphology trends of cortical sulci,” Human Brain Mapp., vol. 26, pp. 210–220, 2005. [18] V. A. Magnotta, N. C. Andreasen, S. K. Schultz, G. Harris, T. Cizadlo, D. Heckel, P. Nopoulos, and M. Flaum, “Quantitative in vivo measurement of gyrification in the human brain: Changes associated with aging,” Cereb. Cortex, vol. 9, no. 2, pp. 151–160, 1999. [19] D. P. Richman, R. M. Stewart, J. W. Hutchinson, and V. S. Caviness, Jr., “Mechanical model of brain convolutional development,” Science, vol. 189, no. 4196, pp. 18–21, Jul. 4, 1975. [20] D. C. Van Essen, “A tension-based theory of morphogenesis and compact wiring in the central nervous system,” Appl Opt, vol. 385, no. 6614, pp. 313–318, Jan. 23, 1997. [21] H. Haug, “Brain sizes, surfaces, and neuronal sizes of the cortex cerebri: A stereological investigation of man and his variability and a comparison with some mammals (primates, whales, marsupials, insectivores, and one elephant),” Am. J. Anat., vol. 180, pp. 126–142, 1987. [22] H. J. Jerison, “Quantitative analysis of evolution of the brain in mammals,” Science, vol. 133, pp. 1012–1014, 1961. [23] K. Zilles, E. Armstrong, A. Schleicher, and H. J. Kretschmann, “The human pattern of gyrification in the cerebral cortex,” Anat. Embryol., vol. 179, pp. 173–179, 1988. [24] P. C. Sallet, H. Elkis, T. M. Alves, J. R. Oliveira, E. Sassi, C. C. de Castro, G. F. Busatto, and W. F. Gattaz, “Reduced cortical folding in schizophrenia: An MRI morphometric study,” Am. J. Psychiatry, vol. 160, pp. 1606–1613, 2003. [25] K. Vogeley, R. Tepest, U. Pfeiffer, T. Schneider-Axmann, W. Maier, W. G. Honer, and P. Falkai, “Right frontal hypergyria differentiation in affected and unaffected siblings from families multiply affected with schizophrenia: A morphometric MRI study,” Am. J. Psychiatry, vol. 158, pp. 494–496, 2001. [26] S. R. Kesler, B. Vohr, K. C. Schneider, K. H. Katz, R. W. Makuch, A. L. Reiss, and L. R. Ment, “Increased temporal lobe gyrification in preterm children,” Neuropsychologia, vol. 44, pp. 445–453, 2006. [27] T. W. Moorhead, J. M. Harris, A. C. Stanfield, D. E. Job, J. J. Best, E. C. Johnstone, and S. M. Lawrie, “Automated computation of the gyrification index in prefrontal lobes: Methods and comparison with manual implementation,” Neuroimage, vol. 31, pp. 1560–1566, 2006. [28] A. M. Dale, B. Fischl, and M. I. Sereno, “Cortical surface-based analysis I. segmentation and surface reconstruction,” Neuroimage, vol. 9, no. 2, pp. 179–194, Feb. 1999. [29] D. C. van Essen, J. Dickson, J. Harwell, D. Hanlon, C. H. Anderson, and H. A. Drury, “An integrated software system for surface-based analyses of cerebral cortex,” J. Amer. Med. Info. Assoc., vol. 8, pp. 443–459, 2001. [30] P. G. Batchelor, A. D. C. Smith, D. L. Hill, D. J. Hawkes, T. C. Cox, and A. F. Dean, “Measures of folding applied to the development of the human fetal brain,” IEEE Trans. Med. Imag., vol. 21, no. 8, pp. 953–965, Aug. 2002.
170
IEEE TRANSACTIONS ON MEDICAL IMAGING, VOL. 27, NO. 2, FEBRUARY 2008
[31] M. E. Rettmann, M. A. Kraut, J. L. Prince, and S. M. Resnick, “Crosssectional and longitudinal analyses of anatomical sulcal changes associated with aging,” Cereb. Cortex, vol. 16, pp. 1584–1594, 2006. [32] P. Rakic, “Radial unit hypothesis of neocortical expansion,” in Novartis Found Symp., 2000, vol. 228, pp. 30–42. [33] R. J. Shprintzen, “Velocardiofacial syndrome and digeorge sequence,” J. Med. Genet., vol. 31, pp. 423–424, 1994. [34] A. J. Barkovich, H. Rowley, and A. Bollen, “Correlation of prenatal events with the development of polymicrogyria,” AJNR Am. J. Neuroradiol., vol. 16, pp. 822–827, 1995. [35] C. Y. Kao, M. Hofer, G. Sapiro, K. Rehm, J. Stern, and D. Rottenberg, “A geometric method for automatic extraction of sulcal fundi,” IEEE Trans. Med. Imag., vol. 26, no. 4, pp. 530–540, Apr. 2007. [36] C. Y. Kao, M. Hofer, G. Sapiro, J. Stern, and D. Rottenberg, “A geometric method for automatic extraction of sulcal fundi,” in 3rd IEEE Int. Symp. Biomed. Imag.: Macro Nano, Arlington, VA, , 2006. [37] B. Fischl, D. H. Salat, E. Busa, M. Albert, M. Dieterich, C. Haselgrove, A. van der Kouwe, R. Killiany, D. Kennedy, S. Klaveness, A. Montillo, N. Makris, B. Rosen, and A. M. Dale, “Whole brain segmentationautomated labeling of neuroanatomical structures in the human brain,” Neuron (Cambridge Mass ), vol. 33, no. 3, pp. 341–355, Jan. 2002. [38] B. Fischl, M. I. Sereno, and A. M. Dale, “Cortical surface-based analysis II: Inflation, flattening, and a surface-based coordinate system,” Neuroimage, vol. 9, no. 2, pp. 195–207, Feb. 1999. [39] B. Fischl, A. Liu, and A. M. Dale, “Automated manifold surgery: Constructing geometrically accurate and topplogically correct models of the human cerebral cortex,” IEEE Trans. Med. Imag., vol. 20, no. 1, pp. 70–80, Jan. 2001. [40] B. Fischl, M. I. Sereno, R. B. Tootell, and A. M. Dale, “High-resolution intersubject averaging and a coordinate system for the cortical surface,” Hum. Brain Mapp., vol. 8, no. 4, pp. 272–284, 1999. [41] C. Garel, E. Chantrel, H. Brisse, M. Elmaleh, D. Luton, J. F. Oury, G. Sebag, and M. Hassan, “Fetal cerebral cortex: Normal gestational landmarks identified using prenatal MR imaging,” AJNR Am. J. Neuroradiol., vol. 22, pp. 184–189, 2001. [42] R. Toro and Y. Burnod, “Geometric atlas: Modeling the cortex as an organized surface,” Neuroimage, vol. 20, pp. 1468–1484, 2003. [43] C. Clouchoux, O. Coulon, D. Riviere, A. Cachia, J. F. Mangin, and J. Regis, “Anatomically constrained surface parameterization for cortical localization,” in Med. Image Comput. Comput. Assist. Interv. Proc., 2005, pp. 344–351. [44] R. J. Shprintzen, A. M. Higgins, K. Antshel, W. Fremont, N. Roizen, and W. Kates, “Velo-cardio-facial syndrome,” Curr. Opin. Pediatr., vol. 17, pp. 725–730, 2005. [45] R. Goldberg, B. Motzkin, R. Marion, P. J. Scambler, and R. J. Shprintzen, “Velo-cardio-facial syndrome: A review of 120 patients,” Am. J. Med. Genet., vol. 45, pp. 313–319, 1993. [46] A. Swillen, L. Vandeputte, J. Cracco, B. Maes, P. Ghesquiere, K. Devriendt, and J. P. Fryns, “Neuropsychological, learning and psychosocial profile of primary school aged children with the velo-cardio-facial syndrome (22q11 deletion): Evidence for a nonverbal learning disability?,” Child Neuropsychol., vol. 5, pp. 230–241, 1999. [47] D. Gothelf, G. Presburger, A. H. Zohar, M. Burg, A. Nahmani, M. Frydman, M. Shohat, D. Inbar, A. Aviram-Goldring, J. Yeshaya, T. Steinberg, Y. Finkelstein, A. Frisch, A. Weizman, and A. Apter, “Obsessive-compulsive disorder in patients with velocardiofacial (22q11 deletion) syndrome,” Am. J. Med. Genet. B. Neuropsychiatr. Genet., vol. 126, pp. 99–105, 2004. [48] A. S. Bassett, K. Hodgkinson, E. W. Chow, S. Correia, L. E. Scutt, and R. Weksberg, “22q11 deletion syndrome in adults with schizophrenia,” Am. J. Med. Genet., vol. 81, pp. 328–337, 1998. [49] K. C. Murphy and M. J. Owen, “Velo-cardio-facial syndrome: A model for understanding the genetics and pathogenesis of schizophrenia,” Br. J. Psychiatry, vol. 179, pp. 397–402, 2001. [50] S. Eliez, S. E. Antonarakis, M. A. Morris, S. P. Dahoun, and A. L. Reiss, “Parental origin of the deletion 22q11.2 and brain development in velocardiofacial syndrome: A preliminary study,” Arch. Gen. Psychiatry, vol. 58, pp. 64–68, 2001. [51] T. J. Simon, L. Ding, J. P. Bish, D. M. McDonald-McGinn, E. H. Zackai, and J. Gee, “Volumetric, connective and morphologic changes in the brains of children with chromosome 22q11.2 deletion syndrome: An integrative study,” Neuroimage, vol. 25, no. 1, pp. 169–180, Mar. 2005. [52] P. M. Bingham, D. Lynch, D. McDonald-McGinn, and E. Zackai, “Polymicrogyria in chromosome 22 delection syndrome,” Neurology, vol. 51, pp. 1500–1502, 1998. [53] H. Ehara, Y. Maegaki, and K. Takeshita, “Pachygyria and polymicrogyria in 22q11 deletion syndrome,” Am. J. Med. Genet. A, vol. 117, pp. 80–82, 2003.
[54] S. Ghariani, K. Dahan, C. Saint-Martin, H. Kadhim, F. Morsomme, S. Moniotte, C. Verellen-Dumoulin, and G. Sebire, “Polymicrogyria in chromosome 22q11 deletion syndrome,” Eur. J. Paediatr. Neurol., vol. 6, pp. 73–77, 2002. [55] H. Kawame, K. Kurosawa, A. Akatsuka, Y. Ochiai, and K. Mizuno, “Polymicrogyria is an uncommon manifestation in 22q11.2 deletion syndrome,” Am. J. Med. Genet., vol. 94, pp. 77–78, 2000. [56] L. Sztriha, R. Guerrini, B. Harding, F. Stewart, N. Chelloug, and J. G. Johansen, “Clinical, MRI, and pathological features of polymicrogyria in chromosome 22q11 deletion syndrome,” Am. J. Med. Genet. A, vol. 127, pp. 313–317, 2004. [57] S. Worthington, A. Turner, J. Elber, and P. I. Andrews, “22q11 deletion and polymicrogyria—cause or coincidence?,” Clin. Dysmorphol., vol. 9, pp. 193–197, 2000. [58] C. R. Genovese, N. A. Lazar, and T. Nichols, “Thresholding of statistical maps in functional neuroimaging using the false discovery rate,” Neuroimage, vol. 15, pp. 870–878, 2002. [59] K. Zilles, A. Schleicher, C. Langemann, K. Amunts, P. Morosan, N. Palomero-Gallagher, T. Schormann, H. Mohlberg, U. Burgel, H. Steinmetz, G. Schlaug, and E. Roland, “Quantitative analysis of sulci in the human cerebral cortex: Development, regional heterogeneity, gender difference, asymmetry, intersubject variability and cortical architecture,” Human Brain Mapp., vol. 5, pp. 218–221, 1997. [60] P. M. Thompson, C. Schwartz, R. T. Lin, A. A. Khan, and A. W. Toga, “Three-dimensional statistical analysis of sulcal variability in the human brain,” J. Neurosci., vol. 16, pp. 4261–4274, 1996. [61] J. M. Lee, U. Yoon, J. J. Kim, I. Y. Kim, D. S. Lee, J. S. Kwon, and S. I. Kim, “Analysis of the hemispheric asymmetry using fractal dimension of a skeletonized cerebral surface,” IEEE Trans. Biomed. Eng., vol. 51, pp. 1494–1498, 2004. [62] E. Luders, K. L. Narr, P. M. Thompson, D. E. Rex, L. Jancke, H. Steinmetz, and A. W. Toga, “Gender differences in cortical complexity,” Nat. Neurosci., vol. 7, pp. 799–800, 2004. [63] M. J. Cook, S. L. Free, M. R. Manford, D. R. Fish, S. D. Shorvon, and J. M. Stevens, “Fractal description of cerebral cortical patterns in frontal lobe epilepsy,” Eur. Neurol., vol. 35, no. 6, pp. 327–335, 1995. [64] L. Zhang, D. Dean, J. Z. Liu, V. Sahgal, X. Wang, and G. H. Yue, “Quantifying degeneration of white matter in normal aging using fractal dimension,” Neurobiol. Aging, 2006. [65] L. Zhang, J. Z. Liu, D. Dean, V. Sahgal, and G. H. Yue, “A three-dimensional fractal analysis method for quantifying white matter structure in human brain,” J. Neurosci. Methods, vol. 150, pp. 242–253, 2006. [66] K. Im, J. M. Lee, U. Yoon, Y. W. Shin, S. B. Hong, I. Y. Kim, J. S. Kwon, and S. I. Kim, “Fractal dimension in human cortical surface: Multiple regression analysis with cortical thickness, sulcal depth, and folding area,” Human Brain Mapp., vol. 27, no. 12, pp. 994–1003, 2006. [67] N. Molko, A. Cachia, D. Riviere, J. F. Mangin, M. Bruandet, D. Le Bihan, L. Cohen, and S. Dehaene, “Functional and structural alterations of the intraparietal sulcus in a developmental dyscalculia of genetic origin,” Neuron, vol. 40, pp. 847–858, 2003. [68] D. Riviere, J. F. Mangin, D. Papadopoulos-Orfanos, J. M. Martinez, V. Frouin, and J. Regis, “Automatic recognition of cortical sulci of the human brain using a congregation of neural networks,” Med. Image Anal., vol. 6, no. 2, pp. 77–92, 2002. [69] J. Regis, J. F. Mangin, T. Ochiai, V. Frouin, D. Riviere, A. Cachia, M. Tamura, and Y. Samson, ““Sulcal root” generic model: A hypothesis to overcome the variability of the human cortex folding patterns,” Neurol. Med. Chir. (Tokyo), vol. 45, pp. 1–17, 2005. [70] E. Luders, P. M. Thompson, K. L. Narr, A. W. Toga, L. Jancke, and C. Gaser, “A curvature-based approach to estimate local gyrification on the cortical surface,” Neuroimage, vol. 29, pp. 1224–1230, 2006. [71] L. D. Griffin, “The intrinsic geometry of the cerebral cortex,” J. Theor. Biol., vol. 166, pp. 261–273, 1994. [72] P. H. Todd, “Gaussian curvature as a parameter of biological surface growth,” J. Theor. Biol., vol. 113, pp. 63–68, 1985. [73] D. C. Van Essen and J. H. Maunsell, “Two-dimensional maps of the cerebral cortex,” J. Comput. Neurol., vol. 191, pp. 255–281, 1980. [74] D. Tosun, A. L. Reiss, A. D. Lee, R. A. Dutton, K. M. Hayashi, U. Bellugi, A. M. Galaburda, J. R. Korenberg, D. L. Mills, A. W. Toga, and P. M. Thompson, “Use of 3-D cortical morphometry for mapping increased cortical gyrification and complexity in williams syndrome,” in Proc. IEEE Int. Symp. Biomed. Imaging (ISBI): Nano Macro, Arlington, VA, , 2006, pp. 1172–1175. [75] J. C. Mazziotta, A. W. Toga, A. Evans, P. Fox, and J. Lancaster, “A probabilistic atlas of the human brain: Theory and rationale for its development the international consortium for brain mapping (ICBM),” Neuroimage, vol. 2, no. 2, pp. 89–101, Jun 1995.