Available online at www.sciencedirect.com
ScienceDirect Procedia - Social and Behavioral Sciences 104 (2013) 992 – 1001
2nd Conference of Transportation Research Group of India (2nd CTRG)
A Synchronized Model for Crash Prediction and Resource Allocation to Prioritize Highway Safety Improvement Projects Sabyasachee Mishraa* a
Assistant Professor, 3815 Central Avenue, Department of Civil Engineering, University of Memphis, Memphis, TN 38152, USA
Abstract Urban intersections are key locations of traffic crashes that contribute significantly to the economic losses. Safety management process undertaken by most states in the United States (U.S), is often referred to as the hazard elimination program which consists of three steps: (1) selections of hazardous locations, (candidate locations) where safety improvements are warranted, (2) development of countermeasures for potential reduction of crashes, (3) allocation of resources among the independent candidate locations in conformance to budgetary and other constraints. Often these three steps are independently considered with very limited detail on each step in the state planning agencies. This paper presents a simultaneous model which predicts the occurrence of crashes and allocates resources by maximizing benefits subjected to budget and other constraints. The analysis is carried out for a planning period of five years. The crash prediction is analysed as a negative binomial model. The resource allocation model is solved using branch and bound algorithm. Prediction and allocation is conducted simultaneously to achieve realistic results rather than analysing both steps independently. The allocation model further prioritizes the projects to be implemented to optimally distribute funds to maximize benefits. Model results reveal that the proposed approach can be used as a tool for resource allocation on highway safety projects for urban intersections. © 2013 The Authors. Published by Elsevier Ltd.
© 2013 The Authors. Published by Elsevier Ltd. Open access under CC BY-NC-ND license. Selection and peer-review under responsibility of International Scientific Committee.
Selection and peer-review under responsibility of International Scientific Committee.
Keywords: Negative Binomial model; Branch and bound algorithm; Resource allocation
1. Introduction Urban intersections are key locations of traffic crashes that contribute significantly to the economic losses nt of Transportation (USDOT) spend billions of dollars annually for safety improvement programs at urban intersections. Safety management process undertaken by most states is often referred to as the hazard elimination program which consists of three steps: (1) selections of hazardous locations, (candidate locations) where safety improvements are warranted, (2) development of countermeasures for potential reduction of crashes, (3) allocation of resources among the independent candidate locations in conformance to budgetary and * Corresponding author. Tel.: +1-901-678-5043; fax: +1-901-678-3026. E-mail address:
[email protected]
1877-0428 © 2013 The Authors. Published by Elsevier Ltd. Open access under CC BY-NC-ND license. Selection and peer-review under responsibility of International Scientific Committee. doi:10.1016/j.sbspro.2013.11.194
Sabyasachee Mishra / Procedia - Social and Behavioral Sciences 104 (2013) 992 – 1001
993
other constraints. Often these three steps are independently considered with very limited detail on each step in the state planning agencies. If agencies do not have an approach to allocate resources in an optimal manner as warranted by the occurrence of crashes, then it will lead loss of capital dollars for the agencies. The focus of this paper is in the third step, allocation of resources among mutually exclusive, location-specific alternatives and among a number of independent locations as a part of countermeasure are mentioned earlier to provide a broader perspective and are not a scope of this paper. determined as the predominant crash locations over the past years how to simultaneously predict and allocate resources to implement alternatives at these locations over a defined planning horizon to maximize benefits within budgetary and other
2. Literature Review The literature review is purposefully kept short because of the page limitation for conference paper. Literature shows that there are a number of studies devoted to identification of hazardous locations. But only a fraction of locations initially identified as hazardous are actually selected for implementation of safety projects because of funding limitations. These are discussed extensively in the literature (Tarko and Kanodia 2004; Hauer 1996; Deacon et al. 1975; Craig et al. 2007; Lambert et al. 2003; Cook et al. 2001; Hossain, and Muromachi 2011). Past research reveals the topic of resource allocation (using optimization techniques) span across diverse areas such as operations research, manufacturing, management, finance, and transportation. Optimization usually involves the maximization or minimization of an objective function comprising a set of decision variables, subject to various constraints (Bierman et al. 1997; Hillier and Liberman 2005). The constraints are designed to reflect limitations imposed by practical and / or policy considerations, expressed in the form of inequalities or equalities. Different optimization techniques such as linear programming (LP), integer programming (IP), nonlinear programming, and dynamic programming have been used to allocate resources on various engineering and management problems (Rau 1996; Wolsey and Nemhauser 1999). Resource allocation in highway safety research (Melachrinoudis and Kozanidis 2002; Harwood et al. 2003) is limited because of the need for integer programming to be combined with crash prediction model. While integer programming and crash prediction has been studied extensively their application in synchronization is not found. In this paper the author presents an approach to optimize the safety benefits in a given area by maximizing the dollar value of the crashes saved at intersections each year over a multi-year planning horizon while predicting crashes simultaneously during the optimization procedure.
3. Methodology The methodology section is discussed in two parts. First, a crash prediction model is presented to estimate number of crashes per location based on location specific attributes. Second, an optimization model is proposed to allocate countermeasures to maximize benefits from savings in crashes based on budget and other constraints.
3.1 Crash Prediction Model Crash frequencies on a highway section are discrete and non-negative integer values, the Poisson regression technique is a be overdispersed and has suggested using the negative binomial regression (Washington et al. 2011) model as an alternative. Using negative binomial regression model the probability of n crashes occurring on an intersection can be given by (1)
where P(ni) is the probability of n crashes occurring on an intersection i over a one year time period, and is the expected accident frequency (i.e., E(ni)) for intersection i. When applying the Poisson model, the expected accident frequency is assumed to be a function of explanatory variables such that (2)
994
Sabyasachee Mishra / Procedia - Social and Behavioral Sciences 104 (2013) 992 – 1001
Where Xi is a vector of explanatory variables that could include the geometry, tra c characteristics, and weather conditions of highway section i that determine accident frequency; and is a vector of estimable coefficients. EXP( ) is a gammadistributed disturbance term with mean of 1 and variance of . (3) The resulting probability distribution for the negative binomial distribution is (4)
The negative binomial model is used to predict crashes at intersection level with given highway geometry, and traffic conditions.
3.2 Optimization Model In the proposed model, the objective is to maximize the benefits Z derived from crashes saved for a set of locations upon implementation of alternatives for the proposed planning period of N years. The model is formulated as follows: Objective Function Maximize (5) In expression (1) the total benefits (objective function) is measured in terms of dollars from savings in fatal, injury and property damage only (PDO) crashes. For example the first term ( ) in expression (5) estimates the benefits received from savings in fatal crash; where is the expected number of fatal crashes for location i in analysis period n; is the is the cost of fatal crash (f) in crash reduction factor for property damage, p, for alternative j chosen for location I; and year n. Similarly accounts for savings from injury crash and for savings from PDO. In expression (1) is a decision variable which takes the value 1 when an alternative j is chosen for location i for the analysis year n, and the alternative is effective for kj years after installation; and 0 otherwise. Constraints Expression (6) is a budget constraint, and it ensures that the sum total of capital investment and operation and maintenance (O&M) cost should not exceed the total budget in the planning period, though there is a flexibility of expenditure between the years in the planning period. Such flexibility in expenditure between years within a planning period can be incorporated into the procedure through a Planning Budget Model (PBM) as applied in transit resource allocation (Mathew et al. 2010). PBM can be defined as a single budget considered for the entire planning period and is based on the assumption that
(6) In expression (6),
represents the capital cost of implementation of an alternative j for location i in year n; where
is the capital cost for alternative j implemented in location i in the analysis year n, and is an auxiliary binary decision variable for a new alternative implementation and takes the value 1 when a new alternative j is implemented at location i for the analysis year n, and the alternative is effective for the first year of installation (where kj=1); and 0 otherwise. Similarly, the term in expression (6) accounts for O&M cost; where is the O&M is cost for alternative j implemented in location i in the analysis year n, and is an auxiliary binary decision variable that exists only for an ). The total budget in expression (2) is alternative after first year of implementation but before the service life ( represented as , where is the budget available for year n. It should be noted that there is a flexibility of spending in individual years within the planning period.
995
Sabyasachee Mishra / Procedia - Social and Behavioral Sciences 104 (2013) 992 – 1001
, an alternative j, for location i, for year n (and effective for kj years after installation) is
Expression (7) ensures that
chosen from a set of pre-suggested alternatives ( alternatives tend to be location- specific.
for the analysis year n. Based on engineering design, the suggested
(7)
Expression (8) denotes that each location can receive only number of alternatives (
) for the analysis year n, pre-specified
by the planning agency. When the alternatives are mutually exclusive, the maximum value of
is equal to one for each
location (for the Base case), where number of alternatives are allocated to location i for year n (where type of alternative j may vary), the alternatives remain effective after installation for the remainder of service life. The benefits of alternatives for ) is included in the benefits expressed in the objective function. k years after installation (where (8) Where, (9)
(10)
(11) ,j,
(12) Expression (9) is a definitional constraint which takes binary values (one or zero) based upon allocation of an alternative j at location i. In expression (9), when a new alternative is implemented, is equal to one for the first year of implementation (kj=1) and values of
and
is equal to one for the remainder of service life (
). It should be noted that the
cannot be 1 simultaneously. Expression (9) ensures that when an alternative is implemented, no del
ensures two features; Feature 1: A location can receive only one alternative in a given year. Feature 2: A location, that has the carry-over effect from an alternative implemented in previous years, may not receive any funds during the service life of the alternative. (Note: Depending on the availability of funds, and other factors, it may be necessary to relax the second feature. It is discussed under relaxation of carry-over feature later. Expression (10) is a definitional constraint which denotes that,
, a binary variable indicator to be multiplied with the
capital cost of an alternative j selected for location i in the year n. is equal to one for the first year (kj=1), and zero for the remainder of the service life of the alternative. Expression (11) is a definitional constraint (similar to expression (10)) which ) indicator to be multiplied with operation and maintenance cost of an alternative j denotes that a binary variable ( selected for location i in the year n,
is equal to zero for the first year and one after the first year till the end of the service
996
Sabyasachee Mishra / Procedia - Social and Behavioral Sciences 104 (2013) 992 – 1001
life ( variables.
). Expression (12) is a non-negativity constraint of the decision variable
, and the auxiliary decision
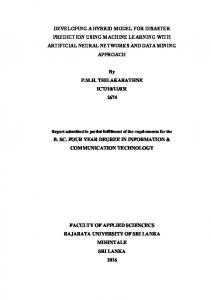
4. Study Area The state of Michigan is considered as the study area in this paper. The resource allocation model for highway safety improvements is applied to a set of 80 intersections in the Southeast Michigan region comprising Wayne (County-1), Washtenaw (County-2), St. Clair (County-3), and Oakland (County-4) counties. These 80 intersections selected for the example demonstration consist of 20 highest crash frequency locations from each of the four counties and are a sub-set of 25,000 intersections in the region. Certainly there is a need for a model to analyze a larger number of intersections recognizing that there are far more than 80 hazardous locations in the region. But to avoid the complexity of analyzing probable causes and designing location-specific appropriate countermeasures, a subset of 80 locations is selected for demonstration purposes. An implied assumption in limiting the study to intersections is that there is a targeted budget for the treatment of these types of locations. Annualized crash data (over a 10-year period) for 20 intersections from each county, for a total of 80, compiled from the website of the Southeast Michigan Council of Governments (SEMCOG) is presented in Figure 1 (SEMCOG 2008). These intersections are listed in decreasing order of total crashes in order of County-1 through County-4, and represent the demonstration platform for the proposed resource allocation model. Figure 1 show that locations in County-4 and County-3 has highest and least number of crashes respectively.
Crash Frequency
PDO
Injury
Fatal
100 90 80 70 60 50 40 30 20 10 0 1
21 County-1
41 Locations County-2
61 County-3
County-4
Figure 1: Crashes by Severity for all locations A detailed input data for all locations is shown in Table 1. In addition to total crashes, type of crash data is also shown ffor each location. Information on crash types, available from state police (not shown in Table 1) are typically used to design appropriate countermeasures for each location, as they provide significant insights to the probable causes of crashes and hence augment the design of countermeasures. Five hypothetical safety alternatives are proposed as the countermeasures for potential reduction in crashes. Also, for demonstration purposes, it has been assumed that between three to four of the five alternatives are applicable to each of the 80 locations, as shown in Table 1. This assumption was necessary to demonstrate the feature of the proposed resource allocation model. In reality, mutually exclusive alternatives are developed based upon engineering judgments, an analysis of the probable causes of the crashes, such that the likelihood of future crashes, (or severe injuries resulting from future crashes) is minimized. As an example, for location 1, alternatives I, II, III, and V are appropriate over the planning horizon. However, for a given year, these alternatives are mutually exclusive. Assignment of alternatives to locations is not presented in Table 1 for brevity.
Table 1. Input Data for All Locations
997
Sabyasachee Mishra / Procedia - Social and Behavioral Sciences 104 (2013) 992 – 1001
Crash Frequency County County-1
Intersection 1 2 . . 19 20 21 22
County-2 . .
39 40 41 42
County-3 . .
59 60 61 62
County-4 . .
79 80
Total 82.2 57.0 . . 44.0 43.8 68.0 59.2 . . 29.2 18.7 34.8 32.6 . . 12.7 9.4 92.5 76.4 . . 45.4 43.4
Fatal 0.1 0.0 . . 0.0 0.0 0.0 0.0 . . 0.1 0.0 0.1 0.0 . . 0.0 0.0 0.0 0.2 . . 0.0 0.0
Injury 17.4 12.0 . . 11.6 10.7 9.4 10.4 . . 4.8 4.4 7.8 9.5 . . 3.6 2.5 16.1 11.7 . . 10.4 10.3
Crash Type PDO 64.7 45.0 . . 32.4 33.1 58.6 48.8 . . 24.3 14.3 26.9 23.1 . . 9.1 6.9 76.4 64.5 . . 35.0 33.1
Rear-end 33.4 25.1 . . 20.8 14.3 33.2 25.8 . . 21.1 10.3 18.5 28.0 . . 2.1 2.9 41.5 29.8 . . 18.8 21.0
Angle 24.9 12.8 . . 8.2 12.5 14.8 21.5 . . 2.6 1.6 9.2 1.7 . . 7.5 2.4 20.1 26.2 . . 12.3 8.7
Swipe-same 5.7 6.1 . . 4.9 7.2 11.9 4.1 . . 4.0 3.2 3.1 1.0 . . 1.4 1.9 21.1 14.1 . . 3.9 4.1
Swipe-opp. 3.3 1.6 . . 0.6 1.7 1.2 0.5 . . 0.4 0.1 0.6 0.5 . . 0.1 0.1 1.5 2.8 . . 2.2 1.5
Head-on 9.0 8.9 . . 7.5 3.0 3.9 4.9 . . 0.4 0.7 1.1 0.5 . . 0.5 0.6 3.4 0.5 . . 5.0 5.1
Other 5.9 2.5 . . 2.0 5.1 3.0 2.4 . . 0.7 2.8 2.3 0.9 . . 1.1 1.5 4.9 3.0 . . 3.2 3.0
The capital cost of the proposed alternatives in increasing order is presented in Table 2. For the sake of simplicity, O&M costs have been assumed as 10 percent of the capital costs, and service lives for the alternatives are assumed to be generally proportional to the capital costs. Each alternative has been assumed to consist of a set of countermeasures and with hypothetical crash reduction factors (CRF) for each alternative. In reality, crash reduction factors for each countermeasure, along with its expected service life can be derived from the literature (Khasnabis et al. 2006; FHWA 2007, Mishra and Khasnabis 2012 each countermeasure are combined following a linear function to derive a combined CRF for the said alternative (FHWA 1981). The CRF values listed in Table 2 can be assumed to be associated with each alternative (that may be a combination of countermeasures).
Table 2. Crash Reduction Factors, Cost and Service Life of Alternatives Crash Reduction Factors Alternatives I II III IV V
Fatal 0.06 0.13 0.25 0.30 0.46
Injury 0.05 0.11 0.23 0.29 0.45
PDO 0.04 0.09 0.18 0.25 0.42
Capital Cost ($) 20,000 35,000 80,000 100,000 150,000
O&M Cost ($) 2,000 3,500 8,000 10,000 15,000
Service Life (Years) 2 2 3 4 4
5. Model Application In the case study an initial annual budget of $1.6 million is considered. The future year budgets are assumed to increase by six percent every alternate year over a five year planning horizon. The rationale behind selecting the above initial budget is discussed in the next section. Information on factors that need to be considered from year to year for all the proposed models:
998
Sabyasachee Mishra / Procedia - Social and Behavioral Sciences 104 (2013) 992 – 1001
mutually exclusive feature, carry-over factor , and year end surplus are tracked internally within the model. The model is applied to a sub-set of locations depicting reality to the extent possible to ensure a connection between the proposed process and its application / practice. An analysis period of five years is assumed in the example demonstration. The annual savings measured in ns as a measure of the monetary savings from reduction in crashes. Surplus is defined as difference between available budget and the amount committed for implementation of alternatives. The terms annual surplus and total surplus are used in the remainder of the paper for unused budget for annual and planning period respectively. The crash resource allocation model is solved by Integer Programming with branch and bound algorithm using Premium Solver Platform. (PSP 2010a, and PSP 2010b). Table 3 shows one year allocation of projects with minimum budget considering mutually exclusive nature of alternatives. If minimum cost alternative is chosen for 80 locations then budget becomes $1,600,000. When a manual allocation of projects with minimum cost alternatives are allocated the resulted benefit is $2, 980, 000 (Table 3). With the proposed optimization the resulted benefit is $6,788,149. The optimization procedure did not allocate projects to all locations, rather to location that need improvement to result savings in crashes resulting to maximum benefit. A partial demonstration of results in Table 3 shows that no locations in county 2 and 3 received any improvements. From optimization viewpoint this is logical because these locations consists of very low number of crashes and therefore did not warrant any improvements to maximize the total benefit. The optimization model resulted in 11 (1 in IV alternative and 10 V alternative) alternatives using the proposed budget as opposed to choosing all 80 locations with minimum budget.
Table 3. One Year Allocation Improvements (Optimized) County County-1
County-2
County-3
County-4
Total
Intersection 1 2 . . 19 20 21 22 . . 39 40 41 42 . . 59 60 61 62 . . 79 80
I 0 0 . . 0 0 0 0 . . 0 0 0 0 . . 0 0 0 0 . . 0 0 0
II 0 0 . . 0 0 0 0 . . 0 0 0 0 . . 0 0 0 0 . . 0 0 0
III 0 0 . . 0 0 0 0 . . 0 0 0 0 . . 0 0 0 0 . . 0 0 0
IV 0 0 . . 1 0 0 0 . . 0 0 0 0 . . 0 0 0 0 . . 0 0 1
V 1 0 . . 0 0 0 0 . . 0 0 0 0 . . 0 0 1 1 . . 0 0 10
Min Project Cost ($) 20,000 20,000 . . 20,000 20,000 20,000 20,000 . . 20,000 20,000 20,000 20,000 . . 20,000 20,000 20,000 20,000 . . 20,000 20,000 1,600,000
Minimum Benefit ($) 76,272 47,760
Optimized Project Cost ($) 150,000 0
Optimized Benefit ($) 708,677 0
42,527 40,282 45,071 44,606
100,000 0 0 0
361,415 0
. .
. .
. .
28,370 16,790 37,473 33,702 . .
0 0 0 0 . .
12,885 9,138 69,334 67,731 . .
0 0 0 0 . .
0 0 150,000 150,000 . .
40,080 39,182 2,980,006
0 0 661,597 622,113 . .
0 0 1,600,000
0 0 6,788,149
Results of optimization for the Base case (a) for a planning period of five years are shown in Table 4. Table 4 shows that optimization resulted in 35 new alternatives in the first year. The capital cost for implementing these alternatives is $1.36 million leaving surplus of $240,000. The O&M cost is zero, as these costs are incurred one year after the alternative is implemented. The optimum benefit for the first year is computed as $2.86 million. In the second year, optimization resulted in An alternative installed for the first year remains effective for the remainder of its service life.
999
Sabyasachee Mishra / Procedia - Social and Behavioral Sciences 104 (2013) 992 – 1001
the selection of 28 new alternatives with a capital cost of $1.69 million and benefit of $7.05 million. The effect of carry-over alternatives from the previous year is also included in the estimation of the benefits derived. Similar allocations are made for five years. The benefit for the first year resulting from a single year analysis is $2.98 million (Table 3), while the first year benefit from a multi-year analysis is $2.86 million (Table 4). The difference in the benefit is simply a reflection of the fact that the model allocates resources over the five-year period optimally resulting in a greater a flexibility of investment from year to year. An analysis of one year at a time, on the other hand, is blind to availability of future funds, and may not necessarily result in maximization of total benefit over the five-year period. Also for the first year the planning period model resulted in a surplus of $240,000 while in a one year analysis total budget was consumed. Table 5 also shows that a total of 133 new alternatives are selected in the five year planning period for case (a). The total benefit achieved is worth $30.63 million at an expense of $7.73 million of capital cost and $583,500 of O&M cost, leaving a surplus of $10, 500. While the model maximizes total benefit over the five-year period, it does not guarantee that all the locations will receive at least one alternative during the planning cycle, as this condition was not explicitly incorporated in the model formulation. A second scenario to represent relative urgency for locations having higher severe crashes is analyzed. Higher priorities are assigned to locations with crashes of higher severity. Relative urgency of a location can be expressed by means of a relative score (expression 13), which consists of weighting factors for fatal and injury crashes (expression 12). The of a location can be determined as; relative score ( (13) Where, (14) is estimated as the mean of relative scores of all the locations in year n, i.e.
A threshold value of the relative urgency
. A binary variable is defined based on the threshold value
for each location to incorporate its relative urgency,
which is defined as follows (expression 15): (15)
Table 4. Summary of Allocation for a Five Year Planning Period Model
Number of Alternatives Allocated
Relative Urgency Scenario
Base Case
Year
Benefit ($)
Allocated ($)
O&M Cost ($)
Budget ($)
Surplus ($)
Cumulative ($)
I
II
III
IV
V
Total
1
19
8
5
3
0
35
2,864,987
$1,360,000
0
1,600,000
240,000
240,000
2
8
7
8
2
3
28
7,052,356
1,695,000
136,000
1,600,000
- 231,000
9,000
3
4
7
5
3
2
21
7,441,855
1,325,000
123,500
1,680,000
231,500
240,500
4
6
5
5
6
3
25
6,325,140
1,745,000
159,000
1,680,000
- 224,000
16,500
5
5
5
6
7
1
24
6,947,227
1,605,000
165,000
1,764,000
- 6,000
10,500
Total
42
32
29
21
9
133
30,631,565
7,730,000
583,500
8,324,000
10,500
1
1
1
2
3
0
7
$1,186,829
$515,000
$0
$1,600,000
$1,085,000
$1,085,000
2
7
2
3
6
5
23
$5,538,559
$1,800,000
$51,500
$1,600,000
-$251,500
$833,500
3
5
3
6
2
3
19
$7,664,491
$1,335,000
$91,000
$1,680,000
$254,000
$1,087,500
4
2
4
6
6
3
21
$6,367,482
$1,710,000
$189,000
$1,680,000
-$219,000
$868,500 $1,089,500
5
4
1
6
1
4
16
$6,995,142
$1,295,000
$248,000
$1,764,000
$221,000
Total
19
11
23
18
15
86
$27,752,503
$6,655,000
$579,500
$8,324,000
$1,089,500
1000
Sabyasachee Mishra / Procedia - Social and Behavioral Sciences 104 (2013) 992 – 1001
Table 4 shows that the total benefit achieved for case (b) is worth $27.75 million at an expense of $6.65 million of capital cost and $579,500 of O&M cost, leaving a surplus of $1.089 million. The total benefit received is higher for the case (a) ($30.63 million), when compared to case (b) ($27.75), as the addition of the relative urgency clause has the effect of further constraining the solution space. The relative urgency case states that hazardous location with severe crashes to receive priority funding than others. Difference in the base case and relative urgency case suggests that with addition of one more constraint the objective function, benefit is reduced. Also remaining surplus is higher. In addition to base case, relative urgency provides the decision maker one more policy option to explore allocation process when crash severity is one of the criteria to consider.
6. Conclusion A synchronized model using crash prediction and resource allocation is presented in this paper. The crash prediction model uses a negative binomial model to predict number of crashes at intersection level for the future and the resource allocation model uses branch and integer programing (bound algorithm) to optimize the savings resulted from savings in number of crashes in a planning period of five years. The problem analyzed as given a large number of independent locations (intersections) and a set of mutually exclusive alternatives at each location, the model allocates resources for implementing safety improvement alternatives at different locations in a manner that maximizes benefit by way of crashes saved every year in a multi-year planning period. The model is presented in two parts: (1) a Base case that includes the optimization function and a set of mandatory constraints (budgetary and other), and (2) a relative urgency policy constraints that can be incorporated into the Base case. The resource allocation model is considered robust in its formulation; and it attempts to maximize total benefit resulting from safety improvement alternatives, within a set of mandatory constraints satisfying budgetary and mathematical requirements. The multi-year feature allows the user to effectively utilize the year-end savings in subsequent years, thereby deriving the most benefit from the available resources. The incorporation of policy constraints/special features provides the analyst the flexibility of adding selectively, and urgency to the resource allocation problem. The case study shows that these features, when added to the Base case, result in significant changes in the allocation of resources. The contribution of the research is twofold. First development of a synchronized model that simultaneously selects mutually exclusive alternatives in the optimization process satisfying the budgetary and other constraints; and predicting number of crashes for future so that benefits gained in savings of crashes in a planning period. Second, the policy constraint application allows not only to analyze one base case but to explore options when the policies change such as relative urgency. The proposed approach is applied to selected signalized intersections in the Southeast region, Michigan, USA. Additional research should be conducted to examine constraints of budgets for every year, and equitable allocation of alternatives to variety of counties.
Acknowledgement The author acknowledges South Eastern Michigan Council of Governments (SEMCOG) for providing the data for this research. The errors and findings of the paper are solely attributed to the author.
References Bierman, H., Bonini, C. P., and Hausman, W. H. (1997). Quantitative Analysis for Business Decisions. Richard Irwin, Inc., Homewood, Illinois. Cook, W. D., Kazakov, A., and Persau The Journal of Operations Research Society, Vol. 52(3), pp. 303-309. Identifying Sites with High Proportion of Transportation Research Record: Journal of Transportation Research Board, No. 2019, Transportation Research Board of National Academics, Washington D.C. , pp. 65-73. Deacon, J. A., Zeg Transportation Research Record: Journal of Transportation Research Board, No. 543, Transportation Research Board of National Academics, Washington D.C. , pp. 16-33. -81-218,Prepared by Goodell-Grivas Inc., for Federal Highway Administration . ort# FHWA-SA-07-015. g, Transportation Research Record: Journal of Transportation Research Board, No. Restoration, or Rehabilitation 1840, Transportation Research Board of National Academics, Washington D.C., pp. 148-157.
Sabyasachee Mishra / Procedia - Social and Behavioral Sciences 104 (2013) 992 – 1001
1001
Transportation Research Record: Journal of Transportation Research Board, No. 1542, Transportation Research Board of National Academics, Washington D.C. , pp. 54-60. Hillier, F. S., and Libermann, G. J. (2005). Introduction to Operations Research. McGraw-Hill Science, New York. Hossain, M. and Muromachi, Y. (2012). -time crash prediction on the basic freeway segments Vol. 45(3), pp. 375-381. Michigan Department of Transportation. ccident Analysis and Prevention, Vol.35,1, pp. 47-57. Transportation Research Part A: Policy and Practice, vol. 44(6), pp.418-432. Optimization Model for Allocating Resources for Highway Safety Improvement at Urban Intersections, in Journal of Transportation Engineering, American Society of Civil Engineers (ASCE), vol.138(5), pp. 535-547. Melachrinoudis, E., and Kozanidis, G. (2002). improvements Transportation Research Part A: Policy and Practice, 36, pp. 789-803. Transportation Research Record: Journal of Transportation Research Board, No. 1897, Transportation Research Board of National Academics, Washington D.C., pp. 64-70. Washington, S., Karlaftis, M. G., and Mannering, F. L. (2011). Statistical and econometric methods for transportation data analysis. CRC Press, Taylor & Francis Group, A Chapman Hall Book, Second Edition, Boca Raton, FL, USA.