Philips Research Laboratories Eindhoven. Prof. Holstlaan 4, 5656 .... parameters, ú a development tool or a software artifact that needs to be ... ACM, Inc. To copy otherwise, to republish, to post on servers or to redistribute to ... is implemented as a network of dozens of relatively small UNIX tools. ..... nia, Berkeley, June 1999.
A System Simulation Framework Software environments for designing complex products P. van den Hamer, W.P.M. van der Linden, P. Bingley and N.W. Schellingerhout Philips Research Laboratories Eindhoven Prof. Holstlaan 4, 5656 AA Eindhoven, The Netherlands {Peter.van.den.Hamer, Wim.van.der.Linden, Peter.Bingley, Nico.Schellingerhout}@Philips.com
Abstract
A generic framework is described that supports the design and simulation of complex systems. The simulation framework incorporates a CAD Framework that has been extended with highlevel services for visualizing and exploring system performance. The simulation framework is used in a number of industrial environments for the development and optimization of VLSI designs, electro-optical systems, Cathode Ray Tubes, and a manufacturing process.
1. Introduction Computer simulations to evaluate and optimize product designs are becoming increasingly complex. This is only partly due to the growing complexity of the designs themselves. It also reflects a trend towards more integral design. Continuing optimization of products sooner or later calls for a more system-level view of the product. This encompasses the product’s internal behavior, the context in which the product operates, as well as the various performance criteria against which the product is judged. This paper describes several problems that occur in complex system simulations, the corresponding solutions, and the software services that we have investigated during the past five years. These software services are closely interrelated and form a System Simulation Framework. The technology is both configurable and generic. The configurability allows the framework to be efficiently tailored to a wide variety of design environments. The technology is generic in the sense that it has proven to be applicable in a wide range of development disciplines. The framework has been used within Philips in system-level design problems ranging from the optimization of microprocessor performance to the simulation of Cathode Ray Tube physics.
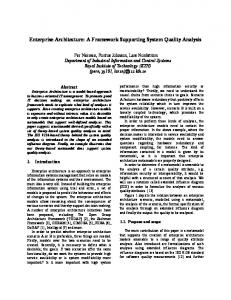
2. Overview of the framework In sections 2.1 to 2.5, we examine a series of problems associated with the simulation of complex systems. These form the requirements for our framework. We distinguish between requirements that benefit the designers using the framework (Designer Requirements in Fig. 1) and requirements related to the creation and maintenance of simulation environments using this technology. The latter are labeled Architectural Requirements because, although they only indirectly affect the designers, they have significant impact on the software architecture of the framework. In sections 2 and 3 we will respectively present and discuss the framework’s eight main Software Services and the overall Architectural Approach (see Fig. 1) used to help satisfy each of the
$UFKLWHFWXUDO�5HTXLUHPHQWV .HHSLQJ�WKH�VRIWZDUH FRPSOH[LW\�PDQDJHDEOH����� � FODULW\�RI�VWUXFWXUH PDLQW DLQDELOLW\ IOH[LELOLW\ UHXVH�RI�FRGH
$UFKLWHFWXUDO�$SSURDFK %XLOG�VLPXODWRU�DV�PXOWLSOH�WRROV 8VH�ILOH�H[FKDQJH�WR�OLQN�WRROV /HW�IUDPH ZRUN�PDQDJH�GDWD�IORZ 8VH�VHSDUDWH�HGLWLQJ�YLHZLQJ�WRROV 5HPRYH�JHQHULF�VHUYLFHV�IURP�WRROV
'HVLJQHU�5HTXLUHPHQWV
6RIWZDUH�6HUYLFHV
0DNLQJ�WKH�HQYLURQPHQW
6LPSOH� �XQLIRUP�WRRO�LQYRFDWLRQ
HDV\�WR�XVH�����
'HVLJQ�SURFHVV�YLVXDOL]DWLRQ
0DQDJLQJ�ODUJH�DPRXQWV�RI
$XWR�W RRO�LQYRFDWLRQ
GHVLJQ�LQIRUPDWLRQ�����
'HVLJQ�GDWD�PDQDJHPHQW
'HVLJQHUV�GRQ·W�OLNH
6XEVSDFH�DSS UR[LPDWLRQ�PRGHOV
WR�ZDLW�����
,QWHU DFWLYH�EHKDYLRU�H[SORUDWLRQ
9LVXDOL]LQJ�FRPSOH[�V\VWHP
'HVLJQ�RSW LPL]DWLRQ
EHKDYLRU �����
9LVXDOL]DWLRQ�RI�DOWHUQDWLYHV
�D
�E
Fig. 1. The framework’s main requirements (a) are shown linked to the Architectural Approaches and Software Services (b) used to satisfy these requirements. The requirements are discussed in the indicated section numbers. identified requirements. As Fig. 1 provides an overview of the framework’s goals (a) and the technical means (b) used to achieve these goals, the figure effectively summarizes this paper. Note that in sections 2.1 to 2.5, we will not only discuss how the framework helps solve the requirements in Fig. 1a, but will also examine the framework from a number of different perspectives. Some perspectives correspond to different modes in which the framework can be used: ú the simulator can run under manual control or be invoked automatically, ú the simulator can be treated as a black box or as a network of more detailed lower-level simulators, and ú the user can use the full simulation model or a much faster approximation generated by the framework. A user can thus switch back and forth between these modes, depending on the problem at hand. Other perspectives correspond to the way in which a user chooses to perceive the framework. A simulator can thus be regarded as: ú a mathematical model or a software implementation of that model, ú a tool that processes data files or a function that processes parameters, ú a development tool or a software artifact that needs to be created or maintained, and ú a tool used within a development process or a model of the entire development process. A person’s perception of the framework will depend on the problem at hand and can vary during the course of a project and can differ between people.
2.1 Keeping the software complexity manageable Permission to make digital/hardcopy of all or part of this work for personal or classroom use is granted without fee provided that copies are not made or distributed for profit or commercial advantage, the copyright notice, the title of the publication and its date appear, and notice is given that copying is by permission of ACM, Inc. To copy otherwise, to republish, to post on servers or to redistribute to lists, requires prior specific permission and/or a fee. DAC 2000, Los Angeles, California (c) 2000 ACM 1 -58113-188-7/00/0006..$5.00
This section discusses how to simulate complex systems without resorting to large, monolithic simulators. Large software programs are costly and risky to develop, can only be deployed in one step
software system. As illustrated below, various generic services are also extracted from the simulation modules and moved into the framework layer. This simplifies development of the modeling software and enables stepwise expansion and evolution of the submodel network. In section 3 we will discuss more implications of this architectural approach.
2.2 Making the simulation environment easy to use
Fig. 2. A system model is implemented and represented to the user as a configurable network of tools representing the data flow between the various submodels. The above screenshot shows a few of the modeled physical phenomena in a CRT. and are hard to adapt to changing requirements. The software architectural challenge is thus how to modularize the simulation software. To illustrate our approach, we take the Cathode Ray Tube Simulation Environment (TSE) as developed within Philips Research to analyze and optimize the quality of CRT designs (see Fig. 2). TSE incorporates a considerable number of dissimilar behavioral phenomena (e.g. magnetic fields, electron trajectories, phosphor luminescence), covers all key components in a CRT (electron source, deflection coils, shadow mask, and phosphor screen) and can predict a wide range of product performance indicators. TSE is implemented as a network of dozens of relatively small UNIX tools. Each tool does its calculations based on one or more input data files and generates one or more output data files. In the part of TSE shown in Fig. 2, image color impurity caused by thermal deformation of the shadow mask is modeled as a network of four interdependent submodels (rectangles) that transform design information (labeled in the balloons) applied via the data flow interconnects (lines). Submodel Thermal_Prop uses information describing the shadow mask’s slot geometry and material data to calculate the mask’s thermal properties. These properties are then used in the Thermal_Behavior submodel to calculate the mask’s temperature profile. Next, the temperature profile leads to a local deformation (“doming”) of the mask in Mech_Behavior, which finally results in a displacement of the electron beam (Spot_Displacement). A central characteristic of our architectural approach (see Fig. 1) is thus to decompose the simulator into a set of submodels that interact by exchanging data files1. Design entry tools and viewers are kept separate from the simulation modules. The framework manages the data flow graph that interconnects the tools. This approach, which is shown schematically in Fig. 3, helps ensure a high degree of structural clarity and modularity for the overall 'HVLJQ 6\VWHP�0RGHO
3DUDPHWHUV
3HUIRUPDQFH ,QGLFDWRUV
B
G�
B B
G�
6XEPRGHOV
2.3 Managing large amounts of design information
G�
S�
B
S�
G�
B
G�
Another problem with simulating complex systems is that the simulation environments can be difficult to operate. This is partly because flexible system simulators tend to require considerable amounts of information: the designer must be able to set any design parameter that can be adjusted. In the CRT example of Fig. 2, this includes a polynomial defining the shadow mask’s geometry, the position-dependent dot pitch, and material properties. In addition, such systems confront the user with vast quantities of intermediate and output data in which the user must somehow find the relevant information. As an example, a behavioral model of a modestly complex microprocessor that was optimized using this technology generated about 200 quantitative predictions ranging from statistics like pipeline stalls to the number of cycles needed to complete a suite of benchmarks. Finally, complex system models tend to consist of many interrelated calculation steps (see Figs. 2 and 3). Although these steps are less relevant for someone interested in the behavior of the entire system, these “internal” steps are quite meaningful to the designers: intermediate results help understand and improve the system’s design as well as help find implementation errors in the model itself. To give the designer overview in such an environment, we use a graphical user interface as depicted in Fig. 2. It is implemented using the design flow browser (dsui) of Delft University’s NELSIS2,3,4 CAD Framework. It visualizes the submodels and their network of data dependencies. Because each submodel is implemented as a UNIX tool, the user interface can also be regarded as a representation of the tool set available to the designer. Data sources located upstream in the data flow network generally correspond to editors for data entry. Downstream data sinks often correspond to viewers or visualization tools. Editors and viewers are also modeled as tools. The TSE environment contains 15 editors and 5 viewers as well as 24 computational modules. This high-level user interface based on the data flow paradigm thus serves various purposes: ú It is a map of the design process or tool environment showing the user the design steps that lead towards a particular goal. ú Tool status is represented via the use of colors (e.g., “running”, “has run”, “input data not available”). ú Clicking on a rectangle provides a uniform way of invoking tools on the selected input data. ú Model hierarchy: a set of submodels can be combined to form a higher level submodel. This visually simplifies the design flow and a series of tools to be automatically invoked with a single command. ú Design data traceability allows the designer to examine intermediate simulation results as well as associated input data.
S� S�
Fig. 3. A system model predicts a set of performance indicator values for a given set of design parameter values.
A practical problem involves having to keep track of the numerous input-, output- and intermediate data files in a complex simulation environment 5,6. Such an environment involves many different types of data files, many of which are derived from previous data files. As these files are regularly modified, designers need help in ensuring their mutual consistency and in avoiding the inadvertent use of outdated information. In software development, the make tool is used to solve this
(a) design process
(b) design data
'HVLJQ
6XE6SDFH�$SSUR[LPDWLRQ�0RGHO
3DUDPHWHUV
&UHDWH
B
6FKHPDWLF 6FKHPDWLFV
B
&UHDWH
6LPXODWH
�/D\RXW
6FKHPDWLF
&UHDWH SORW�ILOH
6LPXO��UHVXOWV
B
*HQHUDWH 0DVN�GDWD
,QGLFDWRUV
G� G� G�
/D\RXWV
G� G�
0DVN�GDWD
3ORW��ILOHV
Fig. 4. The (a) data flow model of a design environment also allows the framework to automatically (b) track design versions and provides data traceability problem. It selectively regenerates derived files based on their time stamps. During simulation, however, designers often compare series of alternative designs. Make is less suitable for this because it overwrites files whenever a new design is processed. One approach is to save copies of the previous file versions in a versioned file repository (e.g., a Software Configuration Management tool). This has drawbacks, because the SCM approach was not designed to be used on such an interactive time scale and because SCM tools do not record derivation information. We have chosen N ELSIS as a basis for developing our system simulation environments because it provides strong data management and flow support services. N ELSIS automatically versions all design data, records data derivation and design hierarchy relationships and provides various data browsers. Fig. 4 shows a key underlying data management principle 5,6: the sample flow graph in Fig. 4a models the design environment in terms of the data dependencies between tools. Fig. 4b shows the corresponding run-time information: the circles represent output data created by running a tool; the lines represent the derivation relationships as recorded by the framework. Note that this design data management approach integrates well with the architectural approach and design environment visualization service described above. It is also worth noting that this is, to our knowledge, the first industrial use of a flow-based design data management approach. Although this approach differs substantially from standard file management techniques as exemplified by SCM tools, the information recorded by the framework closely matches the concepts that designers use when asked to describe their design data.
2.4 Designers don’t like to wait Even the current dramatic rate of increase in computing performance is not enough to bridge the gap between the complex system that one would like to simulate and what is currently computationally feasible. Additional techniques to improve simulation speed are thus a welcome competitive advantage. A common approach to speeding up simulations is to use an approximation instead of the full model incorporating all factors that are expected to be relevant. The resulting faster design cycle times often outweigh the loss of accuracy – especially if the approximation has been tuned for the problem. Handcrafted approximations however also have their drawbacks. Firstly, their numerical errors are often hard to predict. Secondly, as the approximation is not generally applicable, a number of such models may be needed. This requires additional validation and maintenance effort. Our framework provides a software service that automates the generation of subspace approximation (SSA) models. Although the generation of an SSA typically involves evaluating the full
3HUIRUPDQFH
(YDOXDWLRQ 5HJUHVVLRQ G� G� G� S� S� S� S� � � � � � � � � � � � � � � � � � �� � � � � � � � � � � � � � � � � � � � � � � � � � � � �� �� � � � � � � �� � �
S� S� S� S�
Fig. 5. An SSA model is an efficient approximation of a system’s behavior within a restricted parameter subspace: some design parameters are kept at fixed values while others are adjustable within specified ranges. model several dozen times, the resulting SSA can be evaluated very efficiently. This technique differs from the creation of handcrafted approximations in several respects: ú The approximation is automatically derived from the full system model on demand. ú An SSA is generated and valid for a restricted parameter subspace rather than for the full design space. This greatly simplifies achieving sufficient accuracy. ú Because of the time needed to generate an SSA, the technique is most suitable for studying a series of similar designs because the SSA is then used multiple times. ú An SSA only captures the external, black box behavior of the system. It does not attempt to model why the system behaves the way it does. The system’s behavior can be regarded as functions that can be evaluated (see Fig. 5) to predict the system’s performance based on the values of the design parameters. Design parameters can represent external parameters (e.g., the ambient temperature) or adjustable parameters within the design itself (e.g., an amplifier’s gain). The latter usage allows designers to rapidly explore the behavior of alternative designs. To create an SSA, the designer must first indicate which design parameters should be varied (e.g., d1, d2 and d4 in Fig. 5) as well as their respective ranges. The designer also indicates how many times the full simulator will be run. Next, the framework generates a set of designs within this designated subspace that will be simulated by running the full simulator. The employed “design of experiments” algorithm tries to extract as much information about the subspace as possible given the limitation on the number of simulation runs. After these experiments are run, the resulting performance indicators are extracted and stored along with the corresponding design parameter settings (see table in Fig. 5). The CAD Framework is used to store the intermediate results for all experiments (e.g., for subsequent analysis). For simulators consisting of networks of submodels (as in Fig. 2), the automatic tool invocation service handles the sequencing of these tools. The SSA is subsequently generated by a regression algorithm. We use Friedman’s MARS 7 (Multivariate Adaptive Regression Splines) to model the observed transfer functions. Evaluation of the resulting model takes less than 1 millisecond per design on an engineering workstation. This enables the interactive exploration of complex system behavior.
2.5 Visualizing complex system behavior Once a model of the system behavior is available that can be evaluated rapidly, the designer can concentrate on the system itself rather than on the software tooling. The system itself can have complex behavior: it can have many input parameters, it is
Fig. 6. A service for evaluating parameterized designs allows users to interactively adjust design parameters (left) and study the effects (right). This example shows how modifying the parameters of a CPU design affects benchmark performance. often characterized by multiple performance indicators and the relationship between design parameters and performance indicators will generally be nonlinear and exhibit many surprising phenomena. The challenge is thus to visualize the multidimensional behavior of the system in an intuitive way. Fig. 6 shows the user interface of a framework service that allows the user to rapidly evaluate alternative designs and study a system’s behavior. A designer can modify design parameters by dragging the sliders on the left. Due to the speed of the SSA, the effects on the performance indicators (“vertical bars”) can be viewed immediately. A user can experiment with alternative designs or check which performance indicators are most sensitive to a particular change. This service also includes the ability (not shown) to display the system’s dependency on up to two design parameters and display this as a line graph or surface plot. Although the service shown in Fig. 6 is quite useful when one needs to explore the system’s behavior, it is less suited for searching the multi-dimensional design parameter space for good designs. The standard approach is to provide a design optimizer that automates the process of iteratively adjusting parameters in order to minimize a specified “cost function”. The classic problem with optimization algorithms is that a local, sub-optimal solution may be found due to inherent limitations of the search strategy. Optimizers can have another drawback because they need a well-defined criterion with which to compare alternative solutions. Although defining this cost function may be easy if there is only one performance indicator involved (“make me the fastest chip”), engineering reality involves making tradeoffs between conflicting goals whose relative importance are only roughly known (“make me the smallest, lowest power chip that runs the benchmarks faster than the competition”). These problems are addressed by a framework service that visualizes the achievable performance of a parameterized design. This service automatically visualizes the available tradeoffs while the actual design choice itself is taken by the expert user 8. Each cross in Fig. 7 represents an alternative design and is plotted along axes corresponding to two performance indicators. Because the performance is estimated using the SSA rather than the full simulator, thousands of alternative designs can be evaluated and displayed in a matter of seconds. These scatter plots can also be useful to visualize engineering trade-offs to management or to product managers. As illustrated in Fig. 7, the scatter plot shows the approximate boundaries of what can be achieved within the confines of the parameterized design and within the specified parameter ranges. This service can be used as a rough optimization technique. By scanning the entire design space (e.g., using a stochastic model),
Fig. 7. The framework supports automatic generation and evaluation of a large set of alternative designs. The resulting scatter plot shows the obtainable performance of the parameterized CPU of Fig. 6. Such diagrams visualize tradeoffs between multiple design goals. all major design solutions show up in the scatter plot. An optimizer would, in contrast, only provide some insight about the immediate vicinity of a single optimum.
3. Discussion In this section we will discuss the framework’s design. Section 3.1 discusses the implications of the framework’s architectural approach (see Fig. 1b) and section 3.2 discusses the degree of synergy between the software services.
3.1 Discussion of the Architectural Approach In this section, we explain why we think that our architectural approach helps alleviate various problems associated with managing CAD tooling environments and in maintaining the models embodied in software. This is especially critical in industries with numerous proprietary design tools. Having a clear tool strategy helps avoid functionality that is duplicated in multiple tools, reduces the risk of interoperability problems and increases clarity about migration paths. Because simulation tools need to be modified just to check the desirability of potential technology changes, development environments can even be more dynamic than the product technology itself. Our architectural approach is to decompose big simulation tools into relatively small modules representing well-defined submodels. These submodels should be adopted or sometimes even implemented by the submodel experts themselves. This is more likely to happen with a network of highly visible components that have simple interfaces, than with one big simulator to which many experts contributed, but in which the individual contributions are not easily identifiable at the implementation level. In other words, modularization along expertise boundaries can help bridge the traditional gap between the developers (who have know-how about the product technologies) and the IT professionals (who have expertise in developing complex software). The availability of a graphical representation of the data flow (see Figs. 2 and 3) further stimulates the architectural awareness from both a tool and a model perspective. It gives the various stakeholders a common, well-defined model with which to discuss module interoperability, to compare alternative models and to discuss problems and solutions. In fact, it may sometimes be better to encourage the incorporation of an existing submodel with known flaws than to debate what the ideal submodel would look like: the understanding derived from the use and sheer
visibility of any halfway decent model will often outweigh the risks associated with its limitations. The benefits of software modularization are widely accepted. We chose to use a file-based data flow mechanism to integrate the submodels. Compared to having a single big simulator, this rigorous form of modularization enhances clarity and flexibility. Compared to having a suite of small independent submodels, the framework can provide various extra services because it knows how the tools work together.
3.2 Synergy among the Software Services Especially when a framework has a broad range of services, the question comes to mind whether these services are more than just a haphazard collection of features. From a requirements perspective, the services attempt to solve a set of generic problems which are relevant in a wide range of system design environments. The synergy within the first four (file and tool oriented) services and the last four (parameter and model oriented) services in Fig. 1b should be relatively obvious. Examples of synergy between both sets are: ú SSA models are also data that need to be managed and related to the rest of the design data. ú It is convenient to be able to view available design versions in terms of design parameters and performance indicators rather than just file names and version numbers. ú When an interesting design point is found using the SSA model (see Fig. 7), the user will want to verify it using the full simulation model. Another way of looking at the internal synergy in the framework is to examine how a designer benefits from the combination of available ingredients. The following examples respectively illustrate benefits derived from the ability to switch modes on demand (see section 2) and from the ability to regard an environment from multiple perspectives: ú Our architecture uses a single definition of the design environment to provide a user interface for manually invoking tools (e.g., for debugging), to provide a user interface for browsing stored design versions and their derivation relationships, and to automatically invoke tools (e.g., for optimization). ú The data flow model plays a central role in the framework. It plays a different role for different kinds of users. To product experts the data flow graph is a mathematical model of product behavior, to software engineers it is a representation of the software architecture, to users it is a user interface, to an IT manager it is the map of how the various software tools fit together, and to a development manager it is an overview of the development process.
4. Comparison to other work As our system simulation framework is implemented on top of the NELSIS CAD Framework, some of the services (e.g. design data management and visualization of the design process in Fig. 2) correspond to features provided by N ELSIS and a few other CAD Frameworks9. Our framework provides an additional layer of services that allows the user to deal with simulations at the design level (parameters, system behavior and performance indicators) rather than at the file and design tool level. The High Level Architecture standard 10 (HLA), as developed for simulating real-time military missions, resembles our framework’s overall goals and structure: both architectures provide a backbone for integrating simulators resulting in enhanced interoperability and reuse of submodels and enhanced flexibility of the resulting “federation”. Because HLA aims at supporting concurrently running simulators, it includes services (the “Runtime Infrastructure”) for managing time and event notification. Despite architectural similarities, there is virtually no overlap in services
between HLA and our framework. In simulation backplanes like Ptolemy11, multiple heterogeneous subsystem models can be combined to simulate the overall system behavior. Unlike our framework, Ptolemy’s emphasis is on the interaction between concurrently running subsystems and on time management. Experience with integrating a proprietary cycle-level simulation backplane within our own framework suggests that both technologies are complementary. Workflow-management systems12 can also capture aspects of collaborative processes, but tend to focus on procedures, tasks and rules. Engineering workflow tools, in contrast, focus on providing a user interface for capturing a methodology and controlling tools (like Mentor’s WorkXpert13) or on providing a means of visualizing or assessing the process (see Rose 14). Mathematics or mathematical simulation packages like MatLab15 provide services for computation, visualization and optimization. Such integrated environments resemble languages or toolkits with which to develop mathematical applications. They are not open in the sense that they do not support the integration of networks of existing tools. Services for optimization and visualization are often embedded in special-purpose simulators (e.g. analog circuit simulators). As such tools grow, they typically spawn features for visualizing numeric output, for sweeping input parameters or for optimizing design performance. We chose to implement some of these features as framework services in order to enhance interoperability, improve user interface consistency, and reduce development effort. A more general approach has been taken in the iSIGHT optimization framework by Engineous 16. It features tight integration with Pro/ENGINEER, but can be applied to a wider range of engineering problems. It provides optimization and approximation services that are decoupled from the calculation models. The design environment can be extended via the farSIGHT visual programming language. Although similar to our work in various respects, iSIGHT does not include CAD Framework functionality like design versioning, focuses primarily on mechanical and geometric applications and seems to be less flexible with respect to the integration of additional tools. Finally, on the visualization side, Prof. Spence’s Information Engineering group at Imperial College London 17 has created several stand-alone tools that facilitate exploring and optimizing complex mathematical systems. These tools can be regarded as a more elaborate counterpart of the visualization services currently provided within our framework.
5. Characteristics and benefits In this paper we have given an overview of the functionality and rationale of our system simulation framework. Central characteristics of this approach are: ú The system model is partitioned into a network of tools that exchange files. ú The framework invokes and monitors tool runs and manages all design files. ú Additional services support visualizing and analyzing the behavior of a parameterized system. ú The entire framework is generic and application independent. This last item is reflected in the diversity of the industrial projects in which the technology has been applied. Published applications include the architectural optimization of VLSI processors 18,19, a design environment for CRT deflection units 20, and the simulation of a manufacturing process21. The framework’s benefits fall into three categories: 1. Designer benefits (see Fig. 1a). The framework helps designers deal with the complexity of large, heterogeneous designs and their
�
6FUHHQ6,0��
G H V � X � V H F L Y U
76(��
7. References
'8&$'��
3520037�� .LHQKXLV��
H � V � I R � U H E P � X 1
� �
�
��
��
�� �
1X PEHU �R I�WRROV�LQ�HQ YLU RQPHQ W
Fig. 8. Some design environments created with the system simulation framework. The small circles indicate the number of computational tools. The large circles indicate the total number of tools (including editors and viewers). associated design environments. Although user feedback on this technology is positive, this is difficult to quantify 22 because introduction of such technology often coincides with changes in tooling and methodology. Nevertheless, as shown in Fig. 8, working environments using this technology involving dozens of tools are in actual industrial use. 2. Architectural benefits (see Fig. 1a). This class of benefits pertains to the ability to create, document, modify and reuse simulation software. This is primarily due to the decomposition of complex simulation problems into a network of tools (e.g. submodel simulators). The framework ensures the integration of the tool suite into a cohesive environment. This approach effectively increases the number of tools (see Fig. 8) but decreases the complexity of the overall system due to the smaller tool size and the clarity of the environment. As an example of the resulting flexibility, the DUCAD20 environment (see Fig. 8) with its 36 tools is undergoing major modifications in order to accommodate new insights into product technology and design methodology. If the environment had been implemented as one large simulator, such a step would have been unthinkable only one year after completion of the current environment. 3. Process improvement benefits. This last class of benefits pertains to the improvement of design processes and methodologies. Our framework visualizes the steps and tools used in a design process (see also Rose 14). We believe that a clear visual representation of a design process will benefit the quality of the discussions on how the process should be. In the absence of a clear and accurate model of the existing development process, discussions about how to improve this process can easily be grossly ambiguous or even incorrect.
6. Conclusions The synergy among the software services and the focus on modularity in the architectural approach, has lead to a high degree of flexibility of our system simulation framework. The framework has proven to be applicable in a wide range of application areas. The resulting design environments are in fact more than a tool to help designers cope with design complexity: the explicit data flow description of the design environment also serves as a common ground in discussions about an organization’s process, goals and plans. This is especially relevant now that well-organized manufacturing processes are the norm and industries are discovering that the effectiveness of their design and decision making process will become decisive for competition in the coming years.
[1] Cycles in the dependency graph that correspond to tightly coupled submodels can give performance problems due to file transfer overhead. In cases were such cycles are unavoidable, they can be embedded inside a tool. [2] K.O. ten Bosch, P. van der Wolf, and P. Bingley, “A flow-based user interface for efficient execution of design cycles”, in Proc. ACM/IEEE Design Automation Conference ‘93, Santa Clara 1993 [3] P. van der Wolf, “CAD Frameworks”, 1994, Kluwer Academic Publishers, ISBN 0-7923-9501-8 [4] P. van der Wolf and T.G.R. van Leuken, “Object Type Oriented Data Modeling for VLSI Data Management”, in Proc. 25th ACM/IEEE Design Automation Conference, 1988 [5] P. van den Hamer and M.A. Treffers, “A Data Flow Based Architecture for CAD Frameworks”, in Proc. 8th IEEE/ACM Int. Conf. on CAD, 1990 [6] P. van den Hamer and K. Lepoeter, “Managing Design Data: The 5 Dimensions of CAD Frameworks, Configuration Management, and Product Data Management”, in Proc. of the IEEE, Vol. 84, Jan. 1996 [7] J.H. Friedman, “Multivariate Adaptive Regression Splines”, in Annals of Statistics, 19,1991 [8] The designer may even select multiple solutions within the design space to cover different market segments. [9] S. Kleinfeldt, M. Guiney, J. Miller and M. Barnes, "Design Methodology Management", in Proc. of the IEEE, Vol. 82, no. 2, 1994 [10] J.S. Dahmann, J.O. Calvin and R.M. Weatherly, “A Reusable Architecture for Simulations”, in Comm. of the ACM, Vol. 42, no. 9, 1999 [11] J. Davis II et al., “Overview of the Ptolemy Project”, ERL Technical Report UCB/ERL No. M99/37, University of California, Berkeley, June 1999 [12] S.K. Shrivastava and S.M. Wheater, “Workflow-management systems”, in special issue of IEEE Concurrency on workflow, July-Sep. 1999 [13] WorkXpert by Mentor Graphics, http://www.mentorg.com [14] T. Rose, “Visual Assessment of Engineering Processes in Virtual Enterprises”, in Comm. of the ACM, Vol. 41, No 12, 1998 [15] MatLab by MathWorks, http://www.mathworks.com [16] ISIGHT, by Engineous Software, http://www.engineous.com [17] L.A. Tweedie, R. Spence, H. Dawkes and H. Su, "Externalising Abstract Mathematical Models", CHI '96, Vancouver, ACM Press [18] G. Hekstra, G. La Hei, P. Bingley, F. Sijstermans, “TriMedia CPU64 Design Space Exploration”, in Proc. of the IEEE Int. Conf. on Computer Design (ICCD ’99), Austin USA [19] B. Kienhuis, “Design Space Exploration of Stream-based Dataflow Architectures”, Ph.D. thesis, Techn. Univ. of Delft, ISBN 90-5326-029-3, Jan. 1999 [20] R. Mulder, P. Bingley, T.G. Beelen, and J. Penninga, "DUCADNew: A CAD-tool for designing and simulating deflection units", in Proc. of 12th Euro. Simulation Multiconference 1998 (ESM98), Manchester, UK, ISBN 1-56555-148-6 [21] G. Schouten, W. van der Linden, and P. Bingley, “Simulation environment for finding optimal design solutions - An illustration with ScreenPress”, Proc. of NAFEMS 97, Stuttgart, Germany, p. 1143-1154 [22] In one case we have evidence that certain users would have rejected a new simulation environment if our framework had not been available. [23] The Cathode Ray Tube Simulation Environment is described in Section 2.1 of this document.