RESEARCH ARTICLE
A systematic approach to parameter selection for CAD-virtual reality data translation using response surface methodology and MOGA-II Mustufa Haider Abidi1,2*, Abdulrahman Al-Ahmari1,2☯, Ali Ahmad3☯
a1111111111 a1111111111 a1111111111 a1111111111 a1111111111
1 Princess Fatima Alnijiris’s Research Chair for Advanced Manufacturing Technology (FARCAMT Chair), Advanced Manufacturing Institute, King Saud University, Riyadh, Saudi Arabia, 2 Industrial Engineering Department, College of Engineering, King Saud University, Riyadh, Saudi Arabia, 3 Louisiana Community and Technical College System-Manufacturing Extension Partnership, Baton Rouge, LA, United States of America ☯ These authors contributed equally to this work. *
[email protected]
Abstract OPEN ACCESS Citation: Abidi MH, Al-Ahmari A, Ahmad A (2018) A systematic approach to parameter selection for CAD-virtual reality data translation using response surface methodology and MOGA-II. PLoS ONE 13 (5): e0197673. https://doi.org/10.1371/journal. pone.0197673 Editor: Rashid Mehmood, King Abdulaziz University, SAUDI ARABIA Received: April 19, 2017 Accepted: May 7, 2018 Published: May 23, 2018 Copyright: © 2018 Abidi et al. This is an open access article distributed under the terms of the Creative Commons Attribution License, which permits unrestricted use, distribution, and reproduction in any medium, provided the original author and source are credited. Data Availability Statement: All relevant data are within the paper. For data files please follow the following link: https://figshare.com/articles/PLOS_ ONE-CAD-VR_Data/5197879. Funding: The authors are grateful to the Deanship of Scientific Research, King Saud University, for funding through Vice Deanship of Scientific Research Chairs. Competing interests: The authors have declared that no competing interests exist.
Advanced graphics capabilities have enabled the use of virtual reality as an efficient design technique. The integration of virtual reality in the design phase still faces impediment because of issues linked to the integration of CAD and virtual reality software. A set of empirical tests using the selected conversion parameters was found to yield properly represented virtual reality models. The reduced model yields an R-sq (pred) value of 72.71% and an Rsq (adjusted) value of 86.64%, indicating that 86.64% of the response variability can be explained by the model. The R-sq (pred) is 67.45%, which is not very high, indicating that the model should be further reduced by eliminating insignificant terms. The reduced model yields an R-sq (pred) value of 73.32% and an R-sq (adjusted) value of 79.49%, indicating that 79.49% of the response variability can be explained by the model. Using the optimization software MODE Frontier (Optimization, MOGA-II, 2014), four types of response surfaces for the three considered response variables were tested for the data of DOE. The parameter values obtained using the proposed experimental design methodology result in better graphics quality, and other necessary design attributes.
Introduction Virtual reality (VR) integrates powerful digital computers, with special software and hardware to establish a digital environment. The aim of VR is to create reality that is persuasive as real and interactive to the user [1]. VR technologies have been implemented in the product design process in various industrial sectors, including automotive, aerospace, defense, and bio-engineering [2, 3]. For industries involving intricate products, it is critical not only to design the geometrical shapes of the product parts using computer-aided design (CAD) packages, but also to assess the interior and exterior characteristics prior to building the first prototype. With the aid of advanced visualization systems, VR offers a platform for the design review process.
PLOS ONE | https://doi.org/10.1371/journal.pone.0197673 May 23, 2018
1 / 19
CAD-VR data translation using statistical approach
Immersive visualization using tools such as; a large display and stereoscopic vision, or a headmounted display (HMD) can enhance the users’ understanding of innovative products. In the field of automotive, for example, VR has been used to visualize digital mock-ups of new cars at a real-life scale [4]. Compared with CAD software, current VR systems offer remarkable capabilities that can augment the visualization of 3D design models. Graphical tools are an integral part of the design process, and 92% of communications are graphically based on VR systems [5]. Hence, design and the decision making process can be enhanced by using the effective graphics conveyance tools such as, VR [6, 7]. By virtue of novel navigation techniques, the design engineer is able to design and interact with a virtual model in a more instinctive and competent way. VR-based systems have enabled significant achievements in the manufacturing field. They have been implemented in many manufacturing domains, particularly in the areas of product design, assembly, and maintenance [8]. One of the obstacles to use VR in the design process is the problem of integration between CAD tool kits, and VR-based systems. In contrast to CAD software, which is desktop-based, VR systems use HMDs and high-resolution 3D displays, which yield a far superior spatial understanding of the models. The primary cause of data translation problems is, the different internal mathematical schemes used to represent objects that arise from the accuracy norms used to estimate curvatures, trajectories, and facets. To run practical VR simulations (such as those for visualization and collision detection), rational CAD models must be transformed into tessellated ones [9]. A major challenge faced by VR practitioners is the integration of the various hardware and software components, associated with VR systems. The CAD to VR data translation process involves the conversion of Non-uniform Rational B-Spline (NURBS) surfaces from the CAD model to the model of polygonal for use in VR. Hence, a tessellation procedure is needed to transform the NURBS surfaces into triangular ones. The parameters implicated in the triangulation process affect the polygonal model results. Such a triangulation process can be realized, using various techniques based on different approaches and algorithms. A CAD model can be transformed into VR either directly or through a third-party rendering package. In general, there are three distinct classes of methods for CAD-VR data conversion: library-based methods, database methods, and straightforward translation methods [9]. This mitigates the time spent on repetitive tasks, but requires an immense initial effort to create the library. In a database approach, a central database is used by both the CAD software and the virtual environment to retrieve a part of information. Finally, straight-forward conversion processes are popular methods for transforming CAD data into VR. In such a process, an entire CAD model is transformed into VR either directly or through some intermediary tool, which necessitates a certain exchange interface. This can be accomplished by exporting CAD data in neutral formats such as the Initial Graphics Exchange Specification (IGES), the Standard for the Exchange of Product Model Data (STEP), or extensible Mark-up Language (XML), or by converting the data into a VRcompatible format using intermediate converters or adapters. To convert complex CAD data, standard graphical data exchange formats are used, such as STEP, IGES, and XML [9]. The lack of interoperability between Virtual reality (VR) and CAD systems is particularly due to the problem of efficiently importing the data of CAD into VR simulation. It helps in minimizing the loss of information. The different internal mathematics representation schemes are the major problem of translating the data from CAD system to VR reality. The problem of accuracy criteria arises due to differences in performing calculation, curves, and surfaces. In order to perform real-time VR simulation, the CAD models must be converted into tessellated ones. Moreover, once the conversion of files is completed, all the information
PLOS ONE | https://doi.org/10.1371/journal.pone.0197673 May 23, 2018
2 / 19
CAD-VR data translation using statistical approach
and results will be lost that are specifically related to the reciprocal conversion, and physical characteristics of the model [9]. In the data translation process from CAD model to VR, several problems have been detected regarding the models visualization. Geometry and precision are the common losses in the process of data translation. Moreover, the model of CAD includes, some project information that is linked to each object. During the translation of CAD to VR, the system lost this information that is linked with the object [9]. The representation of shape and interoperability of product models have been presented by Lee [10]. This model focused on the distribution of virtual prototyping, and used to transfer and share product models [10]. Other formats have also been used to convert information from CAD models into VR systems, such as OpenFlight, the Drawing Exchange Format (DXF), and 3D Studio (3DS) format. Weyrich and Drew described a method called a “virtual workbench” for virtual assembly. The system used the Multigen Creator commercial tool of modelling [11]. Bourdot et al. [12] introduced an approach for combining VR with CAD, in which they instituted a VR-CAD framework with multimodal immersive interaction. Tang and Gu developed a novel approach for transforming CAD data into a native VR format, using a reduction algorithm [13]. Yap et al. presented a generic approach of converting CAD data for virtual manufacturing using Open GL and the lexical analyzer generator Lex. Their system can successfully convert data between four file formats: stereo lithography (STL), VRML, XML, and object [14]. Lorenz et al. [15], presented a CAD and VR system self-determining workflow for an automated CAD model complexity reduction, and furthermore the developed methodology preservs the animation and kinematic mechanism. The Design of Experiment (DOE) is as statistical technique that is used for the optimization of systems’ performance with known input variables. DOE is a systematic method that is used for the identification of a relationship between the factors that affect the outcomes of that process. In the context of product design, DOE is used for determining the optimal parameters which are helpful in the translation of data from CAD to VR model. The two major parameters that are used for data translation are Tolerance and chord length; however, DOE is a major tool used for the selection of optimized parameter during the translation process [14]. Tolerance indicates the maximum time, by which tessellation is permitted to lose from the systematic surface (deviation or error). The maximum distance between the tessellated surface and original design is known as Chord length or chordal tolerance [14]. The majority of research on CAD-to-VR data conversion has been conducted, using the data translation interface technique. Translation interfaces are provided by several commercial software suites (such as Deep Exploration and Product View) and CAD systems (CATIA, Pro/E, etc.). Previous literature indicates that there is a lack of interoperability between CAD and VR, because of the inefficiency of importing CAD data into VR simulations with minimal information loss. Many studies as mentioned above have addressed the data translation issue of CAD and VR systems, but most have focused on the loss of attribute information. Less attention has been paid to the loss of geometric information, which also plays an imperative role in the development of a realistic virtual environment. The objective of the study is based on the appropriate selection of parameters for the translation of data from CAD to VR model. Previous research papers [3, 9, 12] have focused on the problems of integration between CAD-VR data translation, but this study is merely focused on the development of a systematic experimental design methodology to select the parameters to be used in the CAD-VR data translation.
PLOS ONE | https://doi.org/10.1371/journal.pone.0197673 May 23, 2018
3 / 19
CAD-VR data translation using statistical approach
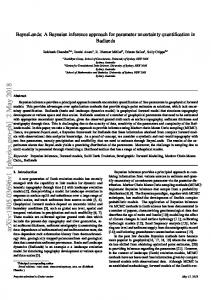
Materials and methods The Design of Experiments (DOE) technique was applied in this study, to determine the appropriate parameters to be used in translation procedure. Fig 1 shows a block diagram of the steps of the implemented procedure. It represents the methodology for the selection of parameters for the translation process. This flow chart is comprised on five steps. In the first step, it is needed to select an appropriate gearbox assembly for the experiment. After selecting the gearbox, the straight-forward translation approach is used to import the data in to translate VR Model, in the division Mock-up. The translation parameters defined in Fig 1 are Tolerance, Chord Length, and LOD detail. The imported data is then transferred for measuring the responses of variables. A complete statistical analysis has been undertaken by using the response surface strategy (RSM) [16]. The selection of parameter is significantly affecting the output responses; therefore, the best selected technique for optimizing the parameter is, DOE technique. There are seven basic steps involved in implying the DOE technique to any experiment or process. The steps are as follows: problem recognition, selection of factors, setting ranges and levels, selection of response variables, selection of experimental design, assessing the experiment performance, analysis of data, and conclusions and recommendations [16]. The steps of DOE are highly interdependent on each other. If wrong problem is recognized in the first step, then the whole process of DOE fails to develop the desired results. Therefore, it is necessary to clearly undertake each step to select appropriate parameters for the conversion process. In step two, the selection of factors and their levels are important for identifying the characteristics of performance of any process or product. The third step is interrelated with the second step because it is based on the selection of responses of the desired variables. It is also helpful in assessing the process performance. In fourth step, full analysis and factorial design has been selected. The measurement of the selected design and statistical analysis of the result has been identified in the fifth and sixth step. The last step is based on the conclusion and recommendation of the whole process. These steps were useful for the CAD-VR data translation procedure [16].
Fig 1. a) Methodology for the selection of translation parameters b) Gearbox assembly model from CAD c) Converted VR model with translation problems. https://doi.org/10.1371/journal.pone.0197673.g001
PLOS ONE | https://doi.org/10.1371/journal.pone.0197673 May 23, 2018
4 / 19
CAD-VR data translation using statistical approach
Problem recognition A gearbox assembly model for CAD was chosen as the subject of the experiments. This assembly is appropriate for this purpose because the components of a gearbox include various geometric characteristics, such as; rectangular, circular, and freeform shapes. Fig 1 also shows the gearbox assembly model for CAD. Straightforward translation approach was used to transfer the CAD data into the VR format. Product View adapters were selected as the middle interface for the conversion of the CAD model from the PTC Pro-e format to the PTC Division Mockup 2000i2 format. Many parameters are associated with Product View adapters, and these parameters must be properly selected to ensure high-quality results. An inappropriate selection of conversion parameters can lead to problems in the transformed VR model; for example, the model circular edges may not appear smooth, or the overall geometry may appear imprecise. Fig 1 further illustrates some of the problems that can arise in an improperly converted VR model [17].
Selections of levels, factors, and ranges The performance characteristics of any product or process can be evaluated by selecting the appropriate parameters, and their levels and ranges. Therefore, it is essential to properly select the experiments’ factors and levels. This requires a careful study of the system. In order to identify the important factors, different preliminary experiments were performed. Based on the results of these experiments, three parameters were identified, as summarized in Table 1. Tolerance. Tolerance indicates the maximum time by which tessellation is permit to lose from the systematic surface (deviation or error). Chord length. The maximum distance between the tessellated surface and original design is known as, Chord length or chordal tolerance. Number of Levels of Detail (LODs). The LOD concept invokes the idea that when the spectator is distant from the object, not all details in the file must be shown or drawn. Selection of response variables. The correct response variable(s) selection for testing is crucial because, the performance of the process is assessed through these variables. The selected response variables for the CAD-VR translation process are specified in Table 2. Graphics quality. The graphics quality represents the quality of the output model in the environment of VR, i.e., how good it looks, and is considered to be the most imperative response. All the graphics quality are rated on the basis of how clear and sharp image it present in the environment of VR. The quality of very good, shows that there is a very sharp image and graphics present in the output model of VR; whereas, the poor quality represent the poor image effects of the output of VR model. Graphics quality is also rated on the basis of final representation of the VR models. Textures, illumination and reflection models have also been considered before ranking the quality of graphics. This is a subjective measure, and it is determined by averaging the responses of ten users based on their experience and then rounding off the resulting value. File size. The file size is the space in the memory of computer, in units of KB, required by the converted model. A relatively moderate model was selected for this case study, a file size in Table 1. Values and levels of the most important parameters. Factors
Number of Levels
Values
2
0.01 and 0.03
Chord Length (millimeters)
2
0.1 and 0.5
Number of Levels of Detail (LODs)
2
3 and 7
Tolerance (millimeters)
https://doi.org/10.1371/journal.pone.0197673.t001
PLOS ONE | https://doi.org/10.1371/journal.pone.0197673 May 23, 2018
5 / 19
CAD-VR data translation using statistical approach
Table 2. Selection of response variables for CAD-VR translation. Response
Unit
Graphics Quality
Very Good (3), Good (2) and Poor (1)
File Size
Kilobytes (KB)
Rendering Time
Seconds
Number of Triangles
Number
https://doi.org/10.1371/journal.pone.0197673.t002
KB is adequate. The model size MB can also be used in other different experiments; such as, a complete car, units of megabytes (MB) would be appropriate. Rendering time. The time required by the computer to render the complete model in the VR environment. The whole experiment has been conducted by using the same computer and with the same load condition. Number of triangles. The total number of triangles contained in the transformed model of polygonal.
Choice of experimental design and analysis Response surface methodology (RSM) was selected as the design of experiment technique to be used in this study. The optimal values of the translation parameters were numerically determined using the RSM quadratic model. To save time and effort, it is desirable to reduce the number of periods without affecting the desired objectives. The analysis of model and problem can be helpful through RSM, which is a statistical technique used to influence the certain variables and objectives in order to optimize the responses [16]. To achieve this purpose, strategies such as central composite design (CCD) in RSM are frequently used [18]. The total number of runs for this study was calculated as follows: 8 cube points, 6 center points in each cube, and 6 axial points. The face-cantered design was selected; therefore, α = 1.
Apparatus The gearbox assembly model of CAD was used to perform the experiment. The following are the specifications that computer had to perform: an Intel Core 2 Quad Q9400 @ 2.66 GHz processor with 4 GB of RAM and an NVIDIA GeForce 9800GT graphics card with 1 GB of memory.
Procedure The Division Mockup 2000i2 software tool was used to measure the variable responses. Table 3 summarizes the RSM CCD for the selected factors [19].
Results and discussion Response surface methodology To evaluate the influence of the preferred factors on the responses, RSM analysis was performed using the Minitab 17 software package. Based on RSM, the central composite rotatable second-order design was used to conduct the experiment. The mathematical relationship between the response (Zj) and the various translation parameters were established through the response surface modelling, with the aim of identifying the optimal settings for data translation [20]. The influence of parameter on various response criteria was analyzed by using general second-order polynomial response surface mathematical model, the various response criteria
PLOS ONE | https://doi.org/10.1371/journal.pone.0197673 May 23, 2018
6 / 19
CAD-VR data translation using statistical approach
Table 3. RSM CCD table. Factors
Responses
Run Order
Tolerance
Chord Length
Number of LODs
No. of Triangles
File Size (KB)
Rendering Time (sec)
1
0.01
0.1
3
96158
1540
0.4
Graphics Quality 3
2
0.03
0.1
3
83804
1340
0.36
2
3
0.01
0.5
3
74708
887
0.3
1
4
0.03
0.5
3
68646
801
0.22
1
5
0.01
0.1
7
95142
1527
0.37
3
6
0.03
0.1
7
82876
1323
0.33
2
7
0.01
0.5
7
74235
872
0.25
1
8
0.03
0.5
7
67983
793
0.21
1
9
0.01
0.3
5
92567
1453
0.35
2
10
0.03
0.3
5
72345
835
0.28
1
11
0.02
0.1
5
87658
1400
0.37
3
12
0.02
0.5
5
69752
829
0.26
1
13
0.02
0.3
3
72638
866
0.28
2
14
0.02
0.3
7
71865
847
0.24
1
15
0.02
0.3
5
72273
852
0.26
1
16
0.02
0.3
5
72273
852
0.26
1
17
0.02
0.3
5
72273
852
0.26
1
18
0.02
0.3
5
72273
852
0.26
1
19
0.02
0.3
5
72273
852
0.26
1
20
0.02
0.3
5
72273
852
0.26
1
https://doi.org/10.1371/journal.pone.0197673.t003
are as follows [16]: Zj ¼ b0 þ
Pk i¼1
bi xij þ
Pk i¼1
bii xij2 þ
P i