Duro has a PhD in Sciences from. UNED. R. Dormido is an associate professor in the Department of Computer. Sciences and Automatic Control at UNED.
Intelligent Automation and Soft Computing, Vol. 14, No. 4, pp. 505-524, 2008 Copyright © 2008, TSI® Press Printed in the USA. All rights reserved
A SYSTEMATIC TWO-LAYER APPROACH TO DEVELOP WEBBASED EXPERIMENTATION ENVIRONMENTS FOR CONTROL ENGINEERING EDUCATION H. VARGAS, J. SÁNCHEZ, N. DURO, R. DORMIDO, S. DORMIDO-CANTO, G. FARIAS, S. DORMIDO Dept. of Computer Science and Automatic Control UNED, C/. Juan del Rosal 16 28040 Madrid, Spain
F. ESQUEMBRE University of Murcia Campus Universitario de Espinardo 30100 Murcia, Spain
CH. SALZMANN, D. GILLET Laboratoire d'Automatique EPFL, CH-1015 Lausanne, Switzerland
ABSTRACT—This paper introduces the systematic approach currently used by the Department of Computer Science and Automatic Control of the Spanish University of Distance Learning (UNED) to develop Web-based laboratories for distance learning of topics with high technical contents such as control engineering. This approach differentiates two layers in the construction of web-based laboratories: the experimentation layer and the e-learning layer. For the experimentation layer, LabVIEW and data acquisition boards from National Instruments are used to create the server-side applications and Easy Java Simulations for the client-side interfaces. For the e-learning layer, the eMersion environment is used to support the required flexible educational scheme. This paper describes the programming techniques implemented and the design considerations that justify these particular choices. As an illustrative case-study, an example of development of a web-based application is discussed, in which an electrical drive servo-motor is introduced as a convenient setup to practice with motion control applications. Other significant examples of web-based experiments developed by the authors are also reported. Key Words: Remote laboratory, distance learning, control engineering education, interactive systems, web-based experimentation, collaborative learning.
1. INTRODUCTION New technological advances in communication networks are steadily introduced to improve the quality of service and the available bandwidth of Internet to accommodate the increasing world-wide demand of resources. The availability and capabilities of these new communication
505
506
Intelligent Automation and Soft Computing
facilities, the fast development of web technologies, and the employment of off-the-self components for data acquisition and control of industrial processes, now enable students to avoid the attendance to traditional laboratories in some technical courses. Students are encouraged to use tele-presence systems, transforming remote experimentation from a subject of research into a reality accessible to everybody [1]. Control engineering is one of the technical areas in which the impact of new technologies to develop novel approaches for distance learning is most noticeable [2]. A great number of research groups, universities, and academic institutions all over the world are currently implementing virtual and remote control laboratories with one objective in common: to enhance traditional teaching and learning processes by taking advantage of modern technologies [3]. Unfortunately, these developments are often isolated efforts of independent groups that use different programming techniques, different software tools, and different hardware facilities. Based on these premises, to establish a common methodology, procedure, or approach to describe, implement, and interconnect each of the parts that compose a web-based laboratory would be very convenient for the control education community. This approach should include a web-based experimentation platform that supports both the student-teacher interaction and the collaborative processes among students in a similar way as happens in the traditional classroom. This paper gives some recommendations and insights about how to create such virtual and remote control laboratory applications, and how to make them more accessible to students. The paper is organized as follows. Section 2 describes the experimentation layer, which includes the fundamental aspects required to create virtual and remote control laboratories using LabVIEW and Easy Java Simulations. Section 3 presents the eMersion-based e-learning layer, which implements the complementary web-resources that users need to make a correct use of the experimental application. Section 4 lists all the steps needed to develop a virtual and remote control laboratory completely integrated in eMersion by using a servo-motor as didactical setup. Section 5 provides two additional examples of remote experiments. Finally, some conclusions and considerations about further work are given.
2. THE EXPERIMENTATION LAYER Excluding specific efforts from a few universities [4]-[6], there is no unified methodology or procedure to design, develop, and publish virtual and remote laboratories on Internet. However, the analysis of the growing number of publications (journals and conference proceedings) related to web-based laboratories let us distinguish a set of basic features that are frequently used as methodological steps for designing an integral environment for remote, pedagogical-oriented experimentation. The first feature corresponds to the design of an experimentation layer. This layer includes the creation of interactive client-side interfaces and server-side applications that run the real-time control loop and the transmission components for exchanging information with the remote user interfaces. The second main feature is the design of an e-learning layer to deploy web-based resources on Internet. In our approach, the experimentation layer has been developed following the usual clientserver architecture [7]. The choice of this architecture is due to its great flexibility, performance, and adaptability to situations in which either the continuity of the interaction, the orientation to the connection, or the quality of services play a fundamental role. To illustrate more in-depth the experimentation layer, next two subsections describe some design considerations and programming techniques for developing experimental web-based control applications.
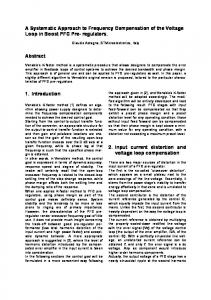
A Systematic Two-Layer Approach to Develop Web-Based Experimentation Environments for Control Engineering Education
507
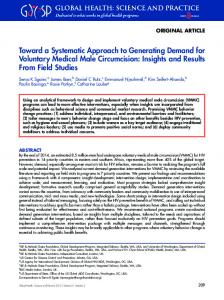
2.1 Building the Server-Side Figure 1 shows the standard structure of a feedback loop in control systems theory. The operations performed in a feedback loop follow a standard sequence. Operations labeled (a) and (b) in Figure 1 are, respectively, the measurement of the analogue output signal from the process and its conversion to digital format. Once the conversion is completed (b), this value is compared to the set point value (c) to obtain the error signal. With this information the control algorithm computes the control signal (d) that is then converted to its analogue representation (e) and applied to the physical process. This sequence of operations is known as the control task that must be carried out at a fixed time-interval called the sampling period that is chosen in accordance with the dynamics of the physical process. This fixed sampling interval or cycle time defines implementation constraints when a constant sampling period is often assumed [8]. The notion of real-time control is based on the above implementation constraints where computer operations rely on a deterministic time occurrence. The implementation of this type of applications in control engineering education and, especially, in virtual and remote experimentation across Internet is commonly made using LabVIEW software [9].
Figure 1. Feedback control scheme.
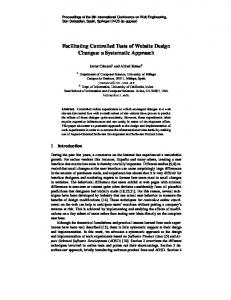
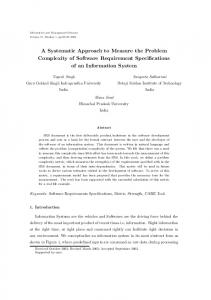
LabVIEW is a graphical programming language developed by National Instruments in 1968. In its origins, LabVIEW was developed for data acquisition and instrumentation control. However, last versions of LabVIEW allow users to use it to many other purposes: process control, industrial automation, modeling and simulation, digital signal processing, remote operation, realtime programming, etc. Programs developed with G, the graphical language of LabVIEW, are named VI (Virtual Instruments) due to the instrumentation-related origins. A VI is made up connecting multiple blocks, existing libraries of blocks for many purposes: vision, I/O hardware, mathematical calculations, simulation, Internet protocols, process control, database access, etc. One on the main reasons to use LabVIEW is the simplicity since users with low knowledge of programming can develop sophisticate programs, impossible to write using traditional programming languages. 2.1.1 Using LabVIEW for Remote Experimentation Because of the hard constraints in its sampling period (reading from sensors, executing the control algorithm, and writing to actuators), the execution of the control task must take place as regularly as possible. With LabVIEW, such regularity is achieved by using threads and DAQ board interrupts. However, to run a local version of the control task through Internet demands some modifications. In particular, the LabVIEW code that handles the communication with the remote client and with the video camera that provides the visual feedback has to be included. Figure 2 shows a
508
Intelligent Automation and Soft Computing
Figure 2. General architecture of a distributed control application using LabVIEW and Ejs.
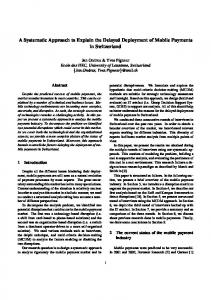
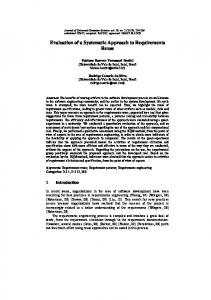
general scheme of this idea. The three boxes in the server-side represent each of the tasks required. Since the control task must keep the constraints in the cycle time, determinism in its execution must be ensured by assigning to it the highest priority. The communication and video tasks run in parallel to the control task but in different threads with lower execution priorities. Finally, methods that share data among tasks have to be performed but taking into account the determinism of the control task. LabVIEW shows very adequate here, since it provides simple multi-thread programming using Timed Loop blocks. These blocks allow programmers to include multiple threads in a single virtual instrument (VI), and running these threads at different sampling periods and with different priorities. Figure 3 shows a block diagram in LabVIEW that corresponds to the architecture of the server-side in Figure 2. The three loops in the diagram run concurrently to perform the main tasks in the server-side: control, communication, and video grabbing.
Figure 3. Three loops running concurrently in the LabVIEW server-side application.
A Systematic Two-Layer Approach to Develop Web-Based Experimentation Environments for Control Engineering Education
509
The control task is a time-critical activity running at a sampling period of 20 ms with a priority greater than the other two threads. The AI One PT block reads the analogue input signal from the sensor, its output is compared to the set-point input of the PID block and the result is fed into the AO One PT block that sends the resulting value to the actuator, thus completing the control task. The data structure composed by the set point value, the PID control parameters, the command to the actuator, and other variables is known as the control vector, and it is sent from the communication task to the control task through RT FIFO queues blocks (RT FIFO queues acts like a fixed size queue, so that the writing of data elements to an RT FIFO do not overwrite previous elements). These variables are produced when users interact with the client interface. On the other hand, the data array formed by the values sent to the actuator, the measurement from the sensor, the current time, and other variables is known as the state vector and it is transferred from the control task to the communication task through RT FIFO queues blocks. The video task is a non-time-critical activity since the loss of some video frames is generally acceptable for the user. For most applications, sending five images per second is enough to obtain an adequate visual feedback of the remote system. Finally, the communication task concatenates the current measurements (state vector) and the video frame (video vector) in a new vector. This resulting vector is sent to the client using a Comm WRITE block. In parallel, the control vector is received through the Comm READ block from the clients and passed to the control task by RT FIFO queues. The TCP protocol is used in both implementations because it guarantees packet delivery and bandwidth adaptation, albeit at the cost of extra transmission delays [10], [11]. An alternative is the UDP protocol which provides a better control of the transmission delay. However, UDP neither has guaranteed packet delivery mechanism nor bandwidth adaptation mechanism, thus the designer is left to implement these features.
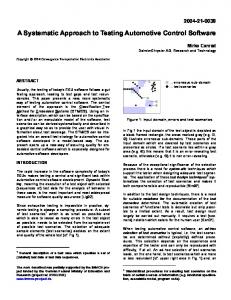
2.2 Building the Client-Side Interfaces Easy Java Simulations (Ejs) [12] has been chosen to develop the client interfaces used in this approach. But, before introducing readers to the development of the client-side interfaces, a short description of Easy Java Simulations is offered due to the relevance that this tool has obtained during last years for the development of virtual and remote laboratories in control engineering. Easy Java Simulations is a free software tool that helps create dynamic, interactive scientific simulations in Java language, which is being used successfully to develop virtual and remote control laboratories in several university departments [13]-[21]. The use of Java is justified by its wide acceptance by the Internet community, and due to the large number of supported platforms. Ejs falls in the category of code generators. This means that users need to provide the most relevant core of the simulation’s algorithm and the tool automatically generates a whole lot of extra code needed to create the complete interactive simulation. What makes Ejs special in this category is that it has been conceived by teachers and for teachers (and students) which are more interested in the understanding of the simulated phenomena that in the computer specific aspects. Ejs is based on an original simplification of the “model-view-control” paradigm, structuring a virtual laboratory in two main parts: the model and the view (see Figure 4). The model describes the behavior of the system using variables, ordinary differential equations, and Java code. The view (i.e., the user-to-model interface) is intended to: (1) provide a visual representation of the more relevant properties of the model and its dynamic behavior; and (2) facilitate the user’s interaction on the model. Both parts, that is, model and view, are closely interconnected since the evolution of the model state affects the view and, reciprocally, any user interaction with the view automatically modifies the value of the corresponding model variable.
510
Intelligent Automation and Soft Computing
View + Control Model
+ Simulation
Figure 4. Structure of a client-side application created in Easy Java Simulations.
Creating an application/applet with Ejs requires only a minimum knowledge of Java. While retaining the flexibility of a general programming language, so that it is possible to specify almost any type of algorithm, the tool provides extensive scaffolding for the model. Thus, the designer follows a guided sequence of steps in which he/she defines the model by: (a) declaring the variables that describe the system, (b) initializing these variables to a correct initial state, and (c) writing the algorithms that state how the value of these variables change in time or under user interaction. This last step consists in translating the mathematical equations or physical laws that govern the phenomenon under study into computer algorithms. Sometimes, though, the implementation of these algorithms can be a difficult task. For this reason, Ejs provides two extra conveniences. The first one is a built-in editor and solver for systems of ordinary differential equations (ODE). The user writes his/her equations, and the system automatically generates the Java code that numerically solves the system using one of the provided standard algorithms. The second facility is an external connection to Matlab/Simulink and SysQuake that lets users specify and solve their models with the help of these tools. To create the view, Ejs includes a library of ready-to-use graphical elements that can be used to build sophisticated and interactive views by simple drag and drop (See View panel in Figure 4). Combining these elements, the user designs the view to offer a visualization of the phenomenon appropriated to the desired pedagogical goals. In particular, the view should encourage students to
A Systematic Two-Layer Approach to Develop Web-Based Experimentation Environments for Control Engineering Education
511
explore the phenomenon under different perspectives in order to gain a better understanding of the system. To complete the view, its different elements have to be instructed to display on the screen according to the values of the variables of the model. Every graphic element of Ejs has certain internal values, called properties, that can be customized to make the element look and behave in a particular way (change its displayed value, position, size,…). The user can then connect the properties of the graphical elements of the view to the value of the different model’s variables. Some of these properties can also be instructed to trigger user-defined actions (typically routines defined in the model) when the user interactively changes them. This procedure, which we call linking the model and the view, is what turn the simulation into a real dynamic, interactive application. This mechanism conforms a simple, though very effective, way of designing and building advanced interactive user interfaces. The reason for this is that linking is a two-way connection. When one or more variables of the model change, this change is passed on to the view so that it immediately displays the new state of the model. Also, because the elements provided have built-in interactive capabilities, any interaction of the student with the interface immediately affects the model variables that have a connection to it. Once the developer has defined the model of the process (including the Java code to exchange information with the server-side in remote mode) and the view of the interactive user interface, Ejs generates the Java code that handles all the internal tasks, compile it into Java classes, pack the classes in a compressed file, and end up with a ready-to-use simulation. Simulations created with Ejs can be used as stand-alone applications under different operating systems (for instance, a .BAT file is provided when running under Windows), or be distributed via Internet and run as applets within HTML pages (which are also generated by Ejs) by using any Java-enabled web browser. The tool also includes a simple HTML editor to help the teacher enhance the generated web pages with pedagogical information and/or instructions for the simulation. The servo-motor example of Section 4 illustrates all the stages required for the creation of a client-side application using Ejs. According with our experiences, the following considerations are important when Ejs is used to create experimentation interfaces of web-based laboratories and LabVIEW is chosen as the application running at the server side: A Java method for sending and receiving data packets to/from the server-side must be implemented to control and obtain information from the plant. Some primitive data types in Java are different to data types in LabVIEW. Therefore, a Java class to convert those LabVIEW data types into Java data types is required. The same user interface should allow the user to run either the real system remotely or a local (virtual) simulation of it. When the interface is running in simulation mode, the variables associated to the system state are updated according to the evolution of a mathematical model of the process (written in the Ejs built-in ODE editor). However, in remote mode, these variables are true measurements. The graphical user interface must be simple and intuitive. An interface with too many sliders, buttons, graphical elements, scopes, and auxiliary windows incorrectly distributed would puzzle users and thus decrease their motivation [22]. Providing a mean to introduce remotely disturbances in the real system permits users to test the robustness of their controller design. More information about Easy Java Simulation, the last release of this software tool and complete user’s manuals can be freely downloaded from http://www.um.es/fem/Ejs/.
512
Intelligent Automation and Soft Computing
3. USING EMERSION AS THE E-LEARNING LAYER In this section we describe eMersion, a collaborative environment developed at the École Polytechnique Fédérale of Lausanne (EPFL) [23]. This tool supports the fundamental aspects related to the web-based collaborative works existing between students and instructors. From a pedagogical perspective, eMersion is a very convenient environment for distance learning in engineering disciplines because it incorporates all the elements needed to complete an experimental session emulating the work carried out in traditional laboratories [3], [24].
3.1 The eMersion Environment The Department of Computer Science and Automatic Control at UNED is using eMersion to support the experiments carried out by its control engineering students across Internet. Figure 5 shows the functional structure of the collaborative environment. The system is composed of four parts: the eJournal, the experimentation console, the on-line documentation, and the navigation bar. The eJournal module provides a shared space to facilitate the communication and collaboration among students and instructors during the learning process. In this space students can store, retrieve, and exchange their experimental results and documents. Documents and files stored in the eJournal are called fragments.
Figure 5. Components of the e-learning layer for remote experimentation.
The experimentation console module contains the Java applet developed with Ejs. Using this applet, students can perform their laboratory assignments by accessing to the resources of the real laboratory through Internet (remote laboratory) or by simulating the physical phenomenon using a mathematical model (virtual laboratory). The on-line documentation module provides a portfolio with theory, assignments, task protocols, and user’s manuals of the environment, and additional information to complete an experiment. The protocol describes the tasks to be performed by the students during the laboratory sessions. The tasks belong to two kinds: prelabs and labs. The first ones are assignments that students must carry out in simulation mode to gain knowledge about the real process. Only when the prelabs are mastered, students will obtain remote access to the plant located in the laboratory. Through the navigation bar the user can access the different modules described above. Additionally, the eMersion environment provides tools to organize work-groups and offer asynchronous messaging, news, and e-mail notification services.
3.2 Integrating Ejs Applications in eMersion Ejs offers several predefined Java built-in methods to ease the integration of client-side applications in eMersion. These methods allow Ejs applications to exchange fragments of data and snapshots of the graphical scopes with the e-Journal.
A Systematic Two-Layer Approach to Develop Web-Based Experimentation Environments for Control Engineering Education
513
Figure 6 shows a part of the structure of the Ejs view corresponding to the servo motor application discussed in the next section. The left part on the main window displays the tree-like structure of the view elements that make the graphical interface. The right-hand side of this window contains the individual graphical elements that Ejs offers to elaborate the views: graphical containers, panels, buttons, text-fields, labels, menus, 2D and 3D drawing elements, control symbols, etc. These elements are selected by dragging and dropping them to the view tree. The figure shows three auxiliary windows with the Java code executed when the user selects the menu options labeled SaveGraph, StartRecord, and StopRecord. This Java code uses Ejs built-methods that send information to eMersion. The functionality of these methods is the following: _saveImage: Takes a snapshot of the mixed-signal scopes available in the view. Images are stored in GIF format. _saveText: Records a text file (.mat extension) with the temporal evolution of the experiment. Once the experimental session is over, the user can load the data in the Matlab workspace for further analysis. _saveState: Stores the system state in a binary file (.dat extension). _readState: Reads a file previously recorded with _saveState. Data files produced with these predefined methods are automatically stored in the e-Journal, so Ejs developers do not need to include extra Java code to exchange information between both environments. A set of technical examples about how to use these methods in Ejs applications is available in the Ejs distribution.
Figure 6. Integration of Ejs applications in the eMersion environment.
4. A SERVO MOTOR PROTOTYPE As an illustration of the previous ideas, the development of a complete virtual and remote control laboratory of an electrical drive servo motor (eElab for short) is presented in this section. The eELab equipment is located in the Department of Computer Science and Automatic Control
514
Intelligent Automation and Soft Computing
at UNED. The prototype is part of a set of didactical setups selected to be used in remote experimentation environments. Other prototypes available are a quadruple-tank, a three-tank and a heat-flow apparatus, and step-by-step design procedures of their Ejs interfaces are described in [15], [17] and [25]. Currently all these prototypes can be manipulated via Internet by accessing on-line courses on control engineering available in the eMersion installed in a UNED server. These courses are based on electronic documents, multimedia presentations, interactive simulators, and virtual/remote laboratories.
4.1 The Server-Side Application for the eElab Table I contains a summary of the technical features of the hardware and software elements used to develop the eELab server application. Figure 7 shows a detailed model of the servo motor developed by Schorderet Technics [26]. In this scheme, the angular speed of the motor is modeled as a first order system and the angular position is obtained by integration of the speed. Kv and Kp factors are constants used to scale the physical values of the generator and position sensor in the output values read by the I/O card. Position and speed are controlled by a DC voltage (-5 to +5 volts) applied to the motor through an amplifier. Table I. Hardware and software components to develop the eELab server side eElab servo motor The eElab is composed by a DC motor that drives a steel disk that acts as a load. Either the angular position or the speed can be controlled by adjusting the DC voltage applied to the motor. The eElab is equipped with a firewire video camera that films the rotating disk.
Server computer Intel® Pentium® 4. 1 GB RAM. 3 GHz CPU. Windows 2000/XP Professional (Service Pack 2). PCI-E Gigabit Ethernet Controller (Network adapter). Firewire connection. Acquisition device The NI PCI-6025E multifunction I/O board is used to connect the server computer and the eELab. The board has 12 bits resolution and a maximum sampling rate of 200 kHz guaranteed for each channel. The maximum and minimum range of the inputs are ±10 V and ±50 mV. This card has 16 analogue input channels, 2 analogue output channels and 8 digital input/output channels. Further information on this board can be consulted at http://ni.com. Software LabVIEW 7.1 with NI-DAQ 7.4 drivers to interface with the NI PCI-6025E card. The QTLIB 2583 LV70.llb library developed at the EPFL [9] is used to communicate the LabVIEW applications and the firewire camera of the eELab.
Figure 7. Model of the electrical drive servo motor by Schorderet Technics.
A Systematic Two-Layer Approach to Develop Web-Based Experimentation Environments for Control Engineering Education
515
Considering the time constant of the motor tau (0.253 sec), a sampling period of 20 ms is chosen to satisfy the sampling theorem. To guarantee the sampling period accuracy in the control task, a timer found in the DAQ board is used. This timer permits to synchronize the AD and the DA conversion. The control algorithm is a standard PID controller with set-point weighting, anti-windup mechanism, and filtering of the derivative action [8]. Figure 8 shows a block diagram of the controller and the code of the discrete version of the PID programmed in LabVIEW. Within the video task (Figure 9), images are acquired using the built-in firewire camera. These images are read, compressed in JPEG format, and passed to the communication task at 10 frames per second, a value that provides an acceptable visual feedback of the real process. These images are then decompressed and rendered in the client Ejs application. The communication task performs the data exchange between the client and the server. At the server side, data produced by the control task (state vector) and the video task (JPEG image) are concatenated and sent to the client-side using the Comm WRITE block VI. Data sent from the clients (control vector) are read using the Comm READ block VI and transferred to the control task.
4.2 The client-side of the eElab Figure 10 presents the client-side interface (experimentation console) developed in Ejs to operate in virtual mode (using the model described in the previous section) or in remote mode with the eELab. The window is divided into two parts. The left part contains an image of the motor and a control panel used to define different system parameters. The virtual representation has been developed copying the frontal view of the real motor. Hence, any variation of the system state during the simulation will be displayed as a rotational movement of the disk. However when a user works in remote mode, this virtual representation is replaced by video images sent from the server. When the application is working in remote mode, the Augmented option can be enabled. In this configuration a virtual representation of the motor is overlaid on the video image. When the available bandwidth is not large enough, this virtual representation can serve as a substitute of the video.
(a) (b) Figure 8. PID controller structure. (a) Continuous PID controller. (b) Discrete PID controller programmed with LabVIEW.
516
Intelligent Automation and Soft Computing
Figure 9. LabVIEW data flow in the server-side for the eELab remote experiment.
The control panel contains two subpanels accessible by tabs. The first tab, named Control (visible in Figure10), lets the user choose the type of experience (virtual or remote), switch between position and speed control, and change the system dynamics (for instance, modifying the set point or introducing disturbances by the brake). The four buttons located at the bottom of the control panel (Play, Pause, Reset, and Connect) allow specifying how the system must work. The Connect button starts the remote mode by connecting to the real process running at the university laboratory. By default, the application begins working in simulation mode. The second tab presents sliders and buttons to tune the PID controller. Finally, a status bar below the control panel displays messages related to the state of the connection between client- and server-sides.
Figure 10. The eELab integrated in the eMersion environment.
A Systematic Two-Layer Approach to Develop Web-Based Experimentation Environments for Control Engineering Education
517
The right part of the main window contains two mixed-signal scopes and numerical fields that show the evolution of the process variables (angular position and velocity) and the composition of the control action (P and I components). The status bar located at the bottom indicates the time remaining for the remote session. In the upper part there are three menus labeled eJournal, Control, and Language. The eJournal menu provides commands to take a snapshot of the evolution of the system in GIF format and to save a record of the value of its variables in a plain text format. The Control menu allows switching between the manual (the voltage applied to the motor is set by the user) and the automatic control mode (the voltage to the motor is calculated by the PID controller).
4.3 The eELab Control Laboratory Integrated in eMersion Figure 10 shows the general view of the eELab remote control laboratory integrated in eMersion. The upper frame displays the navigation window, which allows users to access the modules of the experimentation environment. The Objective area contains a textual description of the topic covered in the laboratory. The Navigation area contains a group of icons that grant users access to the different modules described in Section 3. The window on the right contains the eJournal. Data fragments produced from the user interface will be stored in the eJournal. These fragments can later be used by students to generate reports.
5. OTHER EXAMPLES OF REMOTE EXPERIMENTATION This section describes two applications created by following the design considerations described in this paper. These web-based applications have been developed to explain specific PID control concepts, as temperature control of a heat-flow system, and level control of a set of interactive tanks. As well as with the eELab, these two laboratories can be remotely controlled or used in simulation mode.
Figure 11. The heat-flow setup by Quanser.
5.1 The Heat-Flow Web-Based Laboratory The heat-flow setup has been developed by Quanser Consulting (Figure 11) [27]. This system presents features to study concepts of temperature flow control system with transport lags and identification techniques. The setup consists of a duct with the following components: a heating element and a blower located at both ends of the structure, and three temperature sensors S1, S2, and S3 along the duct. The power delivered to the heater and the fan speed can be controlled using the analogue signals Vh and Vb. Fan speed is measured using a tachometer that produces an analogue signal Vt which can be used to design speed controllers. A model is required to build the virtual laboratory simulation. Its transfer function is:
518
Intelligent Automation and Soft Computing
G( s) =
K p (1 + sT3 ) Cn ( s ) e − Ls = Vh ( s ) (1 + sT1 )(1 + sT2 )
(1)
Cn (s): Air temperature at sensor n. Vh (s): Voltage applied to the heating element. where steady-state gain Kp, lags T1, T2, T3, and delay L depend on which of the three sensors is used to close the temperature control loop. Figure 12 shows the main window of the experimentation console when running in virtual mode. To reduce the student learning curve the experimentation consoles in the proposed webbased laboratories are always very similar.
Figure 12. Graphical user interface developed with elements of the Ejs graphical library. The colour of the heat-flow changes according to the temperature of the inner air. This feature can be considered as a kind of augmented reality technique to reinforce to the user the feeling of physical presence in the lab.
At the top of the heat-flow experimentation console, there is a 3D representation of the setup whose color varies according to the air temperature inside the duct. At the bottom of the left panel, there are control elements that allow the user to choose the type of experience (virtual or remote), switch the control mode (open or closed loop), and a set of sliders and buttons to change the operating conditions (for instance, changing the set point or introducing some disturbance by varying the heater voltage Vh). Figure 13 shows the experimentation console when users work with the didactical setup instead of with the heat-flow simulation. In this case, the 3D view of the heat-flow is replaced by a real-time video image of the apparatus. Since the air heating process can not be appreciated in the video, users can overlay the video image and the virtual 3D visualization to appreciate the air temperature using the information provided by the three sensors.
A Systematic Two-Layer Approach to Develop Web-Based Experimentation Environments for Control Engineering Education
519
Figure 13. Experimentation console when the real setup is used for experimentation instead of the model. The Augmented check button lets users display the temperature of the duct on the video image using the current outputs of the three sensors.
5.2 The three-tank laboratory The three-tank setup has been proposed as a benchmark system for different purposes, for instance, test system for fault detection, identification and multivariable control, and reconfigurable control. To develop this laboratory, the DTS200 three-tank system manufactured by Amira GmbH [28] was selected (Figure 14). The plant consists of three cylinders T1, T2, and T3 with cross section A. These cylinders are connected serially with each other through pipes of cross section Sn. On the left side of the tank T2 there is the single outflow valve, which has a circular cross section Sn. The output-flowing liquid is collected in a reservoir located under the three tanks. This reservoir supplies pumps 1 and 2 with liquid. These pumps represent the input flows of tanks T1 and T2. In the global control system, the pump flow rates correspond to the input signals of the process, and the levels of T1 and T2 are the output signals. All of them can be used for control purposes.
Figure 14. View and structure of the three-tank system.
520
Intelligent Automation and Soft Computing
Figure 15 shows two views of the console. The design of the views is very similar to the previous web-based laboratories, and, as well, users have the option to overlay to the video a 2D representation of the setup and compare and contrast the results of the simulation and of the real system.
Figure 15. Two views of the remote laboratory for level control of a three-tank system.
Students operate the system in a very intuitive way. For instance, they can interactively change the set points of tanks T1 and T2 by dragging up and down two arrows. The opening and closing of the different valves, leaks and pumps in the system can also be operated using sliders. In this laboratory, the control objective is to regulate the level of the liquid in tanks T1 and T2. A schematic of a possible multi-loop control strategy for this process is shown in Figure 16.a, where C1 and C2 are the controllers. The control strategy implemented in this laboratory is a decentralized PID controller (one for each loop). A detailed block diagram of this structure is given in Figure 16.b, where K is the proportional gain, Ti the integral time, Td the derivation time, N is a parameter to limit the high frequency gain (N∈[2, 20]), and b is the set-point weighting parameter (b∈[0, 1]). By modifying the parameters of the PID controller, other variants, such as P, PI, or PD, are obtained. Manual control is also possible in this laboratory. Using this control, students can clearly observe that the system is non linear, since the flow of the system is a function of each of the tank heights.
(a) (b) Figure 16. Control strategy for the three-tank system.
A Systematic Two-Layer Approach to Develop Web-Based Experimentation Environments for Control Engineering Education
521
6. CONCLUSIONS Virtual and remote experimentation for engineering education can be considered a mature technology. However, the process of transforming a classical control experiment into an interactive web-based laboratory is not an easy task. This paper provides a systematic approach for the fast development of remote laboratories using three tools: Easy Java Simulations, LabVIEW, and eMersion. The proposed approach eases the development of online experimentation environments and, also, it provides an effective scheme to switch between simulation and operation of real systems, which is a key feature for hands-on learning activities in engineering education. The described approach has been implemented at the UNED for deploying the virtual and remote laboratory experiments described in the paper. During the academic year 2006/07, pilot experiences were performed with students. The evaluation was completed during the 2007 summer term with 50 students enrolled in the Physics degree program at the UNED. The process control laboratory is a mandatory experience for these students. The evaluation questionnaires returned at the end of the term showed the percentages of the survey given by the audience, who rated them as strongly agree, agree, neutral, disagree, or strongly disagree. These answers are summarized in Table II. Table II. Student questionnaire results in percentage of total number of answers per subscale. Sub-scale Learning Value Value Added Design Usability Technology Function
% Strongly Agree 55.5 33.3 38.8 53.3
% Agree 33.3 66.7 55.5 13.3
% Neutral 11.2 0.0 5.7 13.3
% Disagree 0.0 0.0 0.0 0.0
% Strongly Disagree 0.0 0.0 0.0 0.0
% N/A 0.0 0.0 0.0 20.1
The analysis of the evaluation results shows up that the pilot experience was a very promising achievement. Regarding that UNED is a relevant distance learning institution in the worldwide context, these experiences and further ones must be repeated, improved, encouraged and taken into account seriously for the preparation of the new master and graduated studies adapted to the near European Space of Higher Education.
ACKNOWLEDGEMENTS This work has been supported by the Spanish CICYT under grant DPI2007-61068.
REFERENCES 1. 2. 3.
S. Dormido, “Control learning: Present and future,” Annual Control Reviews, 28: 115-136, 2004. M. Magin and S. Kanapathipillai, “Engineering students understanding of the role of experimentation,” European Journal of Engineering Education 2008; 25(4):351-358. D. Gillet, A. Nguyen, and Y. Rekik, “Collaborative web-Based Experimentation in Flexible Engineering Education,” IEEE Transactions on Education, 48(4):696-704, 2005.
522
4.
5.
6.
7. 8. 9.
10. 11.
12. 13. 14.
15.
16.
17.
18.
19.
20.
Intelligent Automation and Soft Computing
R. Pastor, J. Sánchez, and S. Dormido, “A XML-based for the Development of web-based Laboratories focused on Control Systems Education,” International Journal of Engineering Education, 19(3):445-454, 2003. M. Casini, A. Leva, and F. Schiavo, “AIRES: a Standard for web-based Remote Experiments,” Proceedings of the 16th IFAC World Congress, Prague, Czech Republic, 2005. R. Pastor, C. Martín, J. Sánchez, and S. Dormido, “Development of a XML-based Lab for Remote Control Experiments on a Servo Motor,” International Journal of Electrical Engineering Education, 42(2):173-184, 2005. C.C. Ko, B.M. Chen, and J. Chen, Creating web-based Laboratories, Springer, London, 2004. K. Astrom and T. Hagglund, Advanced PID Control, Research Triangle Park, NC: ISAThe Instrumentation, Systems, and Automation Society, 2006. Ch. Salzmann, D. Gillet, and P. Huguenin, “Introduction to Real-time Control using LabVIEWTM with an Application to Distance Learning,” International Journal of Engineering Education, 16(3):255-272, 2000. D. Lim, “A Laboratory Course in Real-Time Software for the Control of Dynamic Systems,” IEEE Transactions on Education, 49(3):346-354, 2006. Ch. Salzmann, D. Gillet, and Ph. Müllhaupt, “Real-Time Interaction over the Internet: Model for QoS Adaptation,” Proceedings of the 16th IFAC World Congress, Prague, Czech Republic, 2005. F. Esquembre, “Easy Java Simulations: A software tool to create scientific simulations in Java,” Comp. Phys. Comm., 156:199-204, 2004. J. Sánchez, S. Dormido, and F. Esquembre, “The learning of control concepts using interactive tools,” Computer Applications in Engineering Education, 13(1):84-98, 2004. S. Dormido, C. Martín, R. Pastor, J. Sánchez, and F. Esquembre, “Magnetic Levitation System: A Virtual Lab in Easy Java Simulation,” Proceedings of the American Control Conference (ACC'04), Boston, EEUU, pp. 3215-3220. J. Sánchez, F. Esquembre, C. Martín, S. Dormido, S. Dormido-Canto, R.D. Canto, and R. Pastor, “Easy Java Simulations: An Open-Source Tool to Develop Interactive Virtual Laboratories Using Matlab/Simulink,” International Journal of Engineering Education, 21(5):798-813, 2005. D. Buccieri, J. Sánchez, S. Dormido, P. Mullhaupt, and D. Bonvin, “Interactive 3D Simulation of Flat Systems: The SpiderCrane as a Case Study,” Proceedings of the 44th IEEE Conference on Decision and Control and European Control Conference (CDC/ECC 2005), Sevilla, Spain. N. Duro, R. Dormido, H. Vargas, S. Dormido, J. Sánchez, and R. Pastor, “The Three-Tank System: A Remote and Virtual Control Laboratory using Easy Java Simulations,” Proceedings of the 44th IEEE Conference on Decision and Control and European Control Conference (CDC/ECC 2005), Sevilla, Spain. A.M. Hernández, M.A. Mañanas, and R. Costa-Castelló, “RespiLab: A virtual laboratory for the analysis of human respiratory control system,” Proceedings of the 7th IFAC Symposium on Advances in Control Education (ACE 2006), Madrid, Spain. V. Nguyen, N. Cécile, and S. Konrad, “Simulator of an industrial wastewater treatment process in Easy Java,” Proceedings of the 7th IFAC Symposium on Advances in Control Education (ACE 2006), Madrid, Spain. A. Mago, W. Medina, L. Fermín, J. Grieco, G. Fernández-López, and J. Cappelletto, “Control systems simulator for wheeled robots using Easy Java Simulations,” Proceedings of the 7th IFAC Symposium on Advances in Control Education (ACE 2006), Madrid, Spain.
A Systematic Two-Layer Approach to Develop Web-Based Experimentation Environments for Control Engineering Education
21.
22.
23. 24.
25.
26. 27. 28.
523
A. Visioli and F. Pasini, “A virtual laboratory for the learning of process controllers design,” 7th IFAC Symposium on Advances in Control Education (ACE 2006), Madrid, Spain. D. Gillet, Georgios Fakas, Y. Rekik, K. Zeramdini, F. Geoffroy, and S. Ursulet, “The Cockpit: An Effective Metaphor for Remote Experimentation in Engineering Education,” International Journal of Engineering Education, 19(3): 389-397, 2003. Emersion environment by EPFL home page. Available at http://emersion.epfl.ch G. J. Fakas, A. V. Nguyen, and D. Gillet, “The Electronic Laboratory Journal: A Collaborative and Cooperative Learning Environment for web-Based Experimentation,” Computer Supported Cooperative Work, 14:189-216, 2005. H. Vargas, R. Dormido, N. Duro, J. Sánchez, S. Dormido-Canto, G. Farias, S. Dormido, and F. Esquembre. “Heatflow: Un Laboratorio Basado en web Usando Easy Java Simulations y Labview para el Entrenamiento en Técnicas de Automatización,” XII LatinAmerican Congress on Automatic Control (CLCA 2006), Salvador (Bahia, Brazil). SCHORDERET Technics home page. Available at http://www.schorderet-technics.ch Quanser Consulting Inc home page. Available at http://www.quanser.com GmbH home page. Available at http://www.amira.de
ABOUT THE AUTHORS H. Vargas is a fellow student in the Department of Computer Science and Automatic Control at UNED. His current research is focused in the design of web-based systems for control education. Vargas received a degree in electronic from Chile de la Frontera de Temuco University.
J. Sánchez received his PhD in Sciences in 2001 from UNED, Spain. Since 1993 he works at the Department of Computer Science and Automatic Control in UNED as associate professor. His current research interests are the design of new systems for control education, web-based laboratories, and networked control systems.
N. Duro is an associate professor in the Department of Computer Science and Automatic Control at UNED. Her current research interests are control process, modeling and simulation of continuous processes, and the design of new systems for control education. Duro has a PhD in Sciences from UNED.
R. Dormido is an associate professor in the Department of Computer Sciences and Automatic Control at UNED. Her current research interests are robust control, modeling and simulation of continuous processes, and the design of systems for control education. Dormido has a PhD in Sciences from UNED.
524
Intelligent Automation and Soft Computing
S. Dormido-Canto is an associate professor in the Department of Computer Science and Automatic Control at UNED. His current research interests are related to the analysis and design of control systems via intranet or Internet, and high-performance interconnection networks for cluster of workstations.
G. Farias is a fellow student at the Department of Computer Science and Automatic Control at UNED. His current research interests include simulation and control of dynamic systems and virtual and remote laboratories. Farias is computer science engineering from Chile de la Frontera de Temuco University.
S. Dormido was appointed Professor to the Chair of Automatic Control at Department of Computer Science and Automatic Control, UNED. His scientific interests cover aspects of automatic control and web-based labs for distance education. He has authored and co-authored more than 200 technical papers in international journals and conferences.
F. Esquembre received the Ph.D. degree in Mathematics in 1991 from the University of Murcia, Spain, where he currently teaches. His expertise includes differential equations and numerical analysis. He has participated in numerous international and national research projects. His research includes the use of simulations for didactical purposes.
C. Salzmann is a Senior Research Associate at the École Polytechnique Fédérale de Lausanne (EPFL). He received his PhD degree from the EPFL in 2005. His research interests include new Web technologies, real-time control, real-time interaction over the Internet with an emphasis on Quality of Service and bandwidth adaptation D. Gillet is currently Maître d'enseignement et de recherche (Associate Professor) at the Systems Engineering Institute at EPFL, where he leads a multi-disciplinary research group. His current research interests include new learning technologies, sustainable interaction and collaboration systems, realtime Internet services, as well as nanopositioning systems.