396
Int. J. Materials and Structural Integrity, Vol. 2, No. 4, 2008
A Taguchi method application for the part routing selection in generalised group technology Wafik Hachicha* Unit of Mechanic, Modelling and Production (U2MP), B.P. 1173, 3038 Sfax, Tunisia and Department of Industrial Management, Higher Institute of Industrial Management of Sfax, B.P. 954, 3018, Sfax, Tunisia E-mail:
[email protected] *Corresponding author
Faouzi Masmoudi and Mohamed Haddar Unit of Mechanic, Modelling and Production (U2MP), National Engineering School of Sfax, B.P. 1173, 3038, Sfax, Tunisia E-mail:
[email protected], E-mail:
[email protected] Abstract: Cellular manufacturing (CM) is an important application of group technology (GT) that can be used to enhance both flexibility and efficiency in today’s small-to-medium lot production environment. The crucial step in the design of a CM system is the cell formation (CF) problem that involves grouping parts into families and machines into cells. The CF problem is increasingly complicated if parts are assigned with alternative routings (known as generalised GT problem). In most of the previous works, the route selection problem and CF problem were formulated in a single model, which is not practical for solving large-scale problems. We suggest that a better solution could be obtained by formulating and solving them separately in two different problems. The aim of this case study is to apply the Taguchi method to the route selection problem as an optimisation technique to get back to the simple CF problem, which can be solved by any of the numerous CF procedures. In addition, the main effect of each part and analysis of variance (ANOVA) are introduced as a sensitivity analysis aspect that is completely ignored in previous research. The case study results provided a better CF solution compared with Kusiak’s solution. Keywords: cellular manufacturing; CM; cell formation; CF; alternative routings; generalised group technology; GT; route selection problem; Taguchi method; analysis of variance; ANOVA; sensitivity analysis. Reference: to this paper should be made as follows: Hachicha, W., Masmoudi, F. and Haddar, M. (2008) ‘A Taguchi method application for the part routing selection in generalised group technology’, Int. J. Materials and Structural Integrity, Vol. 2, No 4, pp.396–406.
Copyright © 2008 Inderscience Enterprises Ltd.
A Taguchi method application for the part routing selection
397
Biographical notes: Wafik Hachicha is an Industrial Engineering graduate (1999) from the National School of Engineers of Tunis (ENIT), and is now pursuing his PhD in manufacturing design and management area at the National School of Engineers of Sfax (ENIS). He is a researcher at the Mechanics Modelling and Production Research Unit (U2MP). He is an assistant at the Higher Institute of Industrial Management of Sfax-Tunisia. His research activities deal with the design, the modelling and the simulation of manufacturing and logistic systems. Faouzi Masmoudi has obtained his PhD in Computer-Integrated Manufacturing (1988) from ENSAM de Paris-France. He is a Professor at the National School of Engineers of Sfax in Tunisia, and a Researcher at the Mechanics Modelling and Production Research Unit (U2MP). His activities of research are: modelling and simulation of manufacturing systems; design and layout of the cellular systems of production; and simulation of manufacturing cells with unreliable machines. Mohamed Haddar has obtained his PhD in Applied Mechanics (1991). He is a Professor at the National School of Engineers of Sfax in Tunisia, and the Director of the Mechanics Modelling and Production Research Unit. His topics of research activities deal with the dynamic behaviour of machine elements (gears, bearings, belts, etc.) and the manufacturing process simulation.
1
Introduction
A cellular manufacturing system (CMS) is a production approach aimed at increasing production efficiency and system flexibility by utilising the process similarities of the parts. It involves grouping similar parts into part families and the corresponding machines into machine cells. This results in the organisation of production systems into relatively self-contained and self-regulated groups of machines such that each group of machines undertakes an efficient production of a family of parts. A survey of CMS implementations witnessed variety of benefits, which lead to overall productivity improvement in the manufacturing system. CMS design process is a multi-step process involving a host of implementation decisions. The fundamental step in cellular manufacturing (CM) is to identify machine cells and associate part families. To solve this problem, usually known as the cell formation (CF) problem, different methods have been developed in the literature. Comprehensive summaries and taxonomies of studies devoted to CF problems were presented by Wemmerlöv and Hyer (1986), Shambu (1996), Selim et al. (1998) and many others. CF problem are principally divided in two categories. The first important category of models assume a single routing (or process route) possibility for each part. In this case, CF problem is fully studied and the optimal solution can be founded easily using numerous techniques. But in second category, authors have argued that by taking the flexibility offered by the presence of multiple routings (or process routes) into account at the design phase, several benefits can be realised, such as allowing for a smaller number of machines, higher machine utilisation, a reduced interdependence between cells and an improved system throughput rate (Kusiak, 1987). During the last three decades, numerous methods have been proposed for CF in the second category (i.e., in the presence of alternatives routings) since Kusiak (1987) coined the term generalised group technology. In this second category, the performance
398
W. Hachicha et al.
guarantee of previous methods is not known. The limited number of comparisons published to date indicates that solutions differ depending upon the algorithm used. Those methods can be classified into three types: sequential or hierarchical approaches, iterative methods and simultaneous approaches. Gupta (1993) used a hierarchical approach, which is carried out in two steps. In the first step, routes are selected for each part type (one route for each part type) at the same time, as part families are formed on the basis of these routes. Subsequently, machines are assigned to the part families in the second step. In the category of iterative methods, Nagi et al. (1990) proposed an iterative method between the route selection and CF subproblems. The route selection subproblem solved by the simplex method and CF subproblem solved by a heuristic. Caux et al. (2000) present also a combined iterative approach to solve simultaneously the CF problem using a simulated annealing algorithm and the part routing assignment problem using a branch and bound algorithm. Other authors identify part families and machines groups simultaneously in a single model such as Kusiak’s (1987), which extended the integer programming model (generalised p-median model) for route selection and part family formation simultaneously. As recognised by these authors themselves, iterative and simultaneous approaches are not practical for solving large-scale problems. We suggest that better grouping solutions could be obtained by formulating and solving them separately in two different problems such as recommended by Hwang and Ree (1996) and Hachicha et al. (2008b). In addition, most of the existing CF methods in the presence of alternative routings (sequential iterative and simultaneous approaches) ignore the sensitivity analysis of alternative routings for each part. In other words, the drawback of these approaches is that information given by the remainder alternative routings for each part is not used after obtaining the CF solution. However, considering the competitive and the reactive nature of industry nowadays, an applicable approach should take the dynamic conditions into account. The approach developed in this paper addresses the first subproblem of CF with alternative routings. It attempts to determine the part routings using Taguchi method while minimising total intercellular part traffic. This paper is organised as follows. In Section 2, the research methods based on Taguchi method and CF performances criteria, which are proposed in literature, are briefly described. The proposed approach is then presented in Section 3 through a literature case study. Finally, concluding remarks and perspectives are made in Section 4.
2
Research method
2.1 Taguchi method The Taguchi method contains system design, parameter design and tolerance design procedures to achieve a robust process and result for the best product quality (Taguchi, 1987). The purpose of system design procedure is to find the suitable working levels of the design factors. The parameter design procedure determines the factor levels that can generate the best performance of the product or process under study. The tolerance design procedure is used to fine-tune the results of parameter design by tightening the tolerance levels of factors that have significant effects on the product or process. Regardless of the online or offline engineering, the Taguchi method can efficiently improve the effectiveness of the product or process by using a loss function and achieve the robust product quality in terms of the parameter design (Taguchi, 1993). In general, the
A Taguchi method application for the part routing selection
399
parameter design of the Taguchi method utilises orthogonal arrays (OAs) to minimise the time and cost of experiments in analysing all the factors and uses analysis of variance (ANOVA) and the signal-to-noise (S/N) ratio to analyse the experimental data and find the optimal parameter combination. Using OAs significantly reduces the number of experimental configurations to be studied (Montgomery, 1991). Procedures for conducting a parameter design include the following steps: 1
planning experiment 1 determine the control factors, noise factors and quality or performance measure responses of the product or process 2 determine the levels of each factor 3 select an appropriate OA table.
The selection of the most appropriate OA depends on the number of factors and interactions and the number of levels for the factors. For examples, an L8 (27) OA can lay out eight trials, up to seven factors in columns and two factor levels. 2
implementing experiment
3
analysing and examining result 1 determine the parameters signification (ANOVA) 2 conduct a main effect plot analysis to determine the optimal level of the control factors 3 execute a factor contribution rate analysis 4 confirm experiment and plan future application.
The Taguchi approaches were initially used in quality engineering (Montgomery, 1991). Currently, the applications have expanded to other fields such as chemical, mechanical engineering, materials and welding technology, computer simulation analysis and others. The originality of the present paper consists in using Taguchi method to the CMSs design with alternative routings. In this Taguchi method application, parts are considered as process parameters or factors and alternatives routings of each part as levels.
2.2 CF performances criteria Two approaches may be adopted for the presentation of the initial data CF problem: a machine-process plan binary incidence matrix or a machine-operation processing time matrix. When operation sequence information is employed, the common objective function is the minimisation of the transportation costs (including intercellular and intracellular movements). When a binary incidence matrix is used, the common objective function is the minimisation of a weighted sum of the number of exceptional elements (out-of-cell) and the number of void elements (intra-cell) or any other performances criteria based on these concepts such as the percentage of exceptional elements, the machine utilisation and the grouping efficiency. The limiting assumption in those CF criteria is that the final solution must be performed for the calculation of those performance criteria. Therefore, they cannot be used as response measure for the proposed Taguchi method application. To overcome this condition, we suggest the use of another criterion, which must put forward automatically the quality of a CF solution
400
W. Hachicha et al.
without performing the diagonal blocs form (as presented by Hachicha et al., 2008a). This criterion, which will be presented in the following subsection, can be applied to the initial incidence part-machine matrix. The initial incidence matrix, which is called A, is a binary matrix, in which rows are parts and columns stand for machines. Since the CF problem is considered as a dimension reduction problem in which a large number of interrelated machines and parts are grouped into a smaller set of independent cells, the principal components analysis application can give rapidly an excellent solution as mentioned by Albadawi et al. (2005) and Hachicha et al. (2006). Principal components analysis is one of the most common methods used by data analysts to provide a condensed description. It is a dimension reduction technique, which attempts to model the total variance of the original dataset, via new uncorrelated variables called principal components. Principal components analysis consists of determining a small number of principal components that recover as much variability in the data as possible. These components are linear combinations of the original variables and account for the total variance of the original data. Thus, the study of principal components can be considered as putting into statistical terms the usual developments of eigenvalues and eigenvectors for positive semi-definite matrices. The eigenvector equation where the terms λ1 ≥ λ 2 ≥ ..... ≥ λ m are the real, non-negative roots of the determinant polynomial of degree m given as: det(S-λ i I) = 0 ; i ∈
(1)
where m denotes the number of machines and S is the covariance matrix, which is expressed by: S=
1 t BB p
(2)
where B denotes the standardisation matrix of the initial incidence matrix A, Bt denotes the transpose of matrix B and p is the number of parts. When principal components analysis was performed on the mean centred data, a model with the first and the second principal components was usually obtained. This model explained the recover cumulated percentage (CP) of the variance in the data by the following expression: CP =
λ1 + λ 2 m
∑λ k =1
=
λ1 + λ 2 m
(3)
k
Detailed description of principal components analysis application in CF problem and CP calculation can be found in Hachicha et al. (2008a). The CP, as a statistical criterion measure, is available by using one of several commercial software packages including SAS, SPAD, SPSS, S-PLUS, XLSTAT and others.
3
The proposed methodology
The aim of this case study is to determine the best part routings of each part type using Taguchi method while minimising CP measure and consequently, the total intercellular part traffic. As mentioned in the preceding section, the Taguchi method contains
A Taguchi method application for the part routing selection
401
principally three steps, which are detailed in the following subsections. It should be noted that S/N ratio is not performed because the target is fixed and signal factors are absent (static design).
3.1 Orthogonal array experiments In this study, an experiment is designed for better understanding the effect of alternative routings for each part and its implications on the performance of the CF solution. To this end, Taguchi’s parameter design approach has been employed for modelling and analysing the influence of alternative routings of each part on performance output. In this Taguchi method application, parts are considered as process parameters or factors, alternatives routings of each part as levels and CP as the adopted response measure of CF solutions. Table 1 Line 1
The part-machine incidence matrix with complete alternative routing Part
Route
M1
M2
M3
M4
M5
M6
P1
R11
0
1
0
0
1
1
R12
0
1
1
0
0
1
R21
0
1
0
1
1
1
2 3
P2
4
R22
0
1
0
1
0
1
5
P3
R30
1
0
0
1
0
0
6
P4
R41
0
1
0
1
1
0
R42
0
1
0
1
0
1
7 8
P5
R51
1
0
1
1
0
0
9
R52
1
0
1
0
1
0
10
R53
0
0
1
1
0
0
11
R54
0
0
1
1
1
0
R61
0
1
0
1
0
0
R62
0
0
0
1
0
1
12
P6
13 14
P7
R70
1
0
1
0
0
0
15
P8
R81
0
1
0
1
1
1
16 17
R82
1
1
0
1
0
1
P9
R91
0
1
0
1
0
1
R92
0
1
0
0
1
1
P10
R101
0
0
1
1
0
0
R102
0
0
0
1
1
0
18 19 20
In order to explain the methodology of the proposed approach, a manufacturing system is considered with six machines (labelled M1–M6) and ten parts (labelled P1–P10). Parts P1, P2, P4, P6, P8, P9 and P10 at two level each one (two alternative routings). Part P5 at four levels (four alternative routing: R51, R52, R53 and R54). Parts P3 and P7 have no alternative routing. This example is taken from Sankaran and Kasilingam (1990). The machine-part matrix with complete set of alternative routes is shown in Table 1. The first subproblem consists of selecting one route for each part that will give the best CP as the
402
W. Hachicha et al.
adopted performance measure criteria for grouping of the machines in cells. As explained in Subsection 2.1, optimising a process design means determining the best architecture levels of each factors (i.e., in this case, determining the best route of each part). The selection of routings affects the CF final solution and consequently, the CP measure, which is considered as the output quality response of the proposed Taguchi method application. The example of Table 1 contains ten parts including two fixed routing parts which are P3 and P7. Therefore, eight process parameters were identified. Part P5 with four levels and the others each with two levels. The OA, L16 (41 × 27), is used to conduct ideally the experiment in this example. In fact, it can lay out 16 trials, up to eight factors in columns: seven factors with two levels each one and only one factor with four levels. It should be noted that this OA reduces the number of factorial design experiments 512 (41 × 27) to only 16 experimental evaluations. The layout of the L16 (41 × 27) OA is shown in Table 2. It also shows the output responses (CP measure) for each experimental trial (configuration). Table 2 No.
The L16 (41 × 27) OA and CP measure P1
P2
P4
P5
P6
P8
P9
P10
CP
1
1
1
1
1
1
1
1
1
78.0
2
1
1
1
1
1
2
2
2
77.5
3
2
2
2
1
2
1
1
1
79.5
4
2
2
2
1
2
2
2
2
69.2
5
1
1
2
2
2
1
1
2
78.7
6
1
1
2
2
2
2
2
1
77.6
7
2
2
1
2
1
1
1
2
76.1
8
2
2
1
2
1
2
2
1
71.0
9
1
2
1
3
2
1
2
1
74.4
10
1
2
1
3
2
2
1
2
64.4
11
2
1
2
3
1
1
2
1
75.0
12
2
1
2
3
1
2
1
2
68.6
13
1
2
2
4
1
1
2
2
70.1
14
1
2
2
4
1
2
1
1
70.8
15
2
1
1
4
2
1
2
2
70.9
16
2
1
1
4
2
2
1
1
63.1
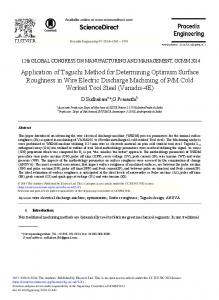
3.2 Implementing experiments and main effect plot Due to the deterministic aspect of the problem, one trial was conducted for each configuration. Then, the main effect plot is analysed to set the optimal route for each part. Afterwards, analysis of main effect is applied as a sensitivity analysis to determine each part signification. The MINITAB 14.0 software is used to assist the interpretation of the results. The optimum level (routing) for each factor (part) is the level that gives the highest value of CP measure in the experimental region. Based on the main effect plot, shown in Figure 1, the optimal route of each part is tabulated in the third column of Table 4. It is set at the first level for Parts 1, 2, 5, 6, 8 and 10 and at the second level for Parts 4 and 9.
A Taguchi method application for the part routing selection
403
It should be noted that this optimal configuration is not initially presented in Table 2. The interaction between parts is neglected in the present study. Sure enough, the aim of the proposed approach is to analyse the effect of each part routing in the final CF solution. Figure 1
Table 3
Effect plot for CP measure response
The ANOVA table of mean CP measure
Part type
DOF
Sum of squares
Mean square
F value
p-value prob. > F
Signification
P1
1
22.80
22.80
2.51
0.17
Not significant
P2
1
13.87
13.87
1.52
0.27
Not significant
P4
1
10.72
10.72
1.18
0.32
Not significant
P5
3
171.91
57.30
6.30
0.04
Significant
P6
1
6.63
6.63
0.73
0.43
Not significant
P8
1
107.64
107.64
11.83
0.02
Significant
P9
1
1.89
1.89
0.21
0.66
Not significant
P10
1
13.87
13.87
1.52
0.27
Not significant
Residual error
5
45.51
9.10
Total
15
404
W. Hachicha et al.
3.3 Analysing and examining result (ANOVA) The purpose of the ANOVA is to investigate which parts do significantly affect the quality characteristic (i.e., CP measure). In this work, ANOVA is used as a sensitivity analysis to determine the alternative parts effects. ANOVA analysis for estimating the error variance for each part effect and the variance of the prediction error is given in Table 3. There is a statistical test, which is called F value test for determining the significant factors. F value is a test for comparing model variance with residual (error) variance. When the variances are close to each other, the parts have a significant effect on the CP response. F value is calculated by term mean square divided by residual mean square. ‘Prob > F’ is the probability of seeing the observed F value if the null hypothesis is true (there is no part effect). If the ‘Prob > F’ value is very small (less than 5%) then the individual terms in the model have a significant effect on the response. Precision of a parameter estimate is based on the number of independent samples of information, which can be determined by degree-of-freedom (DOF). The DOF equals to the number of experiments minus the number of additional parameters estimated for that calculation. The sum of squares values due to various parts, tabulated in the third column of Table 3, are a measure of the relative importance of the factors in changing the values of recovery. The mean square for a factor is computed by dividing the sum of squares by the DOF. The ANOVA indicates that for the CF solution performance measure of the case study, Parts P5 and P8 are the most significant and consequently, the most sensitivity effect to the CF final solution. The others Parts P9, P6, P4, P2, P10 and P1 have insignificant effect on the CP measure. Table 4 Line
Final proposed solution Part
Route
M2
M5
M6
1
P1
R11
1
1
1
3
P2
R21
1
1
1
M1
M3
M4 1
7
P4
R42
1
0
1
1
15
P8
R81
1
1
1
1
18
P9
R92
1
1
1
5
P3
R30
8
P5
R51
12
P6
R61
1 1
0
1
1
1
1
0
0
1
14
P7
R70
1
1
0
19
P10
R101
0
1
1
The final step is to confirm the validity of the CP measure using the optimal route selection of each part. The confirmation experiments present CP equal to 82.1, which is higher than Table 2 results. Comparing the result in Table 4 with the result in Table 5, it is noted that the proposed Taguchi method application has provided a better solution than Kusiak’s solution. Sure enough, the proposed solution presents only four exceptional elements and six voids elements while final Kusiak’s solution provides six exceptional elements and eight voids elements. It should be noted that both proposed solution and Kusiak’s solution gives same cells configuration: cell 1 consists of machines 2, 5 and 6
A Taguchi method application for the part routing selection
405
while cell 2 consists of machines 1, 3 and 4. In addition, cell 1 contains Parts 1, 2, 4, 8 and 9 while cell 2 contains Parts 3, 5, 6, 7 and 10. Table 5
Final Kusiak solution
Line
Part
Route
M2
M5
M6
1
P1
R11
1
1
1
4
P2
R22
1
0
1
1
7
P4
R42
1
0
1
1
16
P8
R82
1
0
1
17
P9
R91
1
0
1
5
P3
R30
1
0
1
8
P5
R51
1
1
1
13
P6
R62
0
0
1
14
P7
R70
1
1
0
19
P10
R101
0
1
1
4
1
M1
M3
1
M4
1 1
Conclusions
In this study, we have used the Taguchi method as an optimisation technique in CMSs design. The objective is to solve the route selection problem for the CF with alternative routings. Furthermore, mean effect analysis and ANOVA can provide a sensitivity analysis, which is completely ignored in previous CF approach. The present approach can be applied to other problems that include large number of machines, parts and routings. Proving the effectiveness and the efficiencies of the proposed approach is our interesting research perspective.
References Albadawi, Z., Bashir, H.A. and Chen, M. (2005) ‘A mathematical approach for the formation of manufacturing cell’, Computers and Industrial Engineering, Vol. 48, pp.3–21. Caux, C., Bruniaux, R. and Pierreval, H. (2000) ‘Cell formation with alternative process plans and machine capacity constraints: a new combined approach’, Int. J. of Production Economics, Vol. 64, pp.279–284. Gupta, T. (1993) ‘Design of manufacturing cells for flexible environment considering alternative routings’, Int. J. of Production Research, Vol. 31, No. 6, pp.1259–1273. Hachicha, W., Masmoudi, F. and Haddar, M. (2006) ‘A correlation analysis approach of cell formation in cellular manufacturing system with incorporated production data’, Int. J. of Manufacturing Research, Vol. 1, No. 3, pp.332–353. Hachicha, W., Masmoudi, F. and Haddar, M. (2008a) ‘Formation of machine groups and part families in cellular manufacturing systems using a correlation analysis approach’, Int. J. of Advanced Manufacturing Technology, Vol. 36, Nos. 11–12, pp.1157–1169. Hachicha, W., Masmoudi, F. and Haddar, M. (2008b) ‘Combining axiomatic design and designed experiments for cellular manufacturing systems design framework’, Int. J. of Agile Systems and Management, Vol. 3, Nos. 3/4, pp.306–319. Hwang, H. and Ree, P. (1996) ‘Routes selection for the cell formation problem with alternative part process plans’, Computers and Industrial Engineering, Vol. 30, No. 3, pp.423–431.
406
W. Hachicha et al.
Kusiak, A. (1987) ‘The generalized group technology concept’, Int. J. of Production Research, Vol. 25, pp.561–569. Montgomery, D.C. (Ed.) (1991) Design and Analysis of Experiments, John Wily, New York Nagi, R., Harhalakis, G. and Proth, J. (1990) ‘Multiple routings and capacity considerations in group technology applications’, Int. J. of Production Research, Vol. 28, No. 12, pp.2243–2257. Sankaran, S. and Kasilingam, R. (1990) ‘An integrated approach to cell formation and part routing in group technology manufacturing system’, Engineering Optimization, Vol. 16, pp.235–245. Shambu, G. (1996) ‘Performance evaluation of cellular manufacturing systems: a taxonomy and review of research’, Int. J. of Operations & Production Management, Vol. 8, pp.81–103. Selim, H., Askin, R. and Vakharia, A.J. (1998) ‘Cell formation in group technology: review, evaluation and directions for future research’, Computers & Industrial engineering, Vol. 34, pp.3–20. Taguchi, G. (1987) System of Experimental Design, Unipub/Kraus, International Publication. Taguchi, G. (1993) Taguchi on Robust Technology Development Methods, pp.1–40, ASME Press, New York. Wemmerlov, U. and Hyer, N.L. (1986) ‘The part family and machine group identification problem in cellular manufacturing’, Journal of Operation Management, Vol. 6, pp.125–147.