06], the taxonomy by Ahn et al. [APS13] collects and structures ...... erico, Jessie Kennedy, Natalie Kerracher, Thorsten May,. Silvia Miksch, Chris Muelder, Helen ...
Volume xx (200y), Number z, pp. 1–28
A Taxonomy and Survey of Dynamic Graph Visualization Fabian Beck1 , Michael Burch1 , Stephan Diehl2 , and Daniel Weiskopf1 1 VISUS,
University of Stuttgart, Germany of Trier, Germany
2 University
Dynamic Graph Visualization Techniques
hybrid
animation
timeline +
+ general-purpose layout
special-purpose layout
matrix
node-link
+
matrix
hybrid
list
? online
offline
transition
compound
other
hybrid: combinations of direct subcategories exist
juxtaposed
superimposed
integrated
intra-cell # published techniques
layered 1-10
11-20
> 20
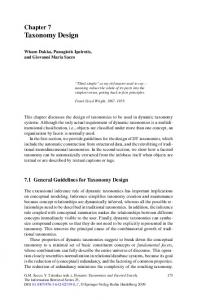
Figure 1: Illustrated hierarchical taxonomy of dynamic graph visualization techniques; the number of published techniques per taxonomic category is encoded in the brightness of the background (for details see Table 4 and Table 5). Abstract Dynamic graph visualization focuses on the challenge of representing the evolution of relationships between entities in readable, scalable, and effective diagrams. This work surveys the growing number of approaches in this discipline. We derive a hierarchical taxonomy of techniques by systematically categorizing and tagging publications. While static graph visualizations are often divided into node-link and matrix representations, we identify the representation of time as the major distinguishing feature for dynamic graph visualizations: either graphs are represented as animated diagrams or as static charts based on a timeline. Evaluations of animated approaches focus on dynamic stability for preserving the viewer’s mental map or, in general, compare animated diagrams to timeline-based ones. A bibliographic analysis provides insights into the organization and development of the field and its community. Finally, we identify and discuss challenges for future research. We also provide feedback from experts, collected with a questionnaire, which gives a broad perspective of these challenges and the current state of the field. Categories and Subject Descriptors (according to ACM CCS): H.5.2 [Information Interfaces and Presentation]: User Interfaces—Graphical user interfaces (GUI)
1. Introduction The world is constantly evolving, there is nothing static or stable in it. But sometimes we pretend there is—just for simplification. In particular when analyzing data, this constraint is often applied: either we choose a single point in time or we aggregate longer spans of time. And indeed, the simplification is very helpful as it reduces the amount of data, makes computations faster, and simplifies reasoning as well as communication. However, this approach has its clear limitations: we learn nothing about the dynamics. As a consequence, we submitted to COMPUTER GRAPHICS Forum (11/2015).
neither understand how and why certain stages are reached nor can foresee future changes. Many aspects of the analog and digital world can be considered as objects being related to each other, for instance, people forming a social network, proteins interacting with each other, or components of a software system communicating through calls. We usually model relational data as graphs and a very active research community has formed around visualizing these structures: many visualization techniques have been introduced [vLKS∗ 11], criteria for read-
2
F. Beck, M. Burch, S. Diehl & D. Weiskopf / A Taxonomy and Survey of Dynamic Graph Visualization
a c
b
a
e
d force-directed
Figure 2: Yearly number of publications on dynamic graph visualization according to our literature database; light gray bars indicate the total number of publications, colored bars distinguish the publications by type.
able graph visualization have been studied [BRSG07]. And in fact, in most cases, the above simplification has been applied, visualizing static graphs only. However, over the years, researchers started to question this constraint and began thinking about the visualization of dynamic graphs— relations between objects that change over time, as it is natural in the real world. Starting in the 1990s with the problem of editing a static graph and visualizing the changes [ELMS91, MELS95], the field was first understood as a subproblem of graph drawing: node-link diagrams need to be animated without destroying the user’s mental image of the diagram, the so-called mental map, which is related to the concept of cognitive maps in other disciplines [Kit94]. After the millennium, with the availability of more and more time-varying datasets, dynamic graph diagrams were discovered as an information visualization technique. Approaches became specialized to various application scenarios such as social network analysis or software engineering. Alternatives to animated nodelink diagrams were introduced that plot the graph onto timelines. By 2010, the visualization of dynamic graphs was established as a standard visualization discipline. In consequence, the number of publications more than doubled from not more than 5 publications per year before 2006 to about 20 yearly publications since 2012 (Figure 2): evaluations were conducted comparing different techniques and exploring the role of the mental map, application areas were studied in greater detail, and still many new techniques and novel combinations of existing techniques were suggested. Visualizing dynamic graphs, hence, has become itself a very active and diverse research discipline involving several communities. What is missing so far, however, is a comprehensive survey of the area, structuring and discussing the variety of approaches and insights. This paper is intended to fill this gap as it reports the state of the art in visualizing dynamic graphs. We give a brief introduction to the field (Section 2) and provide central definitions (Section 3). Based on a systematic literature search and categorization (Section 4), we build a hierarchical taxonomy of dynamic graph visualization and classify existing techniques into the taxonomy (Section 5); an illustrating rep-
a b c d e
a
b
e
d
e
c
d
c
b
orthogonal
hierarchical
a b c d e matrix
Figure 3: Different visual representations of static graphs as node-link or matrix diagrams all showing the same dataset.
resentation of the taxonomy is provided in Figure 1. We also discuss evaluation results (Section 6) and applications for dynamic graph visualization approaches (Section 7). A bibliographic analysis of the collected publications reveals key topics and emerging trends (Section 8). This systematic review finally allows us to identify challenges for future research (Section 9). We provide feedback from the research community, based on questionnaires of experts in the field (Section 10). Note that this is an extended version of a EuroVis 2014 State-of-the-Art Report [BBDW14]. This version adds an updated literature database and taxonomy, a bibliographic analysis (Section 8) and a discussion of the challenges and the current state of the field based on expert feedback (Section 10). 2. Background Graphs in general form one of the most important data models in computer science because many problems and domains can be modeled as graph structures. Just to name a few, there are automata in theoretical computer science, flow networks such as pipes and roads, digital and non-digital social networks, computer networks such as the Internet, networks of companies and financial transactions, chemical reaction chains and molecular interactions, epidemic spreads of diseases in communities, or correlations of controlled variables in experiments. In most of those applications, temporal development can be observed and needs to be considered to fully understand the respective problem. Visualization is a particular means for exploratively comprehending and analyzing this data. A graph consists of objects or entities, usually referred to as vertices, and relationships between them, called edges. Representing graphs as node-link diagrams, where vertices are drawn as visual nodes that are connected by graphical links representing the edges, has a long tradition. While the drawing first served illustration purposes only, gradually, layout algorithms were developed that allow one to automatically generate readable graph diagrams, for instance, force-directed layouts, which simulate physical forces between nodes, orthogonal layouts, where edges are plotted only along horizontal and vertical axes, or hierarchical layouts, which divide the graph into layers (Figure 3). As an independent field, graph drawing arose in the 1990s with the Symposium on Graph Drawing, which was held in its submitted to COMPUTER GRAPHICS Forum (11/2015).
F. Beck, M. Burch, S. Diehl & D. Weiskopf / A Taxonomy and Survey of Dynamic Graph Visualization G1
G2
a
b
e
c
d t1
G3
a
b
e
c
d t2
Table 1: Examples of types of graphs that can be used for extending the basic definition of dynamic graphs.
a
b
e
c
d t3
graph
Gi :=
(un)directed
(Vi , Ei ) where Ei ⊆ Vi ×Vi is either interpreted as directed or undirected
weighted compound
Figure 4: Illustrating example of juxtaposed node-link diagrams on a timeline with constant node positions visualizing a directed graph with five vertices over three time steps.
22nd edition in 2014. With an increasing interest in information visualization, also alternative visual representations of graphs have been introduced such as adjacency matrices (Figure 3). In such a matrix visualization, vertices are depicted as rows and columns of the matrix; colored cells of the matrix indicate whether two vertices are connected by an edge. The characteristic difference of a dynamic graph to a static graph is that the structure of the vertices and edges can change over time. Figure 4 shows an illustrating example of a dynamic graph and its visualization: a directed graph consisting of five nodes is visualized over three time steps as juxtaposed node-link diagrams. The position of the nodes is the same for all diagrams, which makes it easier to track the nodes over time. For instance, we see an edge from node a to node e in the first time step (t1 ), which disappears in the second (t2 ) but reappears in the third (t3 ). This small example should just give a first impression of a straightforward visualization of a dynamic graph—there exist much more sophisticated approaches as discussed in this survey. Other publications have already partly reviewed the field of visualizing dynamic graphs. In 2001, Branke [Bra01] summarized the first animated node-link approaches “in a very early stage” of “dynamic and interactive graph drawing”. In 2007, still focusing on animated node-link diagrams, Shannon and Quigley [SQ07] survey the field and conclude that “the issues unique to dynamic graphs are beginning to be uncovered in more depth”. Since then, various user studies have considered the importance of preserving the mental map (i.e., the internal representation the user forms while watching animated node-link diagrams), or the difference between animated views and representations based on timeline views, such as those by Archambault and Purchase [AP13a, AP14]. Further, Windhager et al. [WZF11] discuss dynamic graph visualization from the applicationspecific perspective of organizational change in business networks. A brief review of dynamic graph visualization is also part of surveys of larger fields such as visualizing large graphs [vLKS∗ 11], force-directed layouts of node-link diagrams [Kob13], space-time cube visualizations [BDA∗ 14], and group structures in graphs [VBW15]. Recently, Arsubmitted to COMPUTER GRAPHICS Forum (11/2015).
3
multivariate
(Vi , E i ) : E i ⊆ Vi × R+ ×Vi (Vi , Ei , EiT ) : EiT hierarchy edges forming a tree (Vi , Ei , ρ) : Ei = (E i,1 , . . . , E i,k ) list of sets of weighted edges and function ρ retrieves a multidimensional attribute vector for each v ∈ Vi
chambault et al. [AAK∗ 14] have given an overview of temporal multivariate graphs concentrating on node-link diagrams and surveying applications in software engineering in closer detail. Also, Zaidi [ZMS14] summarize parts of the state of the art concerning node-link diagrams. Kerracher et al. [KKC14] systematically describe the design space of dynamic graph visualizations. Hadlak et al. [HSS15] unify taxonomies for multi-faceted graph visualization, where time can be one of multiple facets, introducing an overarching framework to classify graph visualization techniques. 3. Dynamic Graph Data Before starting to survey existing approaches, we need to clarify what data should be analyzed, what characteristics this data typically has, and what tasks are of interest for it. 3.1. Data Model To define a dynamic graph, we first introduce a (static) graph G := (V, E), which models a set of objects V , called vertices, and their relationships E ⊆ V ×V , called edges. Then, a dynamic graph is defined as a sequence Γ := (G1 , G2 , . . . , Gn ) where Gi := (Vi , Ei ) are static graphs and indices refer to a sequence of time steps τ := (t1 ,t2 , . . . ,tn ). This basic definition can be interpreted and extended in different ways (Table 1 gives an overview): For instance, in a directed graph, e1 = (v, w) and e2 = (w, v) represent different relationships, whereas they are interpreted as the same relationship in an undirected graph. A weighted graph assigns a numeric attribute, called weight, to each edge. In graph theory, a network is a directed weighted graph, but overall, the term network is not used consistently in literature; for instance, a social network not always refers to a directed weighted graph. Further, a compound graph adds a hierarchical structure to the vertices, often used for interactively simplifying the graph by collapsing hierarchy vertices. The hierarchy can be considered as static over time as well as it might change together with the graph structure. Other forms of node aggregation exist, for instance, overlapping sets, which
4
F. Beck, M. Burch, S. Diehl & D. Weiskopf / A Taxonomy and Survey of Dynamic Graph Visualization
is further discussed by Vehlow et al. [VBW15]. In a multivariate dynamic graph, we have several attributes of edges or vertices that change over time. Moreover, applicationspecific extensions are possible but cannot be listed all. Of course, different extensions might be combined, for example, creating a dynamic weighted directed compound graph. A general survey of such extensions, called facets, and their visual representation is provided by Hadlak et al. [HSS15]. Please note that, similar to most of the approaches referenced in this survey, the above data model considers time as being discrete, but ordinal and continuous time scales [AMST11] can be represented indirectly: ordinal values could be mapped to virtual points on a discrete time scale; continuous processes that might form the basis of a dynamic graph need to be sampled to be represented in our data model. We also do not discern between instants and intervals [AMST11]: whether Gi is a snapshot at instant ti or aggregates an interval around ti . Often, it is not specified by the visualization technique which of the two models apply and rather depends on application domain and context. Archambault et al. [AAK∗ 14] discuss the modeling and representation of time for dynamic graphs in greater detail.
3.2. Graph Characteristics The goal of analyzing graph data is to retrieve characteristic properties of its structure and attributes. These can be, for instance, topological properties that apply to the graph as a whole, such as that the graph is planar (i.e., can be drawn as a 2D node-link diagram without any edge crossings), is sparse or dense (i.e., has few or many edges in relation to the possible number of edges), is acyclic (i.e., there is no cyclic path in a directed graph), is bipartite (i.e., the vertices fall into two sets, edges connecting only vertices from two different sets), etc. Also, individual properties of vertices and edges can be investigated such as retrieving all neighbors of a vertex, finding the shortest path between two vertices, or identifying clusters of vertices connected by many edges. These characteristics, however, only describe properties of static graphs. They are applicable to each graph individually in the sequence of graphs, but there exist additional dynamic properties [BBD13]. A particularly important one is dynamic variance, which quantifies how much the graph structure changes from one time step to the next. Other properties are, for instance, whether the graph is only growing or shrinking, whether there are any trends in the evolution of vertex degrees or edge weights, or whether clusters or paths are preserved over time. Which of the properties are of interest, however, highly depends on the application the graph structure is used for. Typical graph analysis tasks are described elsewhere, for static graphs [LPP∗ 06] and specialized for dynamic graphs [APS13, AP13a, BPF14a, KKC15].
4. Scope and Methodology In order to retrieve a complete and structured list of references that forms the basis of this survey, we followed a systematic approach: we precisely defined the scope of the survey and retrieved relevant publications within that scope by manually searching through the relevant journals and conference proceedings as well as by following references of already retrieved publications. Through tagging, we then structured the retrieved literature. 4.1. Scope The specific scope of this survey is visualizing dynamic graph structures as defined in Section 3.1. Some other visualization problems are specializations of the dynamic graph visualization problem or can be modeled as such, for instance, the visualization of static graphs, the comparison of two graphs, the visualization or comparison of hierarchies, or the visualization of time series. Although dynamic graph visualization techniques can be used to display such data, there are more specialized (usually, much more suitable) visualization techniques for these problems. Hence, we consider these specializations of the problem as out of scope for this survey. We also do not take into account approaches that first aggregate the dynamic graph (e.g., by using statistics or clustering) and then only visualize the simplified result, because the dynamic graph cannot be retrieved anymore from the displayed information. Moreover, there are theories and methods related to either dynamic graphs or visualization, which we cannot include into this survey: graph theory, graph algorithms, visualization theory, interaction theory, perception, etc. We focus only on those aspects of those related fields that were directly applied to dynamic graph visualization. 4.2. Data Collection Collecting the relevant publications for this survey, we started with a selection of papers that we knew from own previous research. We further manually scanned through all issues and proceedings of the main information visualization and graph drawing journals and conferences: • Journals – – – –
Computer Graphics Forum IEEE Transactions on Visualization and Computer Graphics Information Visualization Journal of Graph Algorithms and Applications
• Conferences – IEEE Pacific Visualization Symposium (PacificVis) [2001– 2004: InVis.au; 2005–2007: APVIS] – IEEE Symposium on Information Visualization (InfoVis) [since 2006 a special issue of IEEE Transactions on Visualization and Computer Graphics] – International Conference on Information Visualisation (IV) submitted to COMPUTER GRAPHICS Forum (11/2015).
F. Beck, M. Burch, S. Diehl & D. Weiskopf / A Taxonomy and Survey of Dynamic Graph Visualization –
–
Joint Eurographics–IEEE VGTC Symposium on Visualization (EuroVis) [1999–2004: VisSym; since 2008 a special issue of Computer Graphics Forum] Symposium on Graph Drawing (GD)
We followed citations in both directions: we checked the list of references in the paper to find older works and investigated citations of the paper using Google Scholar. Moreover, we checked all papers suggested by the experts who participated in our email survey (Section 10). Among those papers in scope of this survey, we only inserted by default peer-reviewed full papers published in journals and conferences written in English. If other criteria indicated certain impact and quality (e.g., high number of citations, remarkable contribution), we occasionally added papers not fulfilling all conditions.
4.3. Data Analysis We applied tagging as the main instrument to structure the literature for this survey. Using tags instead of categorical dimensions provides the advantage that the publications can be assigned to multiple tags rather than just to one category per dimension. Categorical dimensions, however, better group the characteristics of an approach while tags are usually unstructured. Hence, we additionally defined tag categories (i.e., groups of tags belonging to the same dimension) for parts of the tags to also integrate this advantage into our tagging approach. In particular, we assigned a list of tags to each collected publication. We discussed the tags among the authors and defined the meaning of each tag in a short description. We further grouped important tags describing characteristics of similar kind into named categories. To systematically derive the list of tags and assign these to the publication, we used a process with three stages: 1. Explorative Tagging: We selected a small, arbitrary part of the collected publications and freely assigned reasonable tags. After analyzing some publications, we started to consolidate the tags by merging similar ones. Moreover, we built categories from tags describing the same dimension of characteristics. We continued with this tagging phase until we reached a stable list of central tags and categories. 2. Category Tagging: We then systematically classified all publications with respect to the tag categories. Each publication was assigned to at least one tag per category. Also some uncategorized or new tags were occasionally assigned during this process. 3. Supplementary Tagging: The final stage of the tagging was to analyze and compare groups of similar publications in detail. To systematically derive those groups sharing similar important characteristics, we restricted the bibliography by category tags assigned in the previous stage and combinations thereof. Group-specific supplementary tags were also identified. submitted to COMPUTER GRAPHICS Forum (11/2015).
5
For this version of our survey we updated our literature review, repeating the collection and analysis process to identify additional papers published since the conference version; 33 new references were added to the literature collection. 4.4. Literature Dataset The dataset we retrieved following the described methodology consists of 162 publications from 1992 to 2015. Five categories of tags have been identified in the tagging process: the general type of the publication, the visual representation of time, the visualization paradigm used for depicting the graph structure, the kind of evaluation performed, and the application addressed. We assigned at least one tag per category and usually a number of other tags to each publication. Figure 5 summarizes the result of the tagging process as a tag cloud, where the frequency of each tag is indicated by a subscript number and encoded in the font size. Additional to this quantified list of tags, Table 2 provides the descriptions of categories and included tags. In particular, the category tags formed the basis to derive a taxonomy of graph visualization techniques and to structure this survey. The complete dataset including all details and tags for each of the publication is available through an interactive Web tool† . The type of the publication forms one of the main features to discriminate the collected publications. Technique papers describing novel visualization approaches form the set of most important publications for this survey. All publications classified as such are described individually in this survey and classified into the taxonomy of visualization techniques (Section 5). We also systematically discuss all publications describing an evaluation of dynamic graph visualization techniques (Section 6). We further give an overview of applications of dynamic graph visualizations, however, not claiming completeness in this area (Section 7). Finally, the tagging allows us to conduct a bibliographic analysis of the collected set of publications (Section 8). 5. Taxonomy and Classification of Dynamic Graph Visualization Techniques Many different visualization techniques have been introduced for dynamic graph structures. In particular, we collected and classified 69 publications as technique papers. To provide a systematic overview of these techniques, we categorize the approaches according to a taxonomy. The taxonomy we developed for this purpose is structured hierarchically and consists of three layers, the first referenced with Roman numbers, the second with small letters in alphabetic order, and the third with Arabic numbers. While a first illustration of the taxonomy has been already presented in Figure 1, Table 4 and Table 5 provide a detailed description of †
http://go.visus.uni-stuttgart.de/dynamicgraphs
6
F. Beck, M. Burch, S. Diehl & D. Weiskopf / A Taxonomy and Survey of Dynamic Graph Visualization
Figure 5: Tag cloud of manually assigned tags grouped by category summarizing all publications of our database; subscript numbers and font sizes refer to the usage frequency of the tags.
Table 2: Categories and contained tags with descriptions. tag (category)
description
type application
type of the paper applying dynamic graph visualization to a specific application scenario empirical, algorithmic, or theoretical evaluation of visualization approaches novel visualization technique or system visual representation of time mapping time to time in an animation mapping time to space onto a timeline being applicable to all representations of time graph visualization paradigm representing the graph as a visual adjacency list representing the graph as nodes connected by links representing the graph as a visual adjacency matrix being applicable to all graph representations kind of evaluation testing the presented approach algorithmically or using metrics discussing a small number of application examples assessing the approach through external domain or visualization experts no specific evaluation provided specially broad survey of related work theoretical considerations such as proof or runtime complexity conducting a study involving other users area of application bioinformatics data such as protein interactions or metabolic pathways business- or economy-related data such as financial transactions, stock market, business processes document collections, bibliometrics, and information retrieved from texts data recorded during eye-tracking experiments geographic data with spatial context infrastructure networks such as computer, communication, power, or road networks data related to movies, TV, music, news and the like social networks, social media, and other data from social life information related to software such as components, source code, developers, documentation, etc. sports-related data such as performance data or results no specific application suggested
evaluation technique time animation timeline generic paradigm list node-link matrix generic evaluation algorithmic case_study expert none survey theoretical user_study application biology business document eye_tracking geo infrastructure media social software_engineering sports generic
its categories, their hierarchical structure, and the classification of techniques. This section describes all techniques and thereby follows as well the hierarchical structure of the taxonomy and employs the taxonomic categories as headlines. Additional to conceptional sketches of some of the presented approaches, small icons are used to illustrate and symbolize the categories of the taxonomy.
Please note that the taxonomy is pragmatically structuring existing techniques rather than exploring all possible concepts. Hence, combinations of concepts are not reflected if we have not found any example in the literature. This, however, only reflects the current state of the art and does not imply that a specific compound would be impossible or useless—the taxonomy might need to be extended through additional categories in the future. In fact, for this extended version of the original publication [BBDW14], we already extended the taxonomy by two categories: I.c. Animated Matrix and II.c. List-Based Approaches. The specific mapping between tags and taxonomy categories can be retrieved from Table 3. The criteria to substructure the taxonomy are chosen from diverse categories of tags considering that a visualization technique cannot only be described through the employed visual mapping but as well through the requirements on data and algorithms. Each category inherits the properties of the parent category (cf. Table 3). Hybrid categories are inserted whenever a technique combines multiple basic categories—the position of the hybrid category is determined by the first common ancestor of the basic categories within the hierarchical taxonomy. Hence, a hybrid category always unites characteristic from at least two sibling taxonomy categories. All combinations of tags can be explored through the provided literature database. submitted to COMPUTER GRAPHICS Forum (11/2015).
7
F. Beck, M. Burch, S. Diehl & D. Weiskopf / A Taxonomy and Survey of Dynamic Graph Visualization
Table 3: Mapping between tags and taxonomy categories (� required; � optional).
time animation timeline paradigm node-link matrix list other compound_graph general-purpose_layout integrated_node-link intra-cell_timelines juxtaposed_node-link layered_matrices offline_problem online_problem special-purpose_layout superimposed_node-link transition_problem
I.
I.a.
I.a.1.
I.a.2.
I.a.3.
I.b.
I.b.1.
I.b.2.
I.c.
II.
II.a.
II.a.1.
II.a.2
II.a.3.
II.a.4.
II.b.
II.b.1.
II.b.2.
II.c.
III.
� ·
� ·
� ·
� ·
� ·
� ·
� ·
� ·
� ·
· �
· �
· �
· �
· �
· �
· �
· �
· �
· �
� �
� � ·
� · ·
� · ·
� · ·
� · ·
� · ·
� · ·
� · ·
· � ·
� � �
� · ·
� · ·
� · ·
� · ·
� · ·
· � ·
· � ·
· � ·
· · �
� � �
� � · · · · � � � · �
� � · · · · � � · · �
� � · · · · · � · · ·
� � · · · · � · · · ·
� � · · · · � � · · �
� · · · · · � � � · �
� · · · · · � � � · �
· · · · · · � � � · �
� � · · · · � � · · �
� � � � � � · · · � ·
� � � · � · · · · � ·
� � · · � · · · · · ·
� � · · · · · · · � ·
� � � · · · · · · · ·
� � � · � · · · · � ·
� � · � · � · · · · ·
� � · � · · · · · · ·
� � · · · � · · · · ·
� � · · · · · · · · ·
� � � � � � � � � � �
Two basic ways of visualizing a graph structure are nodelink diagrams and adjacency matrices. As already illustrated in Figure 3, node-link diagrams represent vertices as graphical nodes that are connected by links; in a matrix, vertices are mapped to rows and columns of the matrix and a colored cell at an intersection of a row and column encodes an edge. While this would be one of the most important criteria to discern static graph visualizations, the time dimension adds another central aspect to the visualization when considering dynamic graphs. As Beck et al. [BBD09, BBD13] already discussed in this context, the time dimension can be mapped in an animation to a simulated time (time-to-time mapping) or to a space dimension of the generated visualization representing a timeline (time-to-space mapping). Other mappings would be possible—for instance, a mapping of time to color—but are rarely applied as an independent visualization approach. What can be found, however, are hybrid techniques that combine animation with timeline representations. Hence, the first level of the taxonomy divides the approaches into animation, timeline, and hybrid techniques. After introducing our taxonomy we compare it to a related taxonomy of the design space of dynamic graph visualizations by Kerracher et al. [KKC14], which was published concurrently with the previous version of this paper.
I. Animation (Time-To-Time Mapping) A mapping of the timestamps assigned to the sequence of graphs to visualization time results in an animated representation. Combining this straightforward mapping with node-link diagrams creates a quite intuitive dynamic graph visualization: animated node-link diagrams. This taxonomy category originally referred only to node-link approaches, but we also consider matrix approaches in this extended version. In nearly all approaches, the mental map submitted to COMPUTER GRAPHICS Forum (11/2015).
is discussed. The term refers to the abstract structural information a user forms by looking at the layout of a graph. In the context of dynamic graph drawing, changes to this map should be minimal, in other words algorithms to draw sequences of graphs should preserve the mental map. To this end, the position of nodes is tried to be kept stable, which is called dynamic stability or drawing stability. This section is subdivided into general-purpose layouts and specialpurpose layouts because having a specialized graph type, such as a compound graph, changes the layout problem of node-link diagrams reasonably. Actually, specialized layouts such as for planar or acyclic graphs had been discussed before techniques for the drawing of general dynamic graphs were introduced. I.a. General-Purpose Layout General-purpose layouts do not impose any requirements on the type of graph (cf. Table 1). They can be discerned, however, by whether they compute the individual node-link layouts of the animation only by considering past time steps (online) or both, past and future time steps (offline). In general, online approaches are more flexible as they are also applicable to scenarios where the complete evolution of the graph is not yet known when starting the animation (e.g., for interactively changed graphs or real-time monitoring). On the other hand, offline approaches allow for better optimizing the layout and maintaining the mental map because next changes are known. Other approaches are quite independent from the online–offline problem, but look in closer detail at the animated transition period between two consecutive layouts. I.a.1. Online Problem The online layout problem first came up when interacting with static graphs: in particular, when showing only a subset of nodes and links or
?
8
F. Beck, M. Burch, S. Diehl & D. Weiskopf / A Taxonomy and Survey of Dynamic Graph Visualization
Table 4: Hierarchical taxonomy of dynamic graph visualization techniques (part 1 of 2). Taxonomic Category
Illustration
#
I. Animation (Time-to-Time Mapping)
35
I.a. General-Purpose Layout
I.a.1. Online Problem
Techniques
22
7
layout adjustment to avoid overlap [MELS95] framework based on Bayesian decision theory [BW97] simulated annealing with customizable weights for optimization criteria [LLY06] efficient algorithm and GPU implementation [FT08b] consider age of nodes to stabilize the layout [GdBG12] more efficient initial positions of nodes [HMHU13] filtering of large streamed graphs [GAM14]
I.a.2. Offline Problem
7
Foresighted Layout (with Tolerance) [DGK01, DG02, GBPD05] GraphAEL: force-directed layout with virtual forces between time steps [EHK∗ 04b, FKN∗ 05] Visone: force-directed layout with additional energy factors between time steps [BS08] user-selected multiple foci [FWSL12]
I.a.3. Transition Problem
8
stepwise animation for navigation based on a spring algorithm [HEW98] Marey : stepwise animation moving (parts of) the graph together [FE01, FE02, FH02, NF02] VisuGraph: using super-graph as intermediate step [LD08] transitions of bundled edges [HEF∗ 13] GraphDiaries: highlight changes in staged transitions [BPF14a]
I.b. Special-Purpose Layout
?
12
I.b.1. Compound Graphs
8
force-directed approach preserving the position of clusters [FT04] nested bubbles in 3D [KG06] XLDN: extending Foresighted Layout with Tolerance to dynamic compound graphs [PB08] focused animation collapsing constant parts of the hierarchy [RPD09] ContexTour : smooth contours of colored clusters [LSCL10] Space-filling maps of colored clusters [MKH12, HKV12] degree-of-interest functions for abstracting and focusing large graphs [AHSS13]
I.b.2. Other
4
online drawing of planar graphs [CDBT∗ 92, CDBTT95] DynaDAG: acyclic graphs based on hierarchical layout [Nor96] stable layout of small world graphs [BFP06]
I.c. Animated Matrix
1
editing a graph, interactions lead to changes in the graph structure that should be displayed—hence, a sequence of graphs is visualized without knowing the full sequence from the beginning. Misue et al. [MELS95] introduce the first layout adaption approach for general graphs, which addresses the problem of graph editing and node overlap: in order to preserve the mental map, their force-directed approach maintains the original horizontal and vertical ordering of nodes while reducing overlap; the initial layout, however, is not computed by the approach. Brandes and Wagner [BW97] discuss an abstract framework based on Bayesian decision theory that describes the problem as a twofold model: a readability model of the individual graphs and a stability model considering distances between the individual layouts and their predecessors. Basically, by multiplying quality factors from both models and optimizing the resulting functions, they derive a dynamic graph layout, which is implemented for a force-directed and an orthogonal approach. Lee et al. [LLY06] describe online layout as an optimization problem with customizable weights for different layout criteria; they apply simulated annealing for deriving a lay-
AniMatrix: staged animated transitions between matrices [RM14]
out solution. Gorochowski et al. [GdBG12] suggest to use the concept of node age to preserve specifically the layout of old and stable graph structures. By introducing an efficient force-directed online layout algorithm and implementing it on the GPU, Frishman and Tal [FT08b] present a particularly fast layout approach. Also addressing efficiency, Hayashi et al. [HMHU13] investigate the effects of initial node placement on the responsiveness of a layout algorithm. Grabowicz et al. [GAM14] present an approach to filter streams of changes in large graphs to a manageable size. I.a.2. Offline Problem When a graph structure does not change through interactive editing or navigation, but through changes in the underlying domain, the full evolution is usually known at visualization time (an exception are monitoring systems). In this case, not only past but also future layouts can be considered for laying out the graphs of the time steps. This simplifies the layout problem and makes easier solutions applicable, the most straightforward one being to aggregate the full sequence of graphs and to lay out only this so-called super-graph submitted to COMPUTER GRAPHICS Forum (11/2015).
F. Beck, M. Burch, S. Diehl & D. Weiskopf / A Taxonomy and Survey of Dynamic Graph Visualization
9
Table 5: Hierarchical taxonomy of dynamic graph visualization techniques (part 2 of 2). Taxonomic Category
Illustration
#
II. Timeline (Time-to-Space Mapping)
II.a. Node-Link
Techniques
28
19
+
II.a.1. Juxtaposed
7
TimeArcTrees: linearized nodes on vertical axes [GBD09] Parallel Edge Splatting: artificially bipartite, linearized node layout [BVB∗ 11, BBW12] nested circles: partial links in TimeSpiderTrees [BFBD10], ego centered graphs [FHQ11] overlaid Sankey diagram to show cluster evolution [VBAW14], linked storylines [AB14]
II.a.2. Superimposed
5
3D stack with fixed positions [BC03, DE02] 3D stack with relaxed positions [EKLN04, GW06] abstracting nodes and links to tubes [GHW09]
II.a.3. Integrated
5
edges as timelines for ego networks [Rei10] and general graphs [SBW15] ego network with ego node as timeline [SWW∗ 15] Extended Massive Sequence Views: event-based timeline with parallel edges [vdEHBvW13] parallel edges with attached pixel-based timeline [BMW15]
II.a.4. Hybrid (Juxt., Super., Int.)
2
juxtaposition as well as 2D and 3D superimposition [FAM∗ 11, ITK10]
II.b.1. Intra-Cell Timelines
4
time series as sparkline bar charts [BSW13, YEL10] Gestaltlines encoding three metrics in angles and line lengths [BN11] pixel-based folded timelines [SWS10]
II.b.2. Layered Matrices
4
(Layered) TimeRadarTrees: radially layered lists with radial matrix thumbnails [BD08, BHW11] radially bended and layered matrices [VBSW13] Cubix: stacked matrices to a 3D cube and sliced small multiples thereof [BPF14b]
II.b. Matrix
II.c. List
8
+
1
+
III. Hybrid (Animation, Timeline)
6
# total (together with Table 4)
69
(Figure 6)—individual layouts of the time steps are derived as a subset of the super-graph layout. However, adapting the layout gradually might be a better trade-off between preserving the mental map and individually readable layouts. Diehl et al. [DGK01] introduce Foresighted Layout, a generic framework that optimizes the straightforward supergraph approach: nodes are grouped if they are not active together and a super-graph is constructed from these grouped nodes applying an arbitrary static graph layout—due to grouping, node positions are reused if possible. Diehl and Görg [DG02] further extend this approach to Foresighted Layout with Tolerance adjusting the individual layouts derived from the super-graph within a certain level of deviation from the super-graph. The optimization of individual layouts can be realized with a force-directed algorithm [DG02], but as well with adapted algorithms for orthogonal and hierarchical layouts [GBPD05]. In GraphAEL [EHK∗ 04b, FKN∗ 05], the sequence of graphs is also aggregated but not into a super-graph: equivalent nodes are not merged but just
submitted to COMPUTER GRAPHICS Forum (11/2015).
horizontally or vertically stacked link representations on a horizontal timeline [HBW14]
in situ integration of small visualizations [HSS11] cluster evolution on a timeline for navigating animated node-link diagrams [SMM12] moving timeline and flip-book approach based on different graph approaches [BBV∗ 12,BW15] DiffAni: combinations of small multiples, difference representations, and animation [RM13] Small MultiPiles: juxtaposed piles of matrices that can be flipped through [BHRD∗ 15]
connected through virtual edges. Considering theses edges and ignoring repulsive forces of nodes from different time steps, a single run of a force-directed algorithm determines the layout of all individual graphs. This technique can be applied to 2D and 3D animations [EHK∗ 04b] or to hyperbolic and spherical spaces [FKN∗ 05]. A similar approach was implemented for Visone [BS08] by introducing additional energy factors that increase with the position distance of equivalent nodes in adjacent time steps and need to be minimized. Feng et al. [FWSL12] combine user-selected multiple foci with an offline approach: the focused nodes and their neighborhoods are enlarged. I.a.3. Transition Problem Animating a node-link diagram does not only require to determine a sequence of layouts, but also the transitions between consecutive layouts need to be modeled—for the straightforward solution of just morphing one layout into the other, too many changes may happen at the same time to be traceable by the viewer.
10
F. Beck, M. Burch, S. Diehl & D. Weiskopf / A Taxonomy and Survey of Dynamic Graph Visualization
G1
G2
a
b
e c
d t1
G3
a
+ b
e c
a
a
+ b
d t2
e c
d t3
=
b
e c
d
super-graph
Figure 6: Constructing a super-graph from a dynamic graph with three time steps; edges occurring in multiple time steps are aggregated by higher edge weights (line thickness).
Huang et al. [HEW98] adapt a force-directed method for stepwise transitions when navigating a dynamic graph: when focusing a node, it is moved first to the center (with other nodes moving relative to it), then superfluous nodes disappear and new nodes appear, before finally the new layout is optimized. In Marey [FE01, FE02], the transition period consists of four phases: first, nodes and edges are removed if necessary; then, the graph is translated towards the new layout as if it is a single object; afterwards, the individual nodes are moved independently to their new positions; and finally, the new nodes and edges are shown. This approach is further extended by detecting clusters of nodes that share similar motions and moving theses together [FH02]; Nesbitt and Friedrich [NF02] suggest to use Gestalt laws to detect and structure the motion. In VisuGraph [LD08], a super-graph layout is computed with nodes in the same time step attracted to a specific position; for the transition between two time steps, the graph is first morphed to the super-graph to recalibrate the mental map, before the super-graph is further transformed into the layout of the next time step. For graph layouts with fixed node positions, Hurter et al. [HEF∗ 13] suggest an approach for transforming edge bundling smoothly between time steps. Bach et al. [BPF14a] use staged transitions similar to Marey, but specifically highlight removed and added elements; moreover, they use thumbnail images as previews for adjacent time steps. I.b. Special-Purpose Layout Specific characteristics of the graph may require, or at least profit from, other layout approaches than the ones presented for general dynamic graphs. All different graph characteristics discussed in Section 3.2 could be considered in this context. Among these, dynamic compound graphs were addressed by many works while other characteristics have been investigated only occasionally yet. The current taxonomy category also includes online and offline approaches as well as techniques for transition between time steps; the special characteristics of the graph structure, however, discriminate the approaches more clearly.
I.b.1. Compound Graph The additional hierarchy of a compound graph, which structures the set of nodes, can also be used to structure the visualization. In particular for larger graphs, it might help to abstract from single nodes to groups of nodes and can make the visualization more scalable. If approaches use clustering algorithms for creating a hierarchy or clusters, not only layout stability but also cluster stability needs to be optimized and clusters need to be tracked across time. Frishman and Tal [FT04] introduce an online approach for clustered graphs (i.e., compound graphs with only one level of clusters) based on a force-directed algorithm: boxes are drawn around the nodes of a cluster and the positions of clusters are tried to be preserved. Kumar and Garland [KG06] draw nested bubbles around nodes for a 3D graph layout to indicate the compound structure based on a force-directed offline approach. Pohl and Birke [PB08] extend Foresighted Layout with Tolerance [DG02] to compound graphs representing the hierarchy with nested boxes. Reitz et al. [RPD09] use the hierarchy to focus the animation and collapsing those hierarchies that stay unchanged with respect to the current time step. ContexTour [LSCL10] uses smooth contours with different colors to distinguish clusters, which creates a map-like image. Taking the map metaphor further, Mashima et al. [MKH12] and Hu et al. [HKV12] generate more space-filling drawings with directly bordering ‘countries’. Abello et al. [AHSS13] discuss applying degree-of-interest functions to large graphs to highly aggregate parts of the graph while analyzing other parts in detail. I.b.2. Other Dynamic graphs might have diverse characteristics that can be specifically considered for the layout. Actually, the publication that we regard as the first dynamic graph visualization according to the definitions and scope provided in Section 3.1 and Section 4.1 is specialized for variants of planar graphs: Cohen et al. published it as a technical report in 1992 [CDBT∗ 92] and extended it as journal article in 1995 [CDBTT95]. They present a framework for drawing the graphs that warrants the planarity of the visual embedding. For acyclic graphs, DynaDAG [Nor96] extends the Sugiyama layout [STT81] for hierarchical drawings trying to preserve the mental map. Brandes et al. [BFP06] focus on drawing small-world graphs (i.e., graphs with short minimal distances between arbitrary nodes) and introduce a stable layout algorithm. I.c. Animated Matrix While possible in theory, until recently there were no animationbased adjacency matrix approaches for visualizing the dynamic changes of a graph. Rufiange and Melançon [RM14], however, now demonstrate with their approach AniMatrix that animated matrices can be submitted to COMPUTER GRAPHICS Forum (11/2015).
F. Beck, M. Burch, S. Diehl & D. Weiskopf / A Taxonomy and Survey of Dynamic Graph Visualization t1
t2
t1
t3
a
a
b
b
c
c
linearized
t2
a
t3
t1 t2 t3
b
linearized bipartite
c
radially layered
Figure 7: Juxtaposed node-link approaches on a timeline.
leveraged in practice, for instance, for analyzing evolving designs of software systems. They use a staged animation, similar to those already discussed for node-link diagrams, to guide through the changes step by step: first, vertices and edges are removed, then, existing ones are changed, finally, new ones are introduced.
II. Timeline (Time-to-Space Mapping) Instead of using animation, the graph can be drawn onto a timeline in a timeto-space mapping. Timeline-based approaches promise to provide a better overview of time as they show the complete sequence of graphs in a static image [TMB02]. At least for small datasets, arbitrary points in time might be compared without interaction and characteristics of the graph could become traceable along the full evolution of the graph. However, only little space is available for drawing each of the graphs, which might decrease the readability of the diagram. This visual scalability problem is one of the main challenges for the techniques classified into this category. A main distinguishing feature of the approaches is whether they are based on node-link diagrams, adjacency matrix representations, or adjacency list representations.
II.a. Node-Link-Based Approaches Placing node-link diagrams on a timeline is simple: as the introductory example in Figure 4 shows, node-link diagrams just need to be positioned next to each other, preferably applying a fixed layout of the nodes. In addition to this form of juxtaposition, other approaches can be used to lay out the diagrams: for instance, diagrams can be stacked on top of each other, which we call superimposition; or the sequence of graphs can be merged into an integrated diagram. These three categories—juxtaposed, superimposed, and integrated—are equivalent to the three categories Gleicher et al. [GAW∗ 11] describe as generic approaches to visual comparison (while the first two categories carry the same name in this classification, integration is a form of explicit encoding). Similar categories are described by Javed and Elmqvist [JE12] with the main difference that integrated approaches are divided into overloading and nesting.
+
submitted to COMPUTER GRAPHICS Forum (11/2015).
11
II.a.1. Juxtaposed Juxtaposing nodelink diagrams in a small multiples approach might be considered as simple, even trivial. However, considering this as a multiple views approach and just placing standard diagrams next to each other may not always produce convincing results: it is hard to see the differences between subsequent time steps, it is difficult to trace a node over several time steps, each diagram is quite small, and the overall representation is likely cluttered even for small examples. Several approaches attempt to address these problems and suggest aligned and explicitly connected diagrams: TimeArcTrees [GBD09] arrange the nodes onto vertical axes and optimize the node ordering (Figure 7, linearized); this makes it easier to compare time steps and trace nodes, but visual scalability stays low. Parallel Edge Splatting [BVB∗ 11] extends this approach by making each of the vertically arranged graphs artificially bipartite—edges are all directed from left to right (Figure 7, linearized bipartite). Additionally, plotting edge density instead of drawing overlapping links, this extension increases scalability. Also, a radial variant of Parallel Edge Splatting is possible [BBW12]. Other radially juxtaposed variants of node-link diagrams were introduced as well: TimeSpiderTrees [BFBD10] radially layer the node-link diagrams as nested circles (Figure 7, radially layered); but instead of completely drawing the links in those diagrams, only partial links are depicted (and expanded on demand). Farrugia et al. [FHQ11] use a similar layout to depict ego centered dynamic graphs (i.e., only neighboring nodes of a selected node are shown). Since ego networks are quite sparse and small, completely drawn links do not produce much clutter. To compare several ego networks, their radial representation can be juxtaposed as small multiples. Vehlow et al. [VBAW14] combine juxtaposed node-link diagrams with a representation of evolving clusters as a Sankey diagram (also called flow map). Similarly, Arendt and Blaha [AB14] extend storylines (i.e., lines that change their grouping along a timeline) by arcs connecting the lines to encode edges. II.a.2. Superimposed Instead of placing diagrams next to each other, they can be stacked on top of each other. In 2D, the nodes should have the same positions and the edges belonging to different time steps need to be discerned by color or stroke [EKLN04]. Stacked 2D diagrams can become 3D diagrams quite naturally through adding the time dimension as z-axis. However, as the third dimension is only used in discrete layers, these approaches are often referred to as 2.5D techniques. For instance, Dwyer and Eades [DE02] place 3D cylinders representing the nodes on an invisible 2D plane; edges at different levels indicate flows in the graph. Similarly, Brandes and Corman [BC03] depict nodes as cylinders, but also add transparent planes that help discern the stacked layers (Figure 8, fixed positions). Erten et al. [EKLN04], in contrast, allow the same node to have different positions on the layers; to preserve the mental map,
12
F. Beck, M. Burch, S. Diehl & D. Weiskopf / A Taxonomy and Survey of Dynamic Graph Visualization
a
b
c
bar chart
gestaltlines
pixel-based
a b c relaxed positions
fixed positions
Figure 8: Superimposed node-link approaches with different layers representing the time steps.
Figure 10: Different visualization approaches for intra-cell timelines in matrix representations.
general, integrated approaches seem to be often restricted to only special types of dynamic graphs. An advantage is that the integration of the timeline allows the representation of arbitrarily fine samplings of continuous time. timeline edges
ego timeline
parallel edges
Figure 9: Node-link approaches with an integrated timeline.
they use an adapted force-directed layout algorithm that moves the same nodes to at least similar positions across layers (Figure 8, relaxed positions). Groh et al. [GHW09] extend this approach by abstracting from nodes and links: they just use the connections between the same nodes of different layers (i.e., the dashed lines in Figure 8, relaxed positions) and visualize these as 3D tubes. II.a.3. Integrated In an integrated diagram, the timeline is woven into the node-link diagram—diagrams for different time steps cannot be separated anymore without destroying the readability of the diagram. For instance, Reitz [Rei10] shows ego networks where the evolution of edge weights is plotted onto each edge by varying its color in sections; each edge, hence, forms an individual timeline (Figure 9, edge timelines). Schmauder et al. [SBW15] extend this approach to arbitrary graphs using partially drawn links between nodes. Shi et al. [SWW∗ 15] focus on ego networks as well and introduce an approach they call 1.5D layout: they connect a central timeline representing the ego node with its neighbors by a link at the point in time where an edge first appears (Figure 9, ego timeline). For graphs where edges represent instant events (they can be assigned to a specific point in time without having a duration), van den Elzen et al. [vdEHBvW13] suggest Extended Massive Sequence Views, a technique that arranges a list of events as a horizontal timeline and orders nodes onto the vertical axis; edges are drawn at the respective position of the timeline as vertical lines connecting two vertical node positions (Figure 9, parallel edges). The authors discuss various strategies to linearly arrange the nodes as well as a radial variant of the visualization. A related approach by Burch et al. [BMW15] draws edges comparably, but encodes time in a separate, pixel-based timeline representation attached to each edge. In
II.a.4. Hybrid (Juxtaposed, Superimposed, Integrated) The different approaches to map node-link diagrams onto a timeline can also be combined. A simple approach is to have different views for the approaches and to smoothly transform one into the other, for instance, juxtaposed node-link diagrams as well as 2D and 3D superimposed ones [FAM∗ 11, ITK10]. While Federico et al. [FAM∗ 11] suggest three predefined views (camera perspective and layer positions), Itoh et al. [ITK10] allow the user to independently set camera perspective and layer positions. II.b. Matrix-Based Approaches Since adjacency matrices are used for visualizing static graphs, they can also be employed for encoding dynamic graphs on a timeline. The challenge is to connect the spatial encoding of time with the matrix information, which seems to be harder than in node-link diagrams because matrices are less flexible with respect to layout. However, advantages of the matrix representations—for instance, staying more readable for larger and denser graphs [GFC05, KEC06]—justify to tackle these difficulties. Depending on how the timeline and matrix are combined, we identify two types of visualization techniques based on adjacency matrices.
+
II.b.1. Intra-Cell Timelines As a dimensional stacking approach, the cells of an adjacency matrix may each contain an individual timeline to represent the dynamic changes of the edge encoded in the particular cell; the small intra-cell representations are a form of time series encoded in a sparkline [Tuf06]. As illustrated in Figure 10, very different forms of intra-cell timeline representations exist. For instance, it is possible to embed a simple bar chart showing the time on a horizontal axis from left to right [BSW13, YEL10] (Figure 10, left). In particular, Burch et al. [BSW13] show how a hierarchy structuring the vertices can be attached to sides of the matrix to represent a dynamic compound graph. Yi et al. [YEL10] extend submitted to COMPUTER GRAPHICS Forum (11/2015).
13
F. Beck, M. Burch, S. Diehl & D. Weiskopf / A Taxonomy and Survey of Dynamic Graph Visualization vertically stacked
horizontally stacked a
a
b
b c
c small multiples
radially distributed
radially layered
stacked
Figure 11: Schematic illustrations of layered matrices approaches; three shades of blue symbolize three time steps.
d
d
e
e
t1
t2
t3
t1
t2 t3
Figure 12: Two variants of list representations visually encoding a dynamic graph by color-coded targets of edges. the basic approach by displaying aggregated timelines for the vertices and encoding different edge types with different colors. When the cells become too small, the timeline representations become colored cells (as when showing a static graph). Instead of bars, Brandes and Nick [BN11] use socalled Gestaltlines as intra-cell representations: stacked lines encode three metrics, one in their angle, one in their length to the left, and one in their length to the right (Figure 10, middle). Moreover, Stein et al. [SWS10] suggest a pixel-based approach that folds a timeline into a cell so that each pixel (or any other quadratic subdivision) of the cell represents a point in time (Figure 10, right). The weight of the edge at a specific point is encoded in the brightness of the pixel; different folding strategies such as row-by-row, column-bycolumn, diagonal, etc. are possible. II.b.2. Layered Matrices Instead of splitting the cells of a matrix, adjacency matrices can be juxtaposed or layered on a timeline. While the straightforward approach is to use adjacency matrices as small multiples (Figure 11, small multiples), there are a couple of more sophisticated approaches: The TimeRadarTrees approach [BD08, BHW11] radially layers the time steps encoding the list of edges. Details can be read from radial thumbnail images attached to each circle segment representing a vertex; these thumbnails form a kind of distributed matrix representation (Figure 11, radially distributed). A radially layered approach by Vehlow et al. [VBSW13] literally bends the matrices of each time step into rings of a circle (Figure 11, radially layered). Cubix [BPF14b] stacks 2D matrices into 3D (Figure 11, stacked) and provides different small-multiples representations where adjacency matrices or other slices of the 3D matrix are juxtaposed. II.c. List-Based Approaches Adjacency lists are a common way to model graphs as a data structure but were only rarely used for visualization purposes. Employing the color of boxes to encode the source or target of an edge, some ambiguity is introduced, but highlevel structures are preserved. Hlawatsch et al. [HBW14] introduce two ways of using color-coded list representation to encode a dynamic graph on a horizontal timeline based on juxtaposition: First, each line represents a vertex and lists of
+
submitted to COMPUTER GRAPHICS Forum (11/2015).
links encoded as boxes are stacked horizontally (Figure 12, left). Second, each line represents a link containing a box if the link is active in a time step; lines belonging to the same vertex are stacked vertically (Figure 12, right). While Figure 12 focuses on outgoing edges, incoming edges can be encoded in the same way, for instance, attached at the left side of the vertex representations. III. Hybrid (Animation, Timeline) While most dynamic graph visualization techniques can be unambiguously classified as either using animation or using a static timeline, a few approaches combine both mappings of time. The combination of the two time representations can, however, follow different strategies in those hybrid approaches. We consider as hybrid ones only those strategies that use both representations closely connected and cannot easily be split into independent techniques. Hadlak et al. [HSS11] suggest small in situ visualizations to be integrated into a larger visualization; in that way also animated diagrams can be embedded into a timeline. Sallaberry et al. [SMM12] use a timeline-based, aggregated representation of cluster evolution to navigate through an animated node-link diagram. Beck et al. [BBV∗ 12] animate long sequences of graphs as a moving timeline representation based on Parallel Edge Splatting, later extended by radial, matrix, and list variants and flip-book browsing [BW15]. DiffAni [RM13] allows the user, for instance, to interactively aggregate parts of a timeline representation into animations; the authors present a taxonomy of hybrid approaches that can be systematically constructed from small multiples, difference representations, and animation— DiffAni supports arbitrary combinations. The Small MultiPiles approach [BHRD∗ 15] clusters and aggregates matrix representations of similar graphs over subsequent time steps; while clusters of graphs are visualized as small multiples, the contained graphs of each clusters can be explored by flipping through them, which creates a form of animation. Comparison to Related Taxonomy Concurrent to the publication of the previous version of this paper, Kerracher et al. [KKC14] surveyed the design space
14
F. Beck, M. Burch, S. Diehl & D. Weiskopf / A Taxonomy and Survey of Dynamic Graph Visualization
Figure 13: Distribution of time representations and graph visualization paradigms among evaluation (left) and application publications (right).
of dynamic graph visualizations as well, however, without providing a complete overview of literature in their publication. Their categorization is not embedded into a hierarchy, but consists of two main dimensions: the temporal encoding and the graph structural encoding. These two dimensions match with our tag categories time and paradigm, which guided the overall structure of our taxonomy. Hence, independent of each other, both categorizations substructure the visualization techniques in a similar manner. On a more detailed level, the two classifications also largely match; however, their categorization differentiates the timeline-based approaches in a more fine-grained manner, ours is structuring the animated approaches in more detail. 6. Evaluation Most papers we collected contain some sort of evaluation (Figure 5, category evaluation). Nevertheless, most evaluations are ‘only’ case studies, which are a rather lightweight form of evaluation not necessarily involving users (103 out of 162 publications). In contrast, some papers specifically focus on evaluation (36 publications, Figure 5, category type). This section primarily discusses insights gained from these evaluation papers, but also reflect some interesting evaluation results from technique or application papers. The section is structured according to different types of evaluation (Table 2 and Figure 5, category evaluation). Since surveys on the field have been already discussed in Section 2, they are omitted here. Also, case studies and expert reviews being lightweight evaluation techniques are not discussed in further detail. Figure 13 (left) shows that most evaluation approaches focus on animated node-link diagrams, but fewer on timeline representations; matrix visualizations are not yet evaluated in the context of dynamic graphs. 6.1. Evaluation Frameworks Visualizations are explorative analysis tools and often do not address a single task, but families of tasks. For evaluating visualization approaches, however, it should be clarified which tasks are addressed in the evaluation; a task taxonomy can help selecting appropriate tasks. Extending a task taxonomy for static graphs [LPP∗ 06], the taxonomy by Ahn et al. [APS13] collects and structures tasks by three dimensions: entity (granularity such as nodes and links, groups, or complete network), property (topology of entities and domain-specific attributes), and temporal feature (states over
time); these dimensions and their subcategories span a design space of tasks. Archambault and Purchase [AP13a] divide tasks into interpretation, change, and memory tasks, each on a scale from local to global. Bach et al. [BPF14a] introduce an alternative taxonomy dividing tasks into temporal tasks (when), topological tasks (where), and behavioral tasks (what). Kerracher et al. [KKC15] extend the generic task framework by Andrienko and Andrienko [AA06] and describe the design space of dynamic graph visualization tasks as a combination of two dimensions: first, task categories such as lookup, comparison, relation seeking; second, the data items involved (single graph elements or graph structures and single or multiple time points). In a follow-up work, Kerracher et al. [KKCG15] discuss how visualization techniques support the individual tasks of their framework. A further tool for evaluation is identifying desired properties of the visualization, which are often called aesthetic criteria in context of graph visualization. While many of those criteria were discussed and tested for static graphs [BRSG07], Beck et al. [BBD09, BBD13] extend these criteria to dynamic graph visualization and suggest three dimensions grouping the criteria: general aesthetic criteria, dynamic aesthetic criteria, and aesthetic scalability criteria. These criteria dimensions can be used for evaluating qualities of dynamic graph visualizations and find the right visualization technique for a given set of tasks and datasets [BBD13].
6.2. Algorithmic Evaluation A rather technical method of evaluation is measuring characteristics of the layout algorithm. For instance, Frishman and Tal [FT04] compare runtime, node density, and cluster characteristics of their online approach for drawing compound graphs to other approaches—the results indicate that their approach better discerns clusters. For another online approach, Frishman and Tal [FT08b] follow a similar evaluation scheme and provide evidence that their approach maintains the mental map well and its implementation on the GPU is more than a magnitude faster than a CPU implementation. The same approach is applied by Gorochowski et al. [GdBG12], however, combining it with a visual analysis of the sample data because not all important features are covered by the employed set of metrics. Other approaches as well measure runtime performance [FWSL12], preservation of the mental map [CTB13, FWSL12, HMHU13], or cluster quality [LSCL10]. While evaluation constitutes only a part of the above papers, Brandes and Mader [BM12] focus only on an algorithmic evaluation of offline node-link approaches: they contrast layout stability to individual layout quality and conclude that only linking nodes of adjacent time steps provides better results than positioning nodes at or near fixed positions. submitted to COMPUTER GRAPHICS Forum (11/2015).
F. Beck, M. Burch, S. Diehl & D. Weiskopf / A Taxonomy and Survey of Dynamic Graph Visualization
6.3. User Studies While algorithmic evaluation provides first insights into the characteristics of a visualization, finally deciding whether a technique is helpful requires involving users. In controlled experiments, different parameters of a visualization technique can be tested or two approaches might be compared against each other under controlled conditions. We group the studies according to research questions they investigate. Mental Map: The role of the mental map has been discussed since the first works on dynamic graph visualization and is probably their best evaluated aspect. While we briefly summarize results of related studies, Archambault and Purchase [AP13a] review studies on the mental map in much greater detail. In a first study, Purchase et al. [PHG07] test different degrees of preserving the mental map for a hierarchical node-link layout and find a positive effect of mental map preservation for some of the tasks. However, in similar studies, Purchase and Samra [PS08] and Saffrey and Purchase [SP08] cannot confirm positive effects of preserving the mental map but, in contrast, find that favoring a good individual layout tends to produce better results. Further, Archambault and Purchase [AP12, AP13b] do not detect significant effects of preserving the mental map in one study [AP12], but do in another where locating and path tracing tasks were performed better in the mental map condition [AP13b]. Ghani et al. [GEY12] vary the layout between fixed positions (perfect mental map) and individually optimized layouts (no mental map); their results, however, show that the mental map condition performs better. Hence, although several studies have been conducted so far, the role of the mental map is only partly understood yet, but at least there are indications that its role is task-dependent. Animation vs. Timeline: A central question that is reflected by the two main categories of our taxonomy is the representation of time—are animated approaches better than timeline-based ones, or vice versa? For a graph with timevarying node attributes visualized as a node-link diagram with static positions, Saraiya et al. [SLN05] compare an animated slider solution to an approach with small time-series visualizations in the nodes: they observe better performance of participants for the animated approach when only one or two points in time need to be studied; for tasks involving more time steps, however, results are better for the timeline approach. Farrugia and Quigley [FQ11] contrast an animated node-link diagram to a static approach showing nodelink diagrams in a grid (timeline) based on the same node layout; for the investigated time-related tasks, the static approach generally tends to provide better performance with respect to error rates and response time. With a similar experiment design, Archambault et al. [APP11a] also find generally quicker response times for the timeline conditions; but for some tasks related to the appearance of entities, animation produces lower error rates. Specifically focusing on node-link layouts with a low drawing stability, Archamsubmitted to COMPUTER GRAPHICS Forum (11/2015).
15
bault and Purchase [AP15], however, report that an animated approach, better than a timeline-based small multiples approach, supports the tracing of nodes and paths over time steps. In a qualitative study, Boyandin et al. [BBL12] further show that animation tends to reveal more findings on adjacent time steps while small multiples foster the discovery of patterns lasting over longer periods. In conclusion of these studies, timeline-based approaches seem to be preferable for tasks involving more than two time steps. As Rufiange and McGuffin [RM13] show, hybrid approaches mixing animation and timeline, under certain conditions, can produce better results. Specific Approaches: Further, some specific approaches were evaluated, either varying a visualization parameter or comparing two approaches against each other. Elmqvist and Tsigas [ET03] show that their timeline-based node-link approach works better than Hasse diagrams for visualizing the information flow between interacting software processes with respect to most tasks. Rey and Diehl [RD10] investigate animation speed and labeling in animated node-link diagrams and find that an interactively selectable presentation speed does not have a positive effect on comprehension performance; in contrast, it is beneficial to always show labels instead of retrieving labels only on demand. Archambault et al. [APP11b] test the importance of explicitly encoding differences in node-link diagrams for two animated approaches and a small multiples approach; difference maps help for certain comparison-related tasks and are preferred by the participants. For another difference visualization approach, Zaman et al. [ZKS11] also find conditions where it outperforms animation. Bach et al. [BPF14a] compare their animated nodelink approach GraphDiaries to simpler approaches without staged animation or without animation at all; their results provide some evidence that animation is helpful and staged animation tends to further improve task performance. Evaluating an approach using different timeline-based views connected by animated transitions, Smuc et al. [SFW∗ 14] observe diverse problem solving strategies, which suggests that the different views are required but the integration of views needs to be as smooth as possible. Hlawatsch et al. [HBW14] provide empirical evidence that a list-based approach can be superior to matrix and node-link representations for certain tasks related to the degree of vertices and weights of edges, while lists perform on a comparable level for other tasks. Shi et al. [SWW∗ 15] evaluate their integrated timeline approach for egocentric networks against a small multiples and an animated approach; they find, among other results, that for tasks analyzing the temporal aspect of a focused node, their egocentric approach performed best regarding error rate and response time.
7. Application Dynamic graph visualizations can be applied to various datasets from very different domains. In this section, we
16
F. Beck, M. Burch, S. Diehl & D. Weiskopf / A Taxonomy and Survey of Dynamic Graph Visualization
present in particular those publications classified as application papers, but occasionally also reference technique papers that put a special focus on a certain application. Despite the variety of application scenarios, only few mature tools are readily available for dynamic graph visualization: Gephi [BHJ09], Commetrix [Tri06], and KeyLines‡ show animated node-link diagrams and provide features for filtering, clustering, and computing network metrics. Selecting only the application papers in our database, we see in Figure 13 (right) that almost only node-link diagrams are used, but in combination with both animation and timeline representations. Social Data: With the increasing popularity of social media, a variety of datasets of social networks became available and a new area of research formed around this topic. A challenge in this context is to visualize the dynamics and evolution of these networks. Moody et al. [MMBd05] motivate the use of dynamic graph visualization for social network analysis and provide initial examples of how animated node-link approaches can be used for visualizing these networks. Bender-deMoll and McFarland [BdM06] present a framework for testing different animated node-link layouts with respect to this application. Social network metrics can be used to specialize and augment graph layouts [CTB13]. Brandes et al. [BIM12] discuss the visualization of analysis models for temporal effects in social networks. Specific types of dynamic social networks that have been investigated are, for example, textual online conversations such as chats [PT10], online communities [ATMS∗ 11], the activity and interest of bloggers [IYTK12], the development of character relationships in literature [IA12,OKK13], or the propagation of microblogging messages [LQC∗ 13]. Studying the evolution of these networks might support answering sociological and psychological questions, could help historians and literature scholars, but may as well act as an end-user tool to retrieve facts from social media, for instance, to find relevant news or people. Documents: Texts and documents can be related through different kinds of connections such as citations, hyperlinks, similar content, etc. If documents are created or existing ones are changed, these connections change over time. For researchers, quite natural applications are libraries of scientific publications, for instance, visualizing co-authorship [EHK∗ 04a, Rei10, YAPM08], connections between research areas [EHK∗ 04a], co-citation networks [Che06] (i.e., publications cited by the same other publication), or semantic similarity of content [ABPdO12]. But, of course, the evolution of other document collections can be visualized as well, such as hyperlink structures between webpages [TK05, YAPM08], semantic relationships between retrieved entities [SNF10], or between messages in news streams [GHN13]. Since documents have a social ‡
http://keylines.com/
context (authors, readers, distributors, etc.), there is certain overlap with social data—whether people or entities form the nodes of the dynamic graph may act as a distinguishing criterion. Software Engineering: Among the first, dynamic graph visualizations were applied to software-related data. Already in 1995, Kimelman et al. [KLRZ95] discuss the problem of visual complexity for visualizing program executions. Also visualizing the execution dynamics of software, others depict the information flow between processes [ET03], object interactions [GLW06], dynamic call graphs [BMR∗ 12, BBV∗ 12], or objects migrating between hosts [FT08a]. In addition to execution, another dynamic aspect of software that can be visualized is its evolution—the changes applied to software systems over time: for instance, the evolution of call, inheritance, or flow graphs [CKN∗ 03], of cochanged files [BH06], or author–file relationships [OM08, OM09]. Evolution patterns, as described by Rufiange and Melançon [RM14], can be detected with those visualizations. Hence, software systems have different dimensions of time—execution and evolution—and relevant graph data can be derived and combined from multiple sources. Others: There are various further applications of dynamic graphs and their visualization. In research, for instance in context of biology, evolving metabolic pathways [RUK∗ 10], simulated chemical reaction networks [JSS∗ 12] and uncertainties therein [VHK∗ 13], or protein interaction networks [BFL12] are studied. Psychology and user interface research may profit from depicting eye gaze data as dynamic graphs recorded in eye-tracking studies [BBR∗ 14, HEF∗ 13]. Computer scientists can investigate the evolution of the Internet [BBP08] or anomalies in communication networks [LSW13]. Business researchers and managers are supported in analyzing contagion in financial networks [vLDBF13] and movements in stock portfolios [DE02]. Geography and politics researchers may analyze migration [BBL12, SBW15] or traffic data [GBD09, HEF∗ 13] in context of spatial information. Dynamic graph drawing may even reach a wider audience when depicting popular topics such as movie–actor affiliations [BHP06] or international soccer matches [AFH∗ 10]. In essence, every application where static graph visualization can be applied is a candidate for also leveraging the visualization of dynamic graphs—static graphs are often just a simplification of dynamic ones. 8. Bibliographic Analysis The collected literature database reaches a size that can hardly be reviewed by just reading some of the papers. Hence, we complement the qualitative survey of the field described in the previous sections by a quantitative analysis of the bibliography: we study temporal evolution of the field and its topics and identify influential publications. All figures of this section were created using our web-based literasubmitted to COMPUTER GRAPHICS Forum (11/2015).
17
F. Beck, M. Burch, S. Diehl & D. Weiskopf / A Taxonomy and Survey of Dynamic Graph Visualization
Table 6: Top five technique papers ranked in citations (cit.) per year, retrieved October 13, 2014 through Google Scholar; 2014 was counted as 0.75 years. For simplification, all publications were assumed to be published on January 1 in the respective year. Figure 14: Yearly number of publications distinguished by selected evaluation methods applied.
Figure 15: Yearly number of publications distinguished by representation of time (top) and the graph visualization paradigm (bottom).
paper
year
1.
Misue et al. [MELS95]
1995
2.
Frishman and Tal [FT08b]
2008
3.
Burch et al. [BVB∗ 11]
4. 5.
category
cit.
cit./year
?
492
24.9
?
122
18.1
2011
45
12.0
Brandes and Corman [BC03]
2003
134
11.4
Diehl and Görg [DG02]
2002
132
10.4
been introduced only since 2010: animated matrices (Taxonomy Category I.c.), node-link approaches with an integrated timeline (Taxonomy Category II.a.3.), intra-cell timelines of matrices (Taxonomy Category II.b.1.), and hybrids of animated and timeline-based approaches (Taxonomy Category III.). Within individual taxonomy categories, there have been recent innovations as well, for example, applying edge bundling to dynamic graphs [HEF∗ 13], stacked and sliced matrices [BPF14b], or visualizing cluster evolution together with graph evolution [VBAW14]. 8.2. Publications
ture browser that was developed in the context of this work (cf. Section 4). The published literature database and tool allow the reader to replicate and extend this analysis. 8.1. Topics, Trends, and New Ideas The history of the field dates back to the 1990s, as outlined in Section 1. The growing number of publications in general, but specifically, the increasing quantity of evaluation and application papers (cf. Figure 2) characterizes a maturing field. Also, among the evaluation methods, we observe a further maturation process: Figure 14 shows that evaluation by case studies are more and more replaced by user studies. In 2014 and 2015, the number of papers peaked that surveyed the field to some extent (cf. Section 2); this paper is part of this particular trend. Being published more or less concurrently, these surveys could only partly build upon each other. However, the independent publication of several such related papers perhaps indicates a need to consolidate and structure the growing field. The focus of the publications evolved as well, in particular with respect to the applied visualization paradigms. As indicated by Figure 15, early publications only covered animated node-link diagrams. Only from 2002 onward, time-to-space mappings have been explored. While matrix-based approaches came up in 2008, the first listbased approach was published in 2014. Table 4 and Table 5 help identify other fundamentally new ideas that have submitted to COMPUTER GRAPHICS Forum (11/2015).
Determining the influence of specific papers provides insights into what extent results found application in other scientific works and practice. It might also serve readers as recommendations for further reading. As a coarse quantifiable indicator of influence in academia—not discerning positive and negative influence—the number of citations of the papers can be considered. While the total number of citations provides an accumulated measure of influence and favors older publications, the number of citations per year is more comparable for papers of different age. We focus in the following only on publications categorized as technique papers because these are likely to be cited due to the dynamic graph visualization technique described. Table 6 shows the top five technique papers ranked according to their influence with respect to citations per year. Clear leader of the list is a work by Misue et al. [MELS95]— one of the oldest publications in the field—describing an online animated node-link approach. While the second publication in the list [FT08b] belongs to the same taxonomy category, the following ones also cover other categories: not just animated approaches, but also timeline-based ones are listed. All are, however, node-link representations; the first matrix-based approach is the work by Brandes et al. [BN11] and is rated 8th with 8.8 citations per year. Hence, the number of citations per year still reflects the historic evolution of the topics in the field. Nevertheless, newer papers are cited frequently as well, for instance, the work on Parallel Edge Splatting by Burch et al. [BVB∗ 11].
18
F. Beck, M. Burch, S. Diehl & D. Weiskopf / A Taxonomy and Survey of Dynamic Graph Visualization
8.3. State of the Field In conclusion, this bibliographic analysis shows that dynamic graph visualization is a growing discipline of information visualization. New visualization paradigms—timeline, matrix, and list representations—gradually initiated new directions of research. The most cited technique papers per year show a diverse structure, both with respect to age of the publications as well as taxonomy category, while still reflecting the history of the field. Hence, we observe a growing and maturing, but still innovating field of research with a sound mixture of continuity and diversity. 9. Research Challenges The overview of the field forms a good basis for discussing the main challenges of, and possible directions for future research. Our tagging of publications and taxonomy of techniques allow us to see which areas have already been studied in detail and which areas are just covered by few works; the survey of evaluation results identifies answered and unanswered questions; the discussed applications point towards areas where dynamic graph visualization might have a considerable practical impact. Specifically for the visualization of multivariate dynamic graphs, Archambault et al. [AAK∗ 14] already discussed open problems, partly overlapping with the research challenges introduced in the following. These challenges only reflect the experience and subjective opinion of the authors—Section 10 provides further ideas on research challenges by external experts. Evaluation: A first, quite generic research challenge is conducting evaluations. As in other areas of information visualization, only a few questions have been evaluated so far. Although most efforts have concentrated on the importance of the mental map, it is only partially clear for which tasks and to what extent the mental map needs to be preserved. Only a few other questions have been investigated. Hence, it is still unanswered which visualization technique is suitable for which application. Also, setting the parameters of the different techniques is rarely explored, such as magic constants of layout and clustering algorithms, color-mapping, or sampling rate and time aggregation. Moreover, questions of perception are relevant, for instance, the users’ cognitive load watching an animation, effects of attention, or typical misinterpretations of visual elements. Visual Scalability: A further general challenge in information visualization, which also applies here, is visual scalability: with an increasing amount of displayed data, the generated diagrams should remain readable. In most of the discussed applications, datasets of interest are likely to be large. For static diagrams, already some scalability comparisons have been conducted, for instance, contrasting node-link and matrix diagrams [GFC05, KEC06]. While, in static graphs, the number of nodes and the density of edges are the two crucial parameters for scalability, Beck et al. [BBD09] argue that the number of time steps needs to be considered
as a third dimension when studying dynamic graph visualizations. So far, scalability has only played a minor role in designing most dynamic graph visualization approaches, although it has been already discussed in depth for static graphs [vLKS∗ 11]. Hybrids: Some approaches already started to combine different techniques, such as animation and timeline representations (Taxonomy Category III.) or different variants of timeline-based node-link diagrams (Taxonomy Category II.a.4.). However, many more possible hybrids exist between different categories of the taxonomy. While not all combinations are sensible, there are a number of hybrid variants that appear to be promising: for instance, the combination of node-link diagrams and matrices have already been successfully explored for static graphs [HF07, HFM07]. Recently, it has been shown that animating a matrix diagram also works if the animation process is designed with similar care as in those works describing the transition problem for nodelink diagrams (Taxonomy Category I.a.3.) [RM14]. Further, combinations of animation and timeline approaches have not yet been fully explored. Extended Data Dimensions: While dynamic graphs add a time dimension to static graphs, dynamic graphs themselves can be extended by other dimensions. As it is the case when we move from static to dynamic graphs, adding a new data dimension usually requires the visualization to change considerably. What has been already studied, is adding a hierarchy to the vertices of the graph (Taxonomy Category I.b.1. and partly II.a.1.). Yet, most of these approaches assume that the hierarchy is constant or at least only gradually changing. An open question is how to visualize a hierarchical structure that changes more significantly along with the dynamic graph. Additional data dimensions that have only been partly explored are dynamic multivariate graphs [BN11, YEL10, AAK∗ 14], dynamic graphs with uncertainty information [VHK∗ 13], and geo-located graphs [HEF∗ 13]. Finally, the effects of using continuous time with arbitrary fine sampling rates, rather than discretized time, are largely unexplored. Interaction: While most timeline-based approaches produce static images, animated node-link diagrams inherently require interactive displays. Although the first works in the field already investigated smooth navigation in graphs, this focus seems to have been lost over the years. Navigation in dynamic graphs can have multiple dimensions: users might navigate in space (i.e., the static graph) as well as in time. As recent works with a special focus on navigation have shown, interaction could help integrate different modes [RM13, HSS11] or filter down the data to a manageable size [AHSS13]. Working with several views introduces further challenges, such as, visually mapping and synchronizing multiple representatives of the same objects between different visualizations. Finally, annotating and editing a dynamic graph structure is not well studied. All these interacsubmitted to COMPUTER GRAPHICS Forum (11/2015).
F. Beck, M. Burch, S. Diehl & D. Weiskopf / A Taxonomy and Survey of Dynamic Graph Visualization
tive features and combinations of different views and visualizations can be integrated into consistent visual analytics approaches. Applications: Without application, visualization would lose its purpose. As discussed in Section 7, there are a number of areas where different dynamic graph visualizations have been already applied. Looking at the recent development, we see that still new applications have arisen, for instance, the analysis of characters in literature [IA12, OKK13], understanding financial and bio-medical contagion networks [vLDBF13], or visualizing eye-tracking data [BBR∗ 14, HEF∗ 13]. This steady progress already suggests that there are still more areas to be explored for dynamic graph visualization. In particular, looking at the wide variety of applications that static graphs have, we will probably find many examples where dynamics are important but have not been studied by means of visualization yet. As datasets often have application-specific characteristics and there exist application-specific requirements, an adaption of existing techniques might not be straightforward but could require new research.
19
• Q2: Where do you see fundamental advantages or disadvantages of the animated and timeline-based approaches compared to each other? • Q3: We suggest six challenges for future research in the field. Please rate the importance of each on a scale from 1 (not important) to 5 (very important). • Q4: Do you consider other future challenges as important for the field? • Q5: Do you suggest to add a specific paper or is any paper from previous years missing that you consider as relevant? Additionally, the opportunity for general comments was given. While Q1 and Q2 ask for a discussion of previous approaches and evaluations (in particular, they cover the two main research questions of user studies discussed in Section 6.3), Q3 and Q4 refer to future challenges as described in Section 9. In the following, we qualitatively evaluate answers to Q1, Q2, and Q4 referring to the individual experts by E1–E16. In contrast, Q3 can be summarized in a quantitative way. We will not discuss Q5 independently because the answers were already used to complete our literature collection (cf. Section 4).
10. Experts’ Feedback
10.1. Discussion of Achievements
To obtain wide input and reflect the opinion of the community, we conducted a survey regarding achievements and challenges of the field. We invited active experts from the field of dynamic graph visualization to participate in a short questionnaire study. For the identification of experts, we selected authors from the collected literature by applying the following rules: an author of one of the collected papers was considered as an active expert if
To discuss what has been already achieved, we decided to specifically address questions that have been controversially discussed in the past, in particular, in context of evaluation papers (cf. Section 6). Hence, we asked for opinions on the two topics most of the user studies have been about: the role of the mental map and the difference between animated and timeline-based approaches. Q1: The Role of the Mental Map
• the person co-authored at least three papers in the field, with at least one published in 2010 or later, or • the person co-authored a survey that covered the area (cf. Section 2) and was published in 2010 or later. These rules led to an invitation of 32 experts (excluding the authors themselves and the non-anonymous reviewers of the previous version of the paper). The questionnaire was sent and the results were collected via email. Two invitees who could not participate themselves suggested three further experts that we invited as well. From the 35 invited experts, 16 took part by sending back a completed questionnaire (response rate of 46%); the list of participating experts, who all agreed to be mentioned by name, is provided in the Acknowledgments section and their expertise regarding dynamic graph visualization can be retrieved with our interactive literature browser. The questionnaire contained five questions that can be summarized as follows: • Q1: What is your opinion about the role of the mental map for dynamic graph visualization? submitted to COMPUTER GRAPHICS Forum (11/2015).
15 of 16 experts answered Q1. Some experts rated the role of the mental map as important, in particular, in the context of animated approaches, but also for timeline-based approaches (E1, E10). The preservation of the mental map specifically eases the tracking of nodes (E6) and is crucial for larger graphs (E11). The term also helps to reason about good graph layouts (E7) and could guide the evaluation of layout algorithms (E8). Further, E4 reports that the problem of preserving the mental map has been a key issue in projects with industry partners. In contrast, other answers discuss limitations of the term and its practical relevance. For instance, preserving the mental map might not be as important for small graphs (E6). Some experts mention that the results of empirical studies only partially cover important aspects and provide different outcomes (E3, E11, E14, E15). They point out that importance of the mental map depends on tasks (E3, E6, E11, E14, E16), context (E3, E7), and users (E3, E7). Some experts question the term mental map and its definition in general (E2, E7, E8, E9): it seems to be only a translation of stabilizing the position of nodes (E2, E7, E8), but does not directly
20
F. Beck, M. Burch, S. Diehl & D. Weiskopf / A Taxonomy and Survey of Dynamic Graph Visualization
reflect a cognitive model (E2, E7). Appropriate definitions of the term might need to be application-dependent (E8) and should incorporate cognitive theory (E7). Addressing future research, E8 and E12 ask for more studies investigating the role of the mental map in more detail, in particular, studying influence of the mapping of time, visualization paradigm, graph rendering style, data characteristics, tasks, and interactions. E11 further suggests investigating the importance of the mental map for big data. Finally, E5 points out that, beyond dynamic graph visualization, “the role of the mental map is still completely underestimated in the field of information visualization”: a mental map eases understanding if something fits into that cognitive model, but is an obstacle if not. E5 suggests generalizing the idea of the mental map from the graph layout to other aspects like clusters and attributes. Q2: Animated and Timeline-Based Approaches Comparing the time-to-time mapping against the time-tospace mapping, all 14 experts who answered directly the question highlighted advantages of both approaches and only few named a clear preference (animation: none; timeline: E7, E15). Hence, the general opinion seems to be that there is no clear winner among the approaches, but selecting between the two should take context and tasks into account. Animation is the most congruent mapping of the time dimension as time is represented as time (E5, E13), is “instinctively understood by users”, and can hardly be used to encode other variables than time (E13). Motion effectively and vividly highlights changes (E6, E7, E10, E12, E13) and provides an impression of the rate of change (E16). Animation can be more engaging or enjoyable for users (E2, E13). Selecting a point in time and stopping the animation allows reducing the complexity of the analysis (E7), can show the graph in more space (E7, E13), and therefore scales better for larger graphs (E11, E13). Hence, animation specifically serves tasks that do not require a comparison of different time steps (E7). Animation speed has to be chosen carefully, maybe adaptively (E8); tools need to provide additional time sliders to navigate through time (E10). In general, the user interface and interactions need careful design (E15). However, even a thorough design of the animation process might not prevent a certain visual overload with increasing data complexity and length of animation (E10). Some cognitive overhead is inherent to memorize the evolution, even when only comparing two steps in time (E13)—“temporal context becomes invisible” (E5). The phenomenon of change blindness suggests that changes might not be noticed by the viewer (E15) and it is difficult to control what is perceived (E7). It becomes hard for the viewer to analyze the overall evolution, in particular, long sequences of time steps (E11). As a further consequence, time-related tasks might require more time (E13). Running the animation like a film lacks interaction to explore the data (E13); certain interaction techniques like zooming or selecting are difficult to apply during
a running animation (E12). An obvious, still important disadvantage of animation is that it cannot be printed or represented statically in other media (E1). Applications that suit animated approaches are presentation and communication scenarios (E14, E15), in particular, in combination with oral presentation (E1) and presented to non-expert users (E15). Animation is less suitable for exploration and confirmation tasks (E14). Timeline-based approaches, in contrast, show the available data at once (E13) and thereby summarize the whole dataset (E11), making it possible to see the rate of change (E16). They “allow a user to choose the amount of time needed to compare sequential states” (E8). Comparison can be done with a lower overhead and load on the user’s mental memory (E10, E12, E13). Specifically, the comparison of longer sequences with more than two time steps is supported (E7, E13). Further, it might be easier to encode differences between time steps explicitly (E1). Interactions like selecting elements are easier to integrate in the static diagram (E7). In general, timeline-based approaches seem to support a greater variety of tasks without impairing completion times and error rates (E6, E13). They are not just suitable for presentation tasks, but also for exploration and confirmation (E14). Not using animation, however, comes at the cost of loosing a visual variable and the requirement to use another one for encoding time (E10). Usually, timeline-based approaches have to fit the individual representation of a graph at a point in time into smaller screen space (E1, E13). This requirement limits scalability in general (E11, E13) and makes it hard to visualize many time steps in particular (E1). Also, timeline approaches need to be designed well and should be easy to read (E15). E4—while supporting the general distinction between mapping of time to time or space—questions the usage of the term timeline in this context: “Animation is based on a timeline as well.” In general, the experts conclude that the selection of the right approach is task-dependent (E5, E7, E9). A solution that combines advantages of the two approaches could be hybrid techniques (E5). “One fundamental issue for both approaches is how to handle scale on the temporal data dimension.” (E13) 10.2. Research Challenges In addition to the first questions looking at achievements in retrospect, the second part of the questionnaire addresses future research challenges. On the one hand, the experts rated the challenges that we propose in Section 9; on the other hand, we asked them to suggest new challenges that are not covered yet by our challenges. Q3: Ratings of Importance Q3 asked the experts to assign ratings from 1 (not important) to 5 (very important) to each of the challenges of Section 9 submitted to COMPUTER GRAPHICS Forum (11/2015).
F. Beck, M. Burch, S. Diehl & D. Weiskopf / A Taxonomy and Survey of Dynamic Graph Visualization
Table 7: Importance ratings of challenges for future research (cf. Section 9) from 1 (not important) to 5 (very important) given by 15 experts. challenge
avg
var
histogram
evaluation
3.9
1.1
1
5
visual scalability
4.5
0.7
1
5
hybrids
3.5
1.1
1
5
extended data dimensions
4.1
0.8
1
5
interaction
4.1
1.2
1
5
applications
2.9
1.7
1
5
(we referred to the early publication of this work [BBDW14] for definitions of the challenges). Of the 16 participants, 15 answered Q3. Table 7 summarizes these 15 answers by providing the average importance, the variance of the answers as a measure of disagreement, and a histogram of the ratings. The results show that visual scalability is rated highest with an average of 4.5—most participants consider the challenge as very important; the low variance value indicates a strong agreement among the experts. Extended data dimensions and interaction are rated on average as important (4.1), closely followed by evaluation (3.9), all three with a low to medium variance in the answers (0.8 to 1.2). Finally, hybrids and applications share a medium level of importance (3.5 and 2.9) with a medium to high variance (1.1, 1.7); hybrids are seen as less important, yet all experts ranked them ≥2 on the scale from 1 to 5. Q4: Additional Challenges As part of answers to Q4, 12 experts named the following challenges that are not covered by the previously mentioned ones (if necessary, answers were cut or slightly edited as indicated by square brackets): • New metaphors: “I would like to see new metaphors, new paradigms, new innovation, new approaches in an area that I think has been a little inward-looking in recent years.” (E3) • Guidelines: “[...] developing guidelines that support the user to apply appropriate techniques should be on the agenda for future work.” (E4) • Graph dynamics: “[...] a visualization of graph dynamics would aim to adapt visualizations and analysis methods for time-varying multivariate data to time-varying graphstructured data.” (E5) • Tasks: “Identification of concrete, and useful ‘large’ graph tasks that can be aided by dynamic visualization.” (E9) “Fully elucidating the tasks which users need to carry out when exploring temporal graph data.” (E13) • Data velocity: “Many dynamic graph applications can include real-time data, which adds additional challenges.” (E11) submitted to COMPUTER GRAPHICS Forum (11/2015).
21
• Specific analytical methods: “[...] we need specific methods for data reduction (i.e. filtering, aggregation) as well as data mining, to be tightly intertwined with [visualization], according to the Visual Analytics paradigm.” (E12) • Dynamic graph comparison: [...] “visual techniques for supporting comparison between two changing networks [...] has not received much attention [...]” (E13) In addition, the experts suggested refinements or extensions of the previous challenges: E6 points out that visual scalability is underexplored with respect to the number of time steps. E10 argues that hybrids can be extended to combinations of general visualizations with dynamic graph representations. As a specific instance of the extended data dimensions, E1 would be interested in the evolution of clusters in the graph. E7 suggests rephrasing and narrowing down the challenge of application to domain knowledge—how domain knowledge can be used to improve a specific visualization application. Other comments refer to previous questions, in particular, to Q1: coming up with clear definition of the term mental map and general terminology is also a research challenge (E2, E9). Related to that, E7 sees a connection of evaluation, visual scalability, and interaction to the basic question: “How is the graph structure represented in our mind and how does our mind operate on this representation?”
10.3. Discussion and Limitations These answers provide a broad overview of how experts in the community assess the state of the field, backed by a stringent selection process of experts and a high response rate. It confirms that there are still issues that are controversially discussed and many open questions for future research. The ratings of challenges show that we identified a valid set of challenges: a substantial number of experts rated each challenge as important. The level of importance, however, varies from a very high importance for visual scalability to a still high one for extended data dimensions, interaction, evaluation, and finally to a medium importance of hybrids (i.e., combination of visualization techniques) and applications (i.e., investigating new application scenarios). However, it is unclear how the new challenges posed by the participants would have been rated in comparison to the ones introduced in Section 9. Also, the importance ratings do not necessarily predict relevance of future research tackling the respective challenge; ratings might not be independent because the formulated challenges cannot be interpreted as fully orthogonal. In general, the study only reports subjective opinions of the participants; the required filtering and summarization of the answers could potentially have also introduced a certain bias. Nevertheless, the answers of the experts, together with our discussion of future challenges in Section 9, could serve as starting points for new research projects.
22
F. Beck, M. Burch, S. Diehl & D. Weiskopf / A Taxonomy and Survey of Dynamic Graph Visualization
11. Conclusions This work presented the state of the art in visualizing dynamically changing relational data. Building on previous work in the graph drawing and information visualization communities, the visualization of dynamic graphs has become an active and constantly growing research discipline. While, initially, animated node-link diagrams dominated the research, timeline-based approaches gained more importance recently. First empirical evaluations of the approaches were conducted. With the increasing availability of temporal data, dynamic graph visualizations have been adapted to many areas of application. By systematically collecting and categorizing the literature, we structured the field and collected the works spread over different areas of research and communities. This review makes approaches more comparable as it points out similarities and differences using a consistent taxonomy. Studying the development of the field based on the collected data, there are no indicators that research within the area has met an end. On the contrary, new visualizations are still introduced, evaluation is only in its infancy, and there are many open challenges and interesting research problems. The feedback received from experts of the domain reveals controversial issues, prioritizes research questions, and provides ideas for future research. Acknowledgments We want to express our great appreciation to all experts replying to our questionnaire, in particular, James Abello, Daniel Archambault, Pierre Dragicevic, Paolo Federico, Jessie Kennedy, Natalie Kerracher, Thorsten May, Silvia Miksch, Chris Muelder, Helen C. Purchase, Tobias Schreck, Heidrun Schumann, Hans-Jörg Schulz, Michael Smuc, Corinna Vehlow, and Florian Windhager§ . Furthermore, we would like to thank the reviewers of the previous and current version of the paper for their detailed and constructive comments that helped us improve and extend the work. References [AA06] A NDRIENKO N., A NDRIENKO G.: Exploratory analysis of spatial and temporal data: a systematic approach. Springer, 2006. doi:10.1007/3-540-31190-4. 14 [AAK∗ 14] A RCHAMBAULT D., A BELLO J., K ENNEDY J., KOBOUROV S. G., M A K.-L., M IKSCH S., M UELDER C., T ELEA A.: Temporal multivariate networks. In Multivariate Network Visualization. Springer, 2014, ch. 8, pp. 151–175. doi:10.1007/978-3-319-06793-3_8. 3, 4, 18 [AB14] A RENDT D. L., B LAHA L. M.: SVEN: Informative visual representation of complex dynamic structure. arXiv preprint arXiv:1412.6706 (2014). URL: http://xxx.tau.ac.il/ abs/1412.6706. 9, 11 § Please note that this list of experts does not correspond in any way to the numbering of experts in Section 10; all experts agreed to be mentioned by name.
[ABPdO12] A LENCAR A. B., B ÖRNER K., PAULOVICH F. V., DE O LIVEIRA M. C. F.: Time-aware visualization of document collections. In Proceedings of the 27th Annual ACM Symposium on Applied Computing (2012), SAC, ACM, pp. 997–1004. doi: 10.1145/2245276.2245469. 16 [AFH∗ 10] A HMED A., F U X., H ONG S.-H., N GUYEN Q. H., X U K.: Visual analysis of history of World Cup: A dynamic network with dynamic hierarchy and geographic clustering. In Visual Information Communication, VINCI. Springer, 2010, pp. 25–39. doi:10.1007/978-1-4419-0312-9_2. 16 [AHSS13] A BELLO J., H ADLAK S., S CHUMANN H., S CHULZ H.-J.: A modular degree-of-interest specification for the visual analysis of large dynamic networks. IEEE Transactions on Visualization and Computer Graphics 20, 3 (2013), 337–350. doi:10.1109/TVCG.2013.109. 8, 10, 18 [AMST11] A IGNER W., M IKSCH S., S CHUMANN H., T OMIN SKI C.: Visualization of time-oriented data. Springer, 2011. doi:10.1007/978-0-85729-079-3. 4 [AP12] A RCHAMBAULT D., P URCHASE H. C.: The mental map and memorability in dynamic graphs. In Proceeding of the IEEE Pacific Visualization Symposium (2012), PacificVis, IEEE, pp. 89–96. doi:10.1109/PacificVis.2012.6183578. 15 [AP13a] A RCHAMBAULT D., P URCHASE H. C.: The “Map" in the mental map: Experimental results in dynamic graph drawing. International Journal of Human-Computer Studies 71, 11 (2013), 1044 – 1055. doi:10.1016/j.ijhcs.2013.08.004. 3, 4, 14, 15 [AP13b] A RCHAMBAULT D., P URCHASE H. C.: Mental map preservation helps user orientation in dynamic graphs. In Graph Drawing (2013), GD, Springer, pp. 475–486. doi:10.1007/ 978-3-642-36763-2_42. 15 [AP14] A RCHAMBAULT D., P URCHASE H. C.: On the application of experimental results in dynamic graph drawing. In Joint Proceedings of the Fourth International Workshop on Euler Diagrams and the First International Workshop on Graph Visualization in Practice (2014), GraphViP, CEUR-WS.org, pp. 73–77. URL: http://ceur-ws.org/Vol-1244/ GViP-paper5.pdf. 3 [AP15] A RCHAMBAULT D., P URCHASE H. C.: Can animation support the visualisation of dynamic graphs? Information Sciences (2015). doi:10.1016/j.ins.2015.04.017. 15 [APP11a] A RCHAMBAULT D., P URCHASE H. C., P INAUD B.: Animation, small multiples, and the effect of mental map preservation in dynamic graphs. IEEE Transactions on Visualization and Computer Graphics 17, 4 (2011), 539–552. doi: 10.1109/tvcg.2010.78. 15 [APP11b] A RCHAMBAULT D., P URCHASE H. C., P INAUD B.: Difference map readability for dynamic graphs. In Graph Drawing, GD. Springer, 2011, pp. 50–61. doi:10.1007/ 978-3-642-18469-7\_5. 15 [APS13] A HN J.- W., P LAISANT C., S HNEIDERMAN B.: A task taxonomy for network evolution analysis. IEEE Transactions on Visualization and Computer Graphics 20, 3 (2013), 365–376. doi:10.1109/TVCG.2013.238. 4, 14 [ATMS∗ 11] A HN J.- W., TAIEB -M AIMON M., S OPAN A., P LAISANT C., S HNEIDERMAN B.: Temporal visualization of social network dynamics: Prototypes for nation of neighbors. In Social Computing, Behavioral-Cultural Modeling and Prediction, SBP. Springer, 2011, pp. 309–316. doi:10.1007/ 978-3-642-19656-0_43. 16 [BBD09] B ECK F., B URCH M., D IEHL S.: Towards an aesthetic dimensions framework for dynamic graph visualisations. submitted to COMPUTER GRAPHICS Forum (11/2015).
F. Beck, M. Burch, S. Diehl & D. Weiskopf / A Taxonomy and Survey of Dynamic Graph Visualization In Proceedings of the 13th International Conference on Information Visualisation (2009), IV, IEEE, pp. 592–597. doi: 10.1109/IV.2009.42. 7, 14, 18 [BBD13] B ECK F., B URCH M., D IEHL S.: Matching application requirements with dynamic graph visualization profiles. In Proceedings of the 17th International Conference on Information Visualisation (2013), IV, IEEE, pp. 11–18. doi:10.1109/IV. 2013.2. 4, 7, 14 [BBDW14] B ECK F., B URCH M., D IEHL S., W EISKOPF D.: The state of the art in visualizing dynamic graphs. In EuroVis - STARs (2014), EuroVis, Eurographics Association, pp. 83–103. URL: http://www.visus.uni-stuttgart.de/uploads/ tx_vispublications/eurovis14-star.pdf, doi:10.2312/eurovisstar.20141174. 2, 6, 21 [BBL12] B OYANDIN I., B ERTINI E., L ALANNE D.: A qualitative study on the exploration of temporal changes in flow maps with animation and small-multiples. Computer Graphics Forum 31, 3pt2 (2012), 1005–1014. doi:10.1111/j. 1467-8659.2012.03093.x. 15, 16 [BBP08] B OITMANIS K., B RANDES U., P ICH C.: Visualizing internet evolution on the autonomous systems level. In Graph Drawing (2008), GD, Springer, pp. 365–376. doi:10.1007/ 978-3-540-77537-9_36. 16 [BBR∗ 14] B URCH M., B ECK F., R ASCHKE M., B LASCHECK T., W EISKOPF D.: A dynamic graph visualization perspective on eye movement data. In Proceedings of the Symposium on Eye Tracking Research and Applications (2014), ETRA, pp. 151– 158. doi:10.1145/2578153.2578175. 16, 19 [BBV∗ 12] B ECK F., B URCH M., V EHLOW C., D IEHL S., W EISKOPF D.: Rapid serial visual presentation in dynamic graph visualization. In Proceedings of the 2012 IEEE Symposium on Visual Languages and Human-Centric Computing (2012), VL/HCC, IEEE, pp. 185–192. doi:10.1109/ vlhcc.2012.6344514. 9, 13, 16 [BBW12] B URCH M., B ECK F., W EISKOPF D.: Radial Edge Splatting for visualizing dynamic directed graphs. In Proceedings of the 4th International Conference on Information Visualization Theory and Applications (2012), IVAPP, SciTePress, pp. 603–612. doi:10.5220/0003828506030612. 9, 11 [BC03] B RANDES U., C ORMAN S. R.: Visual unrolling of network evolution and the analysis of dynamic discourse. Information Visualization 2, 1 (2003), 40–50. doi:10.1057/ palgrave.ivs.9500037. 9, 11, 17 [BD08] B URCH M., D IEHL S.: TimeRadarTrees: Visualizing dynamic compound digraphs. Computer Graphics Forum 27, 3 (2008), 823–830. doi:10.1111/j.1467-8659.2008. 01213.x. 9, 13 [BDA∗ 14] BACH B., D RAGICEVIC P., A RCHAMBAULT D., H URTER C., C ARPENDALE S.: A review of temporal data visualizations based on space-time cube operations. In EuroVisSTARs (2014), EuroVis, The Eurographics Association, pp. 23– 41. doi:10.2312/eurovisstar.20141171. 3 [BdM06] B ENDER - DE M OLL S., M C FARLAND D. A.: The art and science of dynamic network visualization. Journal of Social Structure 7, 2 (2006), 1–38. URL: http://www.cmu.edu/joss/content/articles/ volume7/deMollMcFarland/. 16 [BFBD10] B URCH M., F RITZ M., B ECK F., D IEHL S.: TimeSpiderTrees: A novel visual metaphor for dynamic compound graphs. In Proceedings of the IEEE Symposium on Visual Languages and Human-Centric Computing (2010), VL/HCC, IEEE, pp. 168–175. doi:10.1109/vlhcc.2010.31. 9, 11 submitted to COMPUTER GRAPHICS Forum (11/2015).
23
[BFL12] B RASCH S., F UELLEN G., L INSEN L.: VENLO: Interactive visual exploration of aligned biological networks and their evolution. In Visualization in Medicine and Life Sciences II. Springer, 2012, pp. 229–247. doi:10.1007/ 978-3-642-21608-4_13. 16 [BFP06] B RANDES U., F LEISCHER D., P UPPE T.: Dynamic spectral layout of small worlds. In Graph Drawing (2006), GD, Springer, pp. 25–36. doi:10.1007/11618058_3. 8, 10 [BH06] B EYER D., H ASSAN A. E.: Animated visualization of software history using Evolution Storyboards. In Proceedings of the 13th Working Conference on Reverse Engineering (2006), WCRE, IEEE Computer Society, pp. 199–210. doi: 10.1109/wcre.2006.14. 16 [BHJ09] BASTIAN M., H EYMANN S., JACOMY M.: Gephi: an open source software for exploring and manipulating networks. In International AAAI Conference on Weblogs and Social Media (2009), ICWSM, The AAAI Press, pp. 361–362. URL: http://aaai.org/ocs/index. php/ICWSM/09/paper/view/154. 16 [BHP06] B RANDES U., H OEFER M., P ICH C.: Affiliation dynamics with an application to movie-actor biographies. In Proceedings of the 8th Joint Eurographics / IEEE VGTC Conference on Visualization (2006), EuroVis, Eurographics Association, pp. 179–186. doi:10.2312/VisSym/EuroVis06/ 179-186. 16 [BHRD∗ 15]
BACH B., H ENRY-R ICHE N., DWYER T., M AD T., F EKETE J.-D., G RABOWSKI T.: Small MultiPiles: Piling time to explore temporal patterns in dynamic networks. Computer Graphics Forum (2015). doi:10.1111/ cgf.12615. 9, 13 HYASTHA
[BHW11] B URCH M., H ÖFERLIN M., W EISKOPF D.: Layered TimeRadarTrees. In Proceedings of the 15th International Conference on Information Visualisation (2011), IV, IEEE, pp. 18– 25. doi:10.1109/IV.2011.93. 9, 13 [BIM12] B RANDES U., I NDLEKOFER N., M ADER M.: Visualization methods for longitudinal social networks and stochastic actor-oriented modeling. Social Networks 34, 3 (2012), 291–308. doi:10.1016/j.socnet.2011.06.002. 16 [BM12] B RANDES U., M ADER M.: A quantitative comparison of stress-minimization approaches for offline dynamic graph drawing. In Graph Drawing (2012), GD, Springer, pp. 99–110. doi:10.1007/978-3-642-25878-7_11. 14 [BMR∗ 12] B URCH M., M ÜLLER C., R EINA G., S CHMAUDER H., G REIS M., W EISKOPF D.: Visualizing dynamic call graphs. In Vision, Modeling & Visualization (2012), VMV, The Eurographics Association, pp. 207–214. doi:10.2312/PE/VMV/ VMV12/207-214. 16 [BMW15] B URCH M., M UNZ T., W EISKOPF D.: Edge-stacked timelines for visualizing dynamic weighted digraphs. In Proceedings of the International Conference on Information Visualization Theory and Applications (2015), IVAPP. doi:10. 5220/0005259200930100. 9, 12 [BN11] B RANDES U., N ICK B.: Asymmetric relations in longitudinal social networks. IEEE Transactions on Visualization and Computer Graphics 17, 12 (2011), 2283–2290. doi:10. 1109/TVCG.2011.169. 9, 13, 17, 18 [BPF14a] BACH B., P IETRIGA E., F EKETE J.-D.: GraphDiaries: Animated transitions and temporal navigation for dynamic networks. IEEE Transactions on Visualization and Computer Graphics 20, 5 (2014), 740–754. doi:10.1109/TVCG. 2013.254. 4, 8, 10, 14, 15 [BPF14b] BACH B., P IETRIGA E., F EKETE J.-D.: Visualizing dynamic networks with Matrix Cubes. In Procceedings of the
24
F. Beck, M. Burch, S. Diehl & D. Weiskopf / A Taxonomy and Survey of Dynamic Graph Visualization SICCHI Conference on Human Factors in Computing Systems (2014), CHI. doi:10.1145/2556288.2557010. 9, 13, 17
ing, GD. Springer-Verlag, 2002, pp. 23–31. doi:10.1007/ 3-540-36151-0_3. 8, 9, 10, 17
[Bra01] B RANKE J.: Dynamic graph drawing. In Drawing graphs. Springer, 2001, pp. 228–246. doi:10.1007/ 3-540-44969-8_9. 3
[DGK01] D IEHL S., G ÖRG C., K ERREN A.: Preserving the mental map using foresighted layout. In Proceedings of the 3rd Joint Eurographics–IEEE TCVG Conference on Visualization (2001), VisSym, Eurographics Association, pp. 175–184. doi:10.2312/VisSym/VisSym01/175-184. 8, 9
[BRSG07] B ENNETT C., RYALL J., S PALTEHOLZ L., G OOCH A.: The aesthetics of graph visualization. In Computational Aesthetics in Graphics, Visualization, and Imaging (2007), pp. 57–64. doi:10.2312/COMPAESTH/COMPAESTH07/ 057-064. 2, 14 [BS08] BAUR M., S CHANK T.: Dynamic Graph Drawing in Visone. Tech. rep., Fakultät für Informatik, Universität Karlsruhe, 2008. URL: http://digbib.ubka.uni-karlsruhe. de/volltexte/1000007990. 8, 9 [BSW13] B URCH M., S CHMIDT B., W EISKOPF D.: A matrixbased visualization for exploring dynamic compound digraphs. In Proceedings of the 17th International Conference Information Visualisation (2013), IV, IEEE, pp. 66–73. doi:10.1109/ IV.2013.8. 9, 12 [BVB∗ 11] B URCH M., V EHLOW C., B ECK F., D IEHL S., W EISKOPF D.: Parallel Edge Splatting for scalable dynamic graph visualization. IEEE Transactions on Visualization and Computer Graphics 17, 12 (2011), 2344–2353. doi:10. 1109/tvcg.2011.226. 9, 11, 17 [BW97] B RANDES U., WAGNER D.: A Bayesian paradigm for dynamic graph layout. In Graph Drawing (1997), GD, Springer, pp. 236–247. doi:10.1007/3-540-63938-1_66. 8 [BW15] B URCH M., W EISKOPF D.: Flip-book visualization of dynamic graphs. International Journal of Software and Informatics (2015). 9, 13 [CDBT∗ 92] C OHEN R. F., D I BATTISTA G., TAMASSIA R., T OLLIS I. G., B ERTOLAZZI P.: A framework for dynamic graph drawing. In Proceedings of the 8th Annual Symposium on Computational Geometry (1992), SoCG, ACM, pp. 261–270. doi:10.1145/142675.142728. 8, 10 [CDBTT95] C OHEN R. F., D I BATTISTA G., TAMASSIA R., T OLLIS I. G.: Dynamic graph drawings: Trees, series-parallel digraphs, and st-digraphs. SIAM Journal on Computing 24, 5 (1995), 970–1001. doi:10.1137/S0097539792235724. 8, 10 [Che06] C HEN C.: CiteSpace II: Detecting and visualizing emerging trends and transient patterns in scientific literature. Journal of the American Society for Information Science and Technology 57, 3 (2006), 359–377. doi:10.1002/asi. 20317. 16 [CKN∗ 03] C OLLBERG C., KOBOUROV S. G., NAGRA J., P ITTS J., WAMPLER K.: A system for graph-based visualization of the evolution of software. In Proceedings of the 2003 ACM Symposium on Software Visualization (2003), SoftVis, ACM, pp. 77–86. doi:10.1145/774833.774844. 16 [CTB13] C ENGIZ T URKER U., BALCISOY S.: A visualization technique for large temporal social network datasets in hyperbolic space. Journal of Visual Languages & Computing 25, 3 (2013), 227–242. doi:10.1016/j.jvlc.2013.10.008. 14, 16 [DE02] DWYER T., E ADES P.: Visualising a fund manager flow graph with columns and worms. In Proceedings of the 6th International Conference on Information Visualisation (2002), IV, IEEE, pp. 147–152. doi:10.1109/IV.2002.1028770. 9, 11, 16 [DG02] D IEHL S., G ÖRG C.: Graphs, they are changing – dynamic graph drawing for a sequence of graphs. In Graph Draw-
[EHK∗ 04a] E RTEN C., H ARDING P. J., KOBOUROV S. G., WAMPLER K., Y EE G. V.: Exploring the computing literature using temporal graph visualization. In Visualization and Data Analysis (2004), VDA, pp. 45–56. doi:10.1117/12. 539245. 16 [EHK∗ 04b] E RTEN C., H ARDING P. J., KOBOUROV S. G., WAMPLER K., Y EE G. V.: GraphAEL: Graph animations with evolving layouts graph drawing. In Graph Drawing, GD. Springer, 2004, pp. 98–110. doi:10.1007/ 978-3-540-24595-7_9. 8, 9 [EKLN04] E RTEN C., KOBOUROV S. G., L E V., NAVABI A.: Simultaneous graph drawing: Layout algorithms and visualization schemes. In Graph Drawing (2004), GD, Springer, pp. 437–449. doi:10.1007/978-3-540-24595-7_41. 9, 11 [ELMS91] E ADES P., L AI W., M ISUE K., S UGIYAMA K.: Preserving the mental map of a diagram. Tech. rep., International Institute for Advanced Study of Social Information Science, Fujitsu Limited, 1991. URL: http://www.cs.tsukuba.ac.jp/~misue/ publications/techreport/iias-rr-91-16e.pdf. 2 [ET03] E LMQVIST N., T SIGAS P.: Causality visualization using animated growing polygons. In Proceedings of the 2003 IEEE Symposium on Information Visualization (2003), InfoVis, IEEE, pp. 189–196. doi:10.1109/INFVIS.2003.1249025. 15, 16 [FAM∗ 11]
F EDERICO P., A IGNER W., M IKSCH S., W IND F., Z ENK L.: A visual analytics approach to dynamic social networks. In Proceedings of the 11th International Conference on Knowledge Management and Knowledge Technologies (2011), i-KNOW, p. 47. doi:10.1145/2024288. 2024344. 9, 12 HAGER
[FE01] F RIEDRICH C., E ADES P.: The Marey graph animation tool demo. In Graph Drawing (2001), GD, Springer, pp. 396– 406. doi:10.1007/3-540-44541-2_37. 8, 10 [FE02] F RIEDRICH C., E ADES P.: Graph drawing in motion. Journal of Graph Algorithms and Applications 6, 3 (2002), 353– 370. doi:10.7155/jgaa.00057. 8, 10 [FH02] F RIEDRICH C., H OULE M. E.: Graph drawing in motion II. In Graph Drawing (2002), GD, Springer, pp. 220–231. doi: 10.1007/3-540-45848-4_18. 8, 10 [FHQ11] FARRUGIA M., H URLEY N., Q UIGLEY A. J.: Exploring temporal ego networks using small multiples and treering layouts. In Proceedings of the 4th International Conference on Advances in Computer-Human Interactions (2011), ACHI, pp. 79–88. URL: http://hcibib.org/ACHI11. 9, 11 [FKN∗ 05] F ORRESTER D., KOBOUROV S. G., NAVABI A., WAMPLER K., Y EE G. V.: graphael: A system for generalized force-directed layouts. In Graph drawing (2005), GD, Springer, pp. 454–464. doi:10.1007/978-3-540-31843-9_47. 8, 9 [FQ11] FARRUGIA M., Q UIGLEY A. J.: Effective temporal graph layout: A comparative study of animation versus static display methods. Information Visualization 10, 1 (2011), 47–64. doi: 10.1057/ivs.2010.10. 15 submitted to COMPUTER GRAPHICS Forum (11/2015).
F. Beck, M. Burch, S. Diehl & D. Weiskopf / A Taxonomy and Survey of Dynamic Graph Visualization
25
[FT04] F RISHMAN Y., TAL A.: Dynamic drawing of clustered graphs. In Proceedings of the 2004 IEEE Symposium on Information Visualization (2004), InfoVis, IEEE, pp. 191–198. doi: 10.1109/INFVIS.2004.18. 8, 10, 14
[GW06] G AERTLER M., WAGNER D.: A hybrid model for drawing dynamic and evolving graphs. In Graph Drawing (2006), GD, Springer, pp. 189–200. doi:10.1007/11618058_18. 9
[FT08a] F RISHMAN Y., TAL A.: MOVIS: A system for visualizing distributed mobile object environments. Journal of Visual Languages & Computing 19, 3 (2008), 303–320. doi: 10.1016/j.jvlc.2007.07.006. 16
[HBW14] H LAWATSCH M., B URCH M., W EISKOPF D.: Visual adjacency lists for dynamic graphs. IEEE Transactions on Visualization and Computer Graphics (2014), 1590–1603. doi:10.1109/TVCG.2014.2322594. 9, 13, 15
[FT08b] F RISHMAN Y., TAL A.: Online dynamic graph drawing. IEEE Transactions on Visualization and Computer Graphics 14, 4 (2008), 727–740. doi:10.1109/tvcg.2008.11. 8, 14, 17
[HEF∗ 13] H URTER C., E RSOY O., FABRIKANT S. I., K LEIN T., T ELEA A.: Bundled visualization of dynamic graph and trail data. IEEE Transactions on Visualization and Computer Graphics (2013). doi:10.1109/TVCG.2013.246. 8, 10, 16, 17, 18, 19
[FWSL12] F ENG K.-C., WANG C., S HEN H.-W., L EE T.-Y.: Coherent time-varying graph drawing with multifocus+context interaction. IEEE Transactions on Visualization and Computer Graphics 18, 8 (2012), 1330–1342. doi:10.1109/TVCG. 2011.128. 8, 9, 14 [GAM14] G RABOWICZ P. A., A IELLO L. M., M ENCZER F.: Fast filtering and animation of large dynamic networks. EPJ Data Science 3, 1 (2014), 1–16. doi:10.1140/epjds/ s13688-014-0027-8. 8 [GAW∗ 11] G LEICHER M., A LBERS D., WALKER R., J USUFI I., H ANSEN C. D., ROBERTS J. C.: Visual comparison for information visualization. Information Visualization 10, 4 (2011), 289– 309. doi:10.1177/1473871611416549. 11 [GBD09] G REILICH M., B URCH M., D IEHL S.: Visualizing the evolution of compound digraphs with TimeArcTrees. Computer Graphics Forum 28, 3 (2009), 975–982. doi:10.1111/j. 1467-8659.2009.01451.x. 9, 11, 16 [GBPD05] G ÖRG C., B IRKE P., P OHL M., D IEHL S.: Dynamic graph drawing of sequences of orthogonal and hierarchical graphs. In Graph Drawing (2005), GD, Springer, pp. 228–238. doi:10.1007/978-3-540-31843-9_24. 8, 9 [GdBG12] G OROCHOWSKI T. E., DI B ERNARDO M., G RIER SON C. S.: Using aging to visually uncover evolutionary processes on networks. IEEE Transactions on Visualization and Computer Graphics 18, 8 (2012), 1343–1352. doi:10.1109/ TVCG.2011.142. 8, 14 [GEY12] G HANI S., E LMQVIST N., Y I J. S.: Perception of animated node-link diagrams for dynamic graphs. Computer Graphics Forum 31, 3pt3 (2012), 1205–1214. doi:10.1111/j. 1467-8659.2012.03113.x. 15 [GFC05] G HONIEM M., F EKETE J.-D., C ASTAGLIOLA P.: On the readability of graphs using node-link and matrix-based representations: A controlled experiment and statistical analysis. Information Visualization 4, 2 (2005), 114–135. doi:10.1057/ palgrave.ivs.9500092. 12, 18 [GHN13] G ANSNER E. R., H U Y., N ORTH S. C.: Interactive visualization of streaming text data with dynamic maps. Journal of Graph Algorithms and Applications 17, 4 (2013), 515–540. doi:10.7155/jgaa.00302. 16 [GHW09] G ROH G., H ANSTEIN H., W ÖRNDL W.: Interactively visualizing dynamic social networks with DySoN. In Proceedings of the 2009 Workshop on Visual Interfaces to the Social and the Semantic Web (2009), VISSW. URL: http://data.semanticweb.org/workshop/VISSW/ 2009/paper/main/10/html. 9, 12 [GLW06] G REEVY O., L ANZA M., W YSSEIER C.: Visualizing live software systems in 3D. In Proceedings of the 2006 ACM Symposium on Software Visualization (2006), SoftVis, ACM, pp. 47–56. doi:10.1145/1148493.1148501. 16 submitted to COMPUTER GRAPHICS Forum (11/2015).
[HEW98] H UANG M. L., E ADES P., WANG J.: On-line animated visualization of huge graphs using a modified spring algorithm. Journal of Visual Languages & Computing 9, 6 (1998), 623–645. doi:10.1006/jvlc.1998.0094. 8, 10 [HF07] H ENRY N., F EKETE J.-D.: MatLink: Enhanced matrix visualization for analyzing social networks. In Proceedings of the 11th IFIP TC 13 International Conference on Human-Computer Interaction (2007), INTERACT, Springer, pp. 288–302. doi: 10.1007/978-3-540-74800-7\_24. 18 [HFM07] H ENRY N., F EKETE J. D., M CGUFFIN M. J.: NodeTrix: a hybrid visualization of social networks. IEEE Transactions on Visualization and Computer Graphics 13, 6 (2007), 1302–1309. doi:10.1109/tvcg.2007.70582. 18 [HKV12] H U Y., KOBOUROV S. G., V EERAMONI S.: Embedding, clustering and coloring for dynamic maps. In Proceedings of the 2012 IEEE Pacific Visualization Symposium (2012), PacificVis, IEEE Computer Society, pp. 33–40. doi:10.1109/ PacificVis.2012.6183571. 8, 10 [HMHU13] H AYASHI A., M ATSUBAYASHI T., H OSHIDE T., U CHIYAMA T.: Initial positioning method for online and realtime dynamic graph drawing of time varying data. In Proceedings of the 17th International Conference on Information Visualisation (2013), IV, IEEE, pp. 435–444. doi:10.1109/IV. 2013.57. 8, 14 [HSS11] H ADLAK S., S CHULZ H.-J., S CHUMANN H.: In situ exploration of large dynamic networks. IEEE Transactions on Visualization and Computer Graphics 17, 12 (2011), 2334–2343. doi:10.1109/TVCG.2011.213. 9, 13, 18 [HSS15] H ADLAK S., S CHUMANN H., S CHULZ H.-J.: A survey of multi-faceted graph visualization. In Eurographics Conference on Visualization (EuroVis) - STARs (2015), EuroVis, The Eurographics Association. doi:10.2312/eurovisstar. 20151109. 3, 4 [IA12] I TOH M., A KAISHI M.: Visualizing for changes in relationships between historical figures in chronicles. In Proceedings of the 16th International Conference on Information Visualisation (2012), IV, IEEE, pp. 283–290. doi:10.1109/IV. 2012.55. 16, 19 [ITK10] I TOH M., T OYODA M., K ITSUREGAWA M.: An interactive visualization framework for time-series of web graphs in a 3D environment. In Proceedings of the 14th International Conference on Information Visualisation (2010), IV, IEEE, pp. 54– 60. doi:10.1109/IV.2010.18. 9, 12 [IYTK12]
I TOH M., YOSHINAGA N., T OYODA M., K ITSURE M.: Analysis and visualization of temporal changes in bloggers’ activities and interests. In Proceeding of the 2012 IEEE Pacific Visualization Symposium (2012), PacificVis, IEEE, pp. 57–64. doi:10.1109/PacificVis.2012.6183574. 16 GAWA
26
F. Beck, M. Burch, S. Diehl & D. Weiskopf / A Taxonomy and Survey of Dynamic Graph Visualization
[JE12] JAVED W., E LMQVIST N.: Exploring the design space of composite visualization. In Proceeding of the IEEE Pacific Visualization Symposium (2012), PacificVis, IEEE, pp. 1–8. doi:10.1109/PacificVis.2012.6183556. 11 [JSS∗ 12]
J OHN M., S CHULZ H.-J., S CHUMANN H., U HRMA A. M., U NGER A.: Constructing and visualizing chemical reaction networks from pi-calculus models. Formal Aspects of Computing 25, 5 (2012), 723–742. doi:10.1007/ s00165-011-0209-0. 16 CHER
[KEC06] K ELLER R., E CKERT C. M., C LARKSON P. J.: Matrices or node-link diagrams: which visual representation is better for visualising connectivity models? Information Visualization 5, 1 (2006), 62–76. doi:10.1057/palgrave.ivs. 9500116. 12, 18 [KG06] K UMAR G., G ARLAND M.: Visual exploration of complex time-varying graphs. IEEE Transactions on Visualization and Computer Graphics 12, 5 (2006), 805–812. doi:10. 1109/tvcg.2006.193. 8, 10 [Kit94] K ITCHIN R. M.: Cognitive maps: What are they and why study them? Journal of Environmental Psychology 14, 1 (1994), 1–19. doi:10.1016/S0272-4944(05)80194-X. 2 [KKC14] K ERRACHER N., K ENNEDY J., C HALMERS K.: The design space of temporal graph visualisation. In EuroVis - Short Papers (2014), Eurographics Assocation, pp. 7–11. doi:10. 2312/eurovisshort.20141149. 3, 7, 13 [KKC15] K ERRACHER N., K ENNEDY J., C HALMERS K.: A task taxonomy for temporal graph visualisation. IEEE Transactions on Visualization and Computer Graphics (2015). doi: 10.1109/TVCG.2015.2424889. 4, 14 [KKCG15] K ERRACHER N., K ENNEDY J., C HALMERS K., G RAHAM M.: Visual Techniques to Support Exploratory Analysis of Temporal Graph Data. In Eurographics Conference on Visualization (EuroVis) - Short Papers (2015), EuroVis, The Eurographics Association. doi:10.2312/eurovisshort. 20151133. 14 [KLRZ95] K IMELMAN D., L EBAN B., ROTH T., Z ERNIK D.: Reduction of visual complexity in dynamic graphs. In Graph Drawing (1995), GD, Springer, pp. 218–225. doi:10.1007/ 3-540-58950-3_373. 16 [Kob13] KOBOUROV S. G.: Force-directed drawing algorithms. In Handbook of Graph Drawing and Visualization. CRC, 2013, pp. 383–408. URL: https://cs.brown.edu/~rt/ gdhandbook/. 3 [LD08] L OUBIER E., D OUSSET B.: Temporal and relational data representation by graph morphing. Safety and Reliability for Managing Risk 14, 02 (2008), 2008–16. 8, 10 [LLY06] L EE Y.-Y., L IN C.-C., Y EN H.-C.: Mental map preserving graph drawing using simulated annealing. In Proceedings of the 2006 Asia-Pacific Symposium on Information Visualisation (2006), APVis, Australian Computer Society, Inc., pp. 179–188. 8 [LPP∗ 06] L EE B., P LAISANT C., PARR C. S., F EKETE J. D., H ENRY N.: Task taxonomy for graph visualization. In Proceedings of the 2006 AVI workshop on BEyond time and errors (New York, NY, USA, 2006), BELIV, ACM, pp. 1–5. doi: 10.1145/1168149.1168168. 4, 14 [LQC∗ 13] L I Q., Q U H., C HEN L., WANG R., YONG J., S I D.: Visual analysis of retweeting propagation network in a microblogging platform. In Proceedings of the 6th International Symposium on Visual Information Communication and Interaction (2013), VINCI, ACM, pp. 44–53. doi:10.1145/ 2493102.2493108. 16
[LSCL10] L IN Y.-R., S UN J., C AO N., L IU S.: ContexTour: Contextual contour visual analysis on dynamic multi-relational clustering. In Proceedings of the 2010 SIAM International Conference on Data Mining (2010), SDM, pp. 418–429. doi: 10.1137/1.9781611972801.37. 8, 10, 14 [LSW13] L IAO Q., S HI L., WANG C.: Visual analysis of largescale network anomalies. IBM Journal of Research and Development 57, 3/4 (2013), 13:1–13:12. doi:10.1147/JRD.2013. 2249356. 16 [MELS95] M ISUE K., E ADES P., L AI W., S UGIYAMA K.: Layout adjustment and the mental map. Journal of Visual Languages & Computing 6, 2 (1995), 183–210. doi:10.1006/jvlc. 1995.1010. 2, 8, 17 [MKH12] M ASHIMA D., KOBOUROV S. G., H U Y.: Visualizing dynamic data with maps. IEEE Transactions on Visualization and Computer Graphics 18, 9 (2012), 1424–1437. doi:10. 1109/TVCG.2011.288. 8, 10 [MMBd05] M OODY J., M C FARLAND D. A., B ENDER DE M OLL S.: Dynamic network visualisation. American Journal of Sociology 110, 4 (2005), 1206–1241. doi:10.1086/421509. 16 [NF02] N ESBITT K. V., F RIEDRICH C.: Applying gestalt principles to animated visualizations of network data. In Proceedings of the 6th International Conference on Information Visualisation (2002), IV, IEEE, pp. 737–743. doi:10.1109/IV.2002. 1028859. 8, 10 [Nor96] N ORTH S. C.: Incremental layout in DynaDAG. In Graph Drawing (1996), GD, Springer, pp. 409–418. doi: 10.1007/BFb0021824. 8, 10 [OKK13] O ELKE D., KOKKINAKIS D., K EIM D. A.: Fingerprint Matrices: Uncovering the dynamics of social networks in prose literature. Computer Graphics Forum 32, 3pt4 (2013), 371–380. doi:10.1111/cgf.12124. 16, 19 [OM08] O GAWA M., M A K.-L.: StarGate: A unified, interactive visualization of software projects. In Proceedings of the IEEE Pacific Visualization Symposium (2008), PacificVis, IEEE, pp. 191–198. doi:10.1109/PACIFICVIS.2008. 4475476. 16 [OM09] O GAWA M., M A K.-L.: code_swarm: A design study in organic software visualization. IEEE Transactions on Visualization and Computer Graphics 15, 6 (2009), 1097–1104. doi:10.1109/TVCG.2009.123. 16 [PB08] P OHL M., B IRKE P.: Interactive exploration of large dynamic networks. In Proceedings of the 10th International Conference on Visual Information Systems (2008), VISUAL, Springer-Verlag, pp. 56–67. doi:10.1007/ 978-3-540-85891-1\_8. 8, 10 [PHG07] P URCHASE H. C., H OGGAN E., G ÖRG C.: How important is the “mental map”? – an empirical investigation of a dynamic graph layout algorithm graph drawing. In Graph Drawing, GD. Springer, 2007, pp. 184–195. doi:10.1007/ 978-3-540-70904-6_19. 15 [PS08] P URCHASE H. C., S AMRA A.: Extremes are better: Investigating mental map preservation in dynamic graphs. In Diagrammatic Representation and Inference, Diagrams. Springer, 2008, pp. 60–73. doi:10.1007/978-3-540-87730-1_ 9. 15 [PT10] P UPYREV S., T IKHONOV A.: Analyzing conversations with dynamic graph visualization. In Proceedings of the 10th International Conference on Intelligent Systems Design and Applications (2010), ISDA, IEEE, pp. 748–753. doi:10.1109/ ISDA.2010.5687175. 16 submitted to COMPUTER GRAPHICS Forum (11/2015).
F. Beck, M. Burch, S. Diehl & D. Weiskopf / A Taxonomy and Survey of Dynamic Graph Visualization [RD10] R EY G. D., D IEHL S.: Controlling presentation speed, labels, and tooltips in interactive dynamic graphs. Journal of Media Psychology: Theories, Methods, and Applications 22, 4 (2010), 160–170. doi:10.1027/1864-1105/a000021. 15
27
[STT81] S UGIYAMA K., TAGAWA S., T ODA M.: Methods for visual understanding of hierarchical system structures. IEEE Transactions on Systems, Man, and Cybernetics 11, 2 (1981), 109–125. doi:10.1109/tsmc.1981.4308636. 10
[Rei10] R EITZ F.: A framework for an ego-centered and time-aware visualization of relations in arbitrary data repositories. arXiv preprint arXiv:1009.5183 (2010). URL: http: //arxiv.org/abs/1009.5183. 9, 12, 16
[SWS10] S TEIN K., W EGENER R., S CHLIEDER C.: Pixeloriented visualization of change in social networks. In Proceedings of the 2010 International Conference on Advances in Social Networks Analysis and Mining (2010), ASONAM, IEEE, pp. 233–240. doi:10.1109/asonam.2010.18. 9, 13
[RM13] RUFIANGE S., M C G UFFIN M. J.: DiffAni: Visualizing dynamic graphs with a hybrid of difference maps and animation. IEEE Transactions on Visualization and Computer Graphics 19, 12 (2013), 2556–2565. doi:10.1109/TVCG.2013.149. 9, 13, 15, 18
[SWW∗ 15] S HI L., WANG C., W EN Z., Q U H., L IN C., L IAO Q.: 1.5D egocentric dynamic network visualization. IEEE Transactions on Visualization and Computer Graphics 21 (2015), 624– 637. doi:10.1109/TVCG.2014.2383380. 9, 12, 15
[RM14] RUFIANGE S., M ELANÇON G.: AniMatrix: A matrix-based visualization of software evolution. In Proceedings of the 2nd IEEE Working Conference on Software Visualization (2014), VISSOFT, pp. 137–146. URL: http://conferences.computer.org/vissoft/ 2014/papers/6150a137.pdf. 8, 10, 16, 18 [RPD09] R EITZ F., P OHL M., D IEHL S.: Focused animation of dynamic compound digraphs. In Proceedings of the 13th International Conference on Information Visualisation (2009), IV, IEEE, pp. 679–684. doi:10.1109/iv.2009.24. 8, 10 [RUK∗ 10] ROHRSCHNEIDER M., U LLRICH A., K ERREN A., S TADLER P. F., S CHEUERMANN G.: Visual network analysis of dynamic metabolic pathways. In Advances in Visual Computing, ISVC. Springer, 2010, pp. 316–327. doi:10.1007/ 978-3-642-17289-2_31. 16
[TK05] T OYODA M., K ITSUREGAWA M.: A system for visualizing and analyzing the evolution of the web with a time series of graphs. In Proceedings of the 16th ACM Conference on Hypertext and Hypermedia (2005), HYPERTEXT, ACM, pp. 151–160. doi:10.1145/1083356.1083387. 16 [TMB02] T VERSKY B., M ORRISON J. B., B ETRANCOURT M.: Animation: can it facilitate? International Journal of HumanComputer Studies 57, 4 (2002), 247–262. doi:10.1006/ ijhc.2002.1017. 11 [Tri06] T RIER M.: Towards a social network intelligence tool for visual analysis of virtual communication networks. In Virtuelle Organisationen und Neue Medien (2006), TUDPress, pp. 331– 342. 16 [Tuf06] T UFTE E. R.: Beautiful Evidence, 1st ed. Graphics Press, 2006. doi:10.1177/0021943607306139. 12
[SBW15] S CHMAUDER H., B URCH M., W EISKOPF D.: Visualizing dynamic weighted digraphs with partial links. In Proceedings of the International Conference on Information Visualization Theory and Application (2015), IVAPP. doi:10.5220/ 0005303801230130. 9, 12, 16
[VBAW14] V EHLOW C., B ECK F., AUWÄRTER P., W EISKOPF D.: Visualizing the evolution of communities in dynamic graphs. Computer Graphics Forum 34, 1 (2014), 277–288. doi:10. 1111/cgf.12512. 9, 11, 17
[SFW∗ 14] S MUC M., F EDERICO P., W INDHAGER F., A IGNER W., Z ENK L., M IKSCH S.: How do you connect moving dots? insights from user studies on dynamic network visualizations. In Handbook of Human Centric Visualization. Springer, 2014, pp. 623–650. doi:10.1007/978-1-4614-7485-2_25. 15
[VBSW13] V EHLOW C., B URCH M., S CHMAUDER H., W EISKOPF D.: Radial layered matrix visualization of dynamic graphs. In Proceedings of the 17th International Conference Information Visualisation (2013), IV, IEEE, pp. 51–58. doi:10.1109/IV.2013.6. 9, 13
[SLN05] S ARAIYA P., L EE P., N ORTH C.: Visualization of graphs with associated timeseries data. In Proceedings of the 2005 IEEE Symposium on Information Visualization (2005), InfoVis, IEEE Computer Society, pp. 225–232. doi:10.1109/ INFVIS.2005.1532151. 15
[VBW15] V EHLOW C., B ECK F., W EISKOPF D.: The state of the art in visualizing group structures in graphs. In Eurographics Conference on Visualization (EuroVis) - STARs (2015), EuroVis, The Eurographics Association. doi:10.2312/ eurovisstar.20151110. 3, 4
[SMM12] S ALLABERRY A., M UELDER C., M A K.-L.: Clustering, visualizing, and navigating for large dynamic graphs. In Graph Drawing (2012), GD, Springer, pp. 487–498. doi: 10.1007/978-3-642-36763-2_43. 9, 13
[vdEHBvW13] VAN DEN E LZEN S., H OLTEN D., B LAAS J., VAN W IJK J. J.: Dynamic network visualization with extended massive sequence views. IEEE Transactions on Visualization and Computer Graphics 20, 8 (2013), 1087–1099. doi:10.1109/ TVCG.2013.263. 9, 12
[SNF10] S TAB C., NAZEMI K., F ELLNER D. W.: SemaTime – timeline visualization of time-dependent relations and semantics. In Advances in Visual Computing, ISVC. Springer, 2010, pp. 514–523. doi:10.1007/978-3-642-17277-9_53. 16
[VHK∗ 13] V EHLOW C., H ASENAUER J., K RAMER A., R AUE A., H UG S., T IMMER J., R ADDE N., T HEIS F. J., W EISKOPF D.: iVUN: interactive visualization of uncertain biochemical reaction networks. BMC Bioinformatics 14, Suppl 19 (2013), S2. doi:10.1186/1471-2105-14-S19-S2. 16, 18
[SP08] S AFFREY P., P URCHASE H. C.: The “mental map” versus “static aesthetic” compromise in dynamic graphs: a user study. In Proceedings of the 9th Conference on Australasian User Interface (2008), AUIC, Australian Computer Society, Inc., pp. 85– 93. 15 [SQ07] S HANNON R., Q UIGLEY A. J.: Considerations in dynamic graph drawing: A survey, 2007. URL: http: //rossshannon.com/publications/softcopies/ rs2007-dynamic-graphs-survey.pdf. 3 submitted to COMPUTER GRAPHICS Forum (11/2015).
[vLDBF13] VON L ANDESBERGER T., D IEL S., B REMM S., F ELLNER D. W.: Visual analysis of contagion in networks. Information Visualization (2013). doi:10.1177/ 1473871613487087. 16, 19 [vLKS∗ 11] VON L ANDESBERGER T., K UIJPER A., S CHRECK T., KOHLHAMMER J., VAN W IJK J. J., F EKETE J.-D., F ELL NER D. W.: Visual analysis of large graphs. Computer Graphics Forum 30, 6 (2011), 1719–1749. doi:10.1111/j. 1467-8659.2011.01898.x. 1, 3, 18
28
F. Beck, M. Burch, S. Diehl & D. Weiskopf / A Taxonomy and Survey of Dynamic Graph Visualization
[WZF11] W INDHAGER F., Z ENK L., F EDERICO P.: Visual enterprise network analytics – visualizing organizational change. Procedia – Social and Behavioral Sciences 22 (2011), 59–68. doi:10.1016/j.sbspro.2011.07.056. 3 [YAPM08] YANG X., A SUR S., PARTHASARATHY S., M EHTA S.: A visual-analytic toolkit for dynamic interaction graphs. In Proceedings of the 14th ACM SIGKDD International Conference on Knowledge Discovery and Data Mining (2008), KDD, ACM, pp. 1016–1024. doi:10.1145/1401890.1402011. 16 [YEL10] Y I J. S., E LMQVIST N., L EE S.: TimeMatrix: Analyzing temporal social networks using interactive matrix-based visualizations. International Journal of Human-Computer Interaction 26, 11-12 (2010), 1031–1051. doi:10.1080/ 10447318.2010.516722. 9, 12, 18 [ZKS11] Z AMAN L., K ALRA A., S TUERZLINGER W.: The effect of animation, dual view, difference layers, and relative relayout in hierarchical diagram differencing. In Proceedings of Graphics Interface 2011 (2011), GI, Canadian Human-Computer Communications Society, pp. 183–190. 15 [ZMS14] Z AIDI F., M UELDER C., S ALLABERRY A.: Analysis and visualization of dynamic networks. arXiv preprint arXiv:1409.5034 (2014). URL: http://arxiv.org/abs/ 1409.5034. 3
submitted to COMPUTER GRAPHICS Forum (11/2015).