Apr 10, 2013 - Manufacturers of smartphones using Google's Android operating system plan to ..... Correlating financial time series with micro-blogging data.
Brett Drury A Text Mining System for Evaluating the Stock Market's Response To News.
Doctoral Program in Computer Science of the Universities of Minho, Aveiro and Porto
April 10, 2013
Brett Drury A Text Mining System for Evaluating the Stock Market's Response To News.
Thesis submitted to Faculty of Sciences of the University of Porto for the Doctor Degree in Computer Science within the Joint Doctoral Program in Computer Science of the Universities of Minho, Aveiro and Porto
Departamento de Ciência de Computadores Faculdade de Ciências da Universidade do Porto April 10, 2013
3
I would like to dedicate my thesis to: my wife, Helena Morais, my son Samuel, and my parents, Michael and Sue Drury.
4
Acknowledgements This Ph.D. was undertaken in the Department of Computer Science at the University of Porto under the supervision of Luis Torgo and José João Dias de Almeida. I would like, in particular, to thank Luis Torgo for his patience and his continual support for the duration of this Ph.D., especially in the writing up phase. I would like to thank the support sta� in the Department of Computer Science, especially Hugo Ribeiro. I would also like to thank Justino Soares and Carlos Soares who managed to persuade the management at my previous employers to allow me time to work on my Ph.D., without his assistance I would have not been able to continue on the doctoral program. I would like to thank my co-authors, Gael Dias, José João Dias de Almeida and Helena Morais for their contribution to my work. Lastly, I would like to thank the organizers and lecturers involved in the MAPi doctoral program.
Preface This thesis was submitted in partial ful�llment of the requirements for the degree of Doctor of Philosophy in Computer Science awarded by the MAPi Joint Doctoral Programme. The work presented in this thesis is the culmination of 4 years of work under the supervision of Prof. Luis Torgo from the University of Porto and Jose João Dias de Almeida from the University of Minho.
Abstract This thesis presents a text mining system which was designed to predict the direction of a share or �nancial market. The text mining system is a complete pipeline which: 1. scrapes new stories from the Internet, 2. extracts news text from the scraped news stories, 3. identi�es relevant news stories for a speci�c company or �nancial market, 4. classi�es sentences, news stories and quotes and 5. makes a trading inference using these classi�cations. The thesis documents advances in 1.
ontology construction and maintenance, 2.
�ne
grained event and sentiment extraction and classi�cation at the sentence level, 3. news story classi�cation, 4.
direct speech classi�cation and 5.
information retrieval.
These advances
were also contributions to the �elds of semi-supervised learning and ontology engineering. The advances in the news classi�cation at the document, sentence and direct speech level demonstrate measurable advantages in trading experiments on the FTSE 250 �nancial markets over competing text classi�cation strategies.
The complete system, however, did not
demonstrate a measurable trading advantage in experiments conducted on the shares of Apple, Google, IBM and Microsoft. systems.
The system, however, provides a blueprint for future
Resumo Nesta tese é apresentado um sistema de" text mining" que foi concebido para prever a direcção de movimento de uma acção ou mercado �nanceiro. O sistema de "text mining" é uma "pipeline" completa que: 1. extrai noticias da internet; 2. extrai o texto das noticias, 3. identi�ca noticias relevantes para uma empresa especi�ca ou mercado �nanceiro, 4. classi�ca frases, noticias e citações, 5. faz uma previsão de negociações usando essas classi�cações. A tese descreve avanços em 1. construção e manutenção de ontologias, 2. extracção precisa de eventos e sentimento, e classi�cação ao nível da frase, 4.
caracterização de discurso
directo, 5. obtenção de informação. Estes avanços são também contribuições nos campos de "semi-supervised learning" e engenharia de ontologias. Os avanços na classi�cação de noticias ao nível do documento, frase e discurso directo, demonstram vantagens consideráveis em experiências de negociação no FTSE 250, face a outras estratégias. O sistema completo não demonstra, no entanto, uma vantagem signi�cativa em experiências de negociação de acções da Apple, Google, IBM e Microsoft. O sistema fornece, no entanto, um "blueprint" para sistemas futuros.
Contents List of Tables
7
List of Figures
9
1 Overview 1.1
10
Introduction . . . . . . . . . . . . . . . . . . . . . . . . . . . . . . . . . . . . .
10
1.1.1
Problem De�nition . . . . . . . . . . . . . . . . . . . . . . . . . . . . .
10
Literature Review . . . . . . . . . . . . . . . . . . . . . . . . . . . . . . . . . .
12
1.2.1
Economic Literature
. . . . . . . . . . . . . . . . . . . . . . . . . . . .
12
1.2.2
Existing Systems . . . . . . . . . . . . . . . . . . . . . . . . . . . . . .
16
1.3
Main Contributions . . . . . . . . . . . . . . . . . . . . . . . . . . . . . . . . .
19
1.4
Organization of Thesis . . . . . . . . . . . . . . . . . . . . . . . . . . . . . . .
24
1.2
2 News Web Crawler and Text Extraction
27
2.1
News Crawler . . . . . . . . . . . . . . . . . . . . . . . . . . . . . . . . . . . .
27
2.2
Text Extraction . . . . . . . . . . . . . . . . . . . . . . . . . . . . . . . . . . .
28
2.2.1
Initial attempts . . . . . . . . . . . . . . . . . . . . . . . . . . . . . . .
28
2.2.2
Text Extraction Literature Review
. . . . . . . . . . . . . . . . . . . .
29
2.2.3
Proposed Strategy
. . . . . . . . . . . . . . . . . . . . . . . . . . . . .
30
2.2.4
Evaluation . . . . . . . . . . . . . . . . . . . . . . . . . . . . . . . . . .
32
2.3
Addition of Meta-Data . . . . . . . . . . . . . . . . . . . . . . . . . . . . . . .
37
2.4
Summary
37
. . . . . . . . . . . . . . . . . . . . . . . . . . . . . . . . . . . . . .
3 Ontology-based Information Retrieval 2
38
3.1
3.2
3.3
3.4
3.5
Related Work . . . . . . . . . . . . . . . . . . . . . . . . . . . . . . . . . . . .
40
3.1.1
Ontology Construction . . . . . . . . . . . . . . . . . . . . . . . . . . .
40
3.1.2
Ontology Maintenance . . . . . . . . . . . . . . . . . . . . . . . . . . .
41
3.1.3
Query Expansion . . . . . . . . . . . . . . . . . . . . . . . . . . . . . .
43
3.1.4
News Recommendation
. . . . . . . . . . . . . . . . . . . . . . . . . .
43
. . . . . . . . . . . . . . . . . . . . . . . . . . . . . . . . .
45
3.2.1
Industry Sectors Identi�cation . . . . . . . . . . . . . . . . . . . . . . .
45
3.2.2
Assigning Companies to Industry Sectors
. . . . . . . . . . . . . . . .
47
3.2.3
Ontology Re�nements
. . . . . . . . . . . . . . . . . . . . . . . . . . .
49
. . . . . . . . . . . . . . . . . . . . . . . . . . . .
50
3.3.1
Ontology Construction . . . . . . . . . . . . . . . . . . . . . . . . . . .
52
3.3.2
General Ontology Adaptation Strategy . . . . . . . . . . . . . . . . . .
54
3.3.3
Evaluation of General Ontology Adaptation Strategy . . . . . . . . . .
59
News Retrieval using Ontologies . . . . . . . . . . . . . . . . . . . . . . . . . .
62
3.4.1
News Retrieval using the Industry Ontology . . . . . . . . . . . . . . .
63
3.4.2
News Retrieval using Company Ontologies . . . . . . . . . . . . . . . .
63
3.4.3
Comparative Evaluation of Ontology Information Retrieval Strategies
64
Industry Ontology
Company Speci�c Ontology
Summary
. . . . . . . . . . . . . . . . . . . . . . . . . . . . . . . . . . . . . .
3.5.1
Ontology construction and maintenance
. . . . . . . . . . . . . . . . .
68
3.5.2
News retrieval with ontologies . . . . . . . . . . . . . . . . . . . . . . .
69
4 Text Analysis 4.1
4.2
68
Sentence Level Strategies
70 . . . . . . . . . . . . . . . . . . . . . . . . . . . . .
4.1.1
Lexical Resource Construction
. . . . . . . . . . . . . . . . . . . . . .
4.1.2
Jape Rule Construction for Phrase Annotation
4.1.3
Scoring Annotated Phrases
4.1.4
71 72
. . . . . . . . . . . . .
82
. . . . . . . . . . . . . . . . . . . . . . . .
83
Evaluation . . . . . . . . . . . . . . . . . . . . . . . . . . . . . . . . . .
85
Document Level Strategies . . . . . . . . . . . . . . . . . . . . . . . . . . . . .
87
4.2.1
88
Labelling Strategies
. . . . . . . . . . . . . . . . . . . . . . . . . . . .
3
4.2.2
Document level strategies evaluation . . . . . . . . . . . . . . . . . . .
4.3
Comparing Sentence and Document Level Strategies
4.4
Discussion of results
91
. . . . . . . . . . . . . .
94
. . . . . . . . . . . . . . . . . . . . . . . . . . . . . . . .
96
5 Direct Speech Analysis
97
5.1
Introduction . . . . . . . . . . . . . . . . . . . . . . . . . . . . . . . . . . . . .
5.2
Related Work . . . . . . . . . . . . . . . . . . . . . . . . . . . . . . . . . . . . 100
5.3
5.2.1
Bootstrapping strategies . . . . . . . . . . . . . . . . . . . . . . . . . . 100
5.2.2
Sentiment resources
5.2.3
Semi supervised learning . . . . . . . . . . . . . . . . . . . . . . . . . . 103
5.3.1
Guided Self-Training . . . . . . . . . . . . . . . . . . . . . . . . . . . . 105
5.3.2
Contextual Classi�cation Strategy
Experiments with Direct Speech
6.2
6.3
Summary
. . . . . . . . . . . . . . . . . . . . . . . . . . . . . . . . . . . . . . 118
119
Classi�cation strategies trading evaluation . . . . . . . . . . . . . . . . . . . . 120 6.1.1
Sensitivity analysis of the inductive classi�ers . . . . . . . . . . . . . . 122
6.1.2
Sentence level evaluation . . . . . . . . . . . . . . . . . . . . . . . . . . 125
Full system trading evaluation . . . . . . . . . . . . . . . . . . . . . . . . . . . 125 6.2.1
Selection of strategies for full system testing . . . . . . . . . . . . . . . 127
6.2.2
Experimental Setup
6.2.3
Results
. . . . . . . . . . . . . . . . . . . . . . . . . . . . 127
. . . . . . . . . . . . . . . . . . . . . . . . . . . . . . . . . . . 128
Discussion of results
. . . . . . . . . . . . . . . . . . . . . . . . . . . . . . . . 133
7 Conclusion 7.1
. . . . . . . . . . . . . . . . 109
Single news value strategy evaluation . . . . . . . . . . . . . . . . . . . 117
6 System Experiments 6.1
. . . . . . . . . . . . . . . . . . . . 107
Comparison of the two direct speech classi�cation strategies. . . . . . . . . . . 111 5.4.1
5.5
. . . . . . . . . . . . . . . . . . . . . . . . . . . . 103
Proposed Strategies . . . . . . . . . . . . . . . . . . . . . . . . . . . . . . . . . 104
5.3.2.1 5.4
97
136
Discussion of Thesis
. . . . . . . . . . . . . . . . . . . . . . . . . . . . . . . . 136
7.1.1
. . . . . . . . . . . . . . . . . . . . . . . . . . . . . . . . 138
Future Work
4
7.1.2
Conclusion
. . . . . . . . . . . . . . . . . . . . . . . . . . . . . . . . . 140
Bibliography
141
A De�nitions
152
A.1
De�nitions . . . . . . . . . . . . . . . . . . . . . . . . . . . . . . . . . . . . . . 152 A.1.1
Speci�c term de�nition . . . . . . . . . . . . . . . . . . . . . . . . . . . 155
B Publications B.1
157
Thesis Publications . . . . . . . . . . . . . . . . . . . . . . . . . . . . . . . . . 157
C Supplementary Results
159
C.1
Comparative Information Retrieval . . . . . . . . . . . . . . . . . . . . . . . . 159
C.2
Company Speci�c Ontology
C.3
Experimental Results - Data . . . . . . . . . . . . . . . . . . . . . . . . . . . . 160
. . . . . . . . . . . . . . . . . . . . . . . . . . . . 159
5
List of Tables 1.1
Impact of events on share prices.
. . . . . . . . . . . . . . . . . . . . . . . . .
14
1.2
Market reaction to big events. . . . . . . . . . . . . . . . . . . . . . . . . . . .
14
3.1
Extracted phrase delimiters for known collective entities. . . . . . . . . . . . .
46
3.2
Accuracy of collective extraction patterns. . . . . . . . . . . . . . . . . . . . .
46
3.3
Collective entities population experiments results. . . . . . . . . . . . . . . . .
49
3.4
Examples of sectors and their members.
50
3.5
Examples of companies and their industry sector memberships in alphabetical order.
. . . . . . . . . . . . . . . . . . . . .
. . . . . . . . . . . . . . . . . . . . . . . . . . . . . . . . . . . . . . . .
3.6
Examples of linguistic cues.
3.7
Baseline ontology evaluation comments.
. . . . . . . . . . . . . . . . . . . . .
55
3.8
Ranking guidance for manual evaluator.
. . . . . . . . . . . . . . . . . . . . .
65
3.9
Exclusion guidance for manual evaluator.
. . . . . . . . . . . . . . . . . . . .
66
3.10 Evaluation results for ontology recall strategies. . . . . . . . . . . . . . . . . .
67
3.11 Average number of documents returned.
. . . . . . . . . . . . . . . . . . . . .
67
4.1
A Sample of business event verbs. . . . . . . . . . . . . . . . . . . . . . . . . .
75
4.2
Selection of sample of sentiment modi�cation adverbs.
. . . . . . . . . . . . .
78
4.3
Sample selection of Properties of Economic Actors (PEA). . . . . . . . . . . .
80
4.4
Sample Verb Values.
81
4.5
A sample of Properties of Economic Actors and their relationship with business event verbs
. . . . . . . . . . . . . . . . . . . . . . . . . . . .
51
. . . . . . . . . . . . . . . . . . . . . . . . . . . . . . . .
. . . . . . . . . . . . . . . . . . . . . . . . . . . . . . . . . . . . .
53
81
4.6
Recall and Precision for Phrase Extraction.
. . . . . . . . . . . . . . . . . . .
87
4.7
Large Single Day Fluctuations in the FTSE. . . . . . . . . . . . . . . . . . . .
90
6
4.8
Estimated F-measure for competing labelling strategies.
4.9
Evaluation of sentence and document level strategies' calculation of a daily news value.
. . . . . . . . . . . .
. . . . . . . . . . . . . . . . . . . . . . . . . . . . . . . . . . . . .
4.10 Evaluation of sentence and document level strategies'.
. . . . . . . . . . . . .
94
95 96
5.1
Bigram POS sequences for the creation of sentiment bigrams.
. . . . . . . . . 101
5.2
An example of job titles assigned to a group.
5.3
Estimated Accuracy from 10 times 10 fold cross-validation.
5.4
Estimated F-measure for competing strategies.
5.5
Polarity Criteria.
5.6
Results for single day's news value. . . . . . . . . . . . . . . . . . . . . . . . . 117
5.7
Accuracy for a single day's quotes.
6.1
Results for trading evaluation for sentence level strategies. . . . . . . . . . . . 125
6.2
Comparison of Information Retrieval Strategies. . . . . . . . . . . . . . . . . . 130
6.3
Comparison of Combinations of news features. . . . . . . . . . . . . . . . . . . 131
6.4
Comparison of the results for full system trading horizon 1 day. . . . . . . . . 132
6.5
Comparison of results for full system trading horizon 3 days. . . . . . . . . . . 133
6.6
Comparison of results for full system trading horizon 5 days. . . . . . . . . . . 134
6.7
Comparison of results for full system trading horizon 10 days. . . . . . . . . . 135
7.1
�Interesting� quotations derived with simple rules.
C.1
Subset of assertions for entity type person . . . . . . . . . . . . . . . . . . . . 159
C.2
Selection of assertions which concern Microsoft
C.3
Airline Meals Experimental Results . . . . . . . . . . . . . . . . . . . . . . . . 160
C.4
Teacher Review Experimental Results
C.5
Music Reviews Experimental Results . . . . . . . . . . . . . . . . . . . . . . . 161
C.6
GST Strategy with lower precision classi�er
. . . . . . . . . . . . . . . . . . 107 . . . . . . . . . . 111
. . . . . . . . . . . . . . . . . 113
. . . . . . . . . . . . . . . . . . . . . . . . . . . . . . . . . . 114
. . . . . . . . . . . . . . . . . . . . . . . . 118
7
. . . . . . . . . . . . . . . 139
. . . . . . . . . . . . . . . . . 160
. . . . . . . . . . . . . . . . . . . . . . 161
. . . . . . . . . . . . . . . . . . . 162
List of Figures 1.1
United Airlines share price September 8th 2008. . . . . . . . . . . . . . . . . .
13
2.1
Sample Comparison and Target Page.
. . . . . . . . . . . . . . . . . . . . . .
31
2.2
Example of matching text nodes.
. . . . . . . . . . . . . . . . . . . . . . . . .
35
2.3
Jacard similarity for competing text extraction strategies.
. . . . . . . . . . .
36
2.4
Cosine similarity for competing text extraction strategies.
. . . . . . . . . . .
36
2.5
Mean similarity for competing text extraction strategies. . . . . . . . . . . . .
36
2.6
QGram similarity for competing text extraction strategies.
. . . . . . . . . .
36
3.1
The proposed weight decay rate function.
. . . . . . . . . . . . . . . . . . . .
58
3.2
Number of errors for entity with most relations. . . . . . . . . . . . . . . . . .
60
3.3
Error rate for entity with most relations. . . . . . . . . . . . . . . . . . . . . .
61
3.4
Number of relations for entity with most relations.
62
5.1
Overview of the contextual classi�cation strategy
5.2
Estimated average F-measure for each strategy using Language Models as a
. . . . . . . . . . . . . . .
. . . . . . . . . . . . . . . . 108
classi�er for airline meals reviews. . . . . . . . . . . . . . . . . . . . . . . . . . 115 5.3
Estimated average F-measure for each strategy using Naive Bayes as a classi�er for airline meals reviews. . . . . . . . . . . . . . . . . . . . . . . . . . . . . . . 115
5.4
Estimated average F-measure for each strategy using Language Models as a classi�er for teacher reviews. . . . . . . . . . . . . . . . . . . . . . . . . . . . . 115
5.5
Estimated average F-measure for each strategy using Naive Bayes as a classi�er for teacher reviews. . . . . . . . . . . . . . . . . . . . . . . . . . . . . . . . . . 115
5.6
Estimated average F-measure for each strategy using Language Models as a classi�er for music reviews.
. . . . . . . . . . . . . . . . . . . . . . . . . . . . 116
8
5.7
Estimated F-measure for each strategy using Naive Bayes as a classi�er for music reviews. . . . . . . . . . . . . . . . . . . . . . . . . . . . . . . . . . . . . 116
6.1
An overview of classi�cation strategies. . . . . . . . . . . . . . . . . . . . . . . 122
6.2
Points di�erence for di�erent classi�er con�dence levels.
6.3
Points di�erence for di�erent classi�er con�dence levels for quote level classi-
. . . . . . . . . . . . 123
�cations. . . . . . . . . . . . . . . . . . . . . . . . . . . . . . . . . . . . . . . . 124
9
Chapter 1
Overview 1.1 Introduction This thesis is intended to be a contribution to the increasingly popular area of research of making deductions and inferences about a real world problem from information described in text.
The chosen area for this thesis was the estimation of the direction of share price
movements. This area was chosen because there are: 1. existing hypothesis that suggests news can in�uence the stock market and 2. large volumes of freely available news / �nancial data. Information contained in news which can aid the estimation of a share's price direction is known as �alpha�. This thesis is, in essence, an exercise in identifying alpha in news stories.
1.1.1 Problem De�nition A high level problem de�nition for this thesis can be summarized in a single phrase: the conversion of text into information [Mitra and Mitra, 2011b].
A more concrete de�nition
Business / �nancial news stories can contain information (words, sequence of words or overall story opinion) which has an economic value which is not re�ected in the current price of a speci�c share or market index. Business/ �nancial news, therefore can be used as a may be:
basis of a successful trading strategy. In summary, the underlying hypothesis for the work of this thesis is that it is possible to improve an existing trading strategy by adding information from a �nancial news text mining system. There are a number of challenges which are presented by the processing of news. challenges may be broken down into: 1.
lexical, 2.
identi�cation, 3.
The
behavioural and 4.
data acquisition. The challenges described in this section are specially related to �nance or business news.
Lexical challenges
are associated with the language and grammar contained in news stories.
10
CHAPTER 1.
OVERVIEW
11
Financial / business news contains its own unique lexicon with words which are unique to it, for example: �a bear market� or �double dip recession�. This unique lexicon can produce unconventional grammars.
An example of atypical grammar can be demonstrated by a
negation process. Negation inverts the sentiment of a word / phrase, e.g. �good� (positive sentiment) is inverted by the word �not�, consequently, �not good� has the opposite sentiment to �good�. In the following quote the the expression
far cry.
positive
expression �V-shaped recovery� is negated by
But because these gains follow the massive contraction that occurred during the Great Recession of 2008-2009, they are a
V-shaped recovery.
far cry
from the trajectory of a classic
Global economic recovery more super�cial than real - Gulf News July 5th 2011
This example demonstrates only one unique feature of news language and it is likely that there other atypical grammars which are common in news stories. This may inhibit strategies which rely upon general linguistic resources, for example, sentiment dictionaries, to extract information from news stories because these resources may not contain speci�c terms from the �nance domain.
Identi�cation Challenges
refers to the identi�cation of news stories because a strategy which
can accurately classify or extract information from news stories will be reliant upon the discovery of relevant stories.
Relevant stories can often be stories which contain a direct
reference to a monitored company, but relevant news may be news concerning a competitor or general macro-economic news.
The phenomenon of indirectly related news e�ecting a
given stock or share is often referred to as �spill-over� and will be discussed at length later on in this thesis.
Behavioural Challenges
refers to the trading behaviour of stock traders. A successful clas-
si�cation of a relevant news story may not be su�cient to trigger a successful trade if the news is expected. If the news is expected then the price of a share in advance of the news will re�ect this expectation and will not move when the news is published.
Data Acquisition Challenges
refers to the acquisition of raw data and training data. Freely
available news is published on the Internet on news sites. News sites don't share the same �templates� and often have advertisements and non-news content on the same page as the news content.
This �non-news� content may inhibit news story analysis if its content is
included in the analysis process.
In addition there is no freely available annotated news
stories which can be used as training data. The themes for this thesis can be simply summarized as:
to analyse the news stories.
what news stories to analyse and how
The approach proposed by this thesis varies from the published
approaches because information retrieval strategies are given as much prominence as the
CHAPTER 1.
OVERVIEW
classi�cation strategies.
12
The classi�cation strategies vary from the typical approaches by
combining rules, market alignment and semi-supervised learning to establish robust models. An additional variation from the research literature are the experiments with �direct speech� from economic actors as a basis of a trading strategy.
Finally, the thesis is a complete
�pipeline� which: 1. gathers news stories from the web, 2. extracts news information from the original HTML, 3. selects the news stories to be classi�ed, 4. classi�es elements from the news stories and 5. adds classi�ed elements as features to an existing stock trading system.
1.2 Literature Review This section describes the literature review conducted to identify relevant stock prediction investigation from the news research community.
The literature review was in two parts:
economic literature and existing stock prediction systems. The economic literature review was to ensure: 1. markets react to news and 2. a pro�table trading strategy can be achieved from trading on news information.
1.2.1 Economic Literature The earliest evidence in the research literature of the successful use of news information in a real world trading strategy was by Victor Niederho�er in the early 1970s. Niederho�er's employees classi�ed stories in the print media into 19 categories, which were a sliding scale of polarity from optimistic to indi�erent to pessimistic. Niederho�er claimed that a polarity of a news story was a good indication of �alpha� and consequently he was able to conduct a successful trading strategy [Niederho�er, 1971].
De Bondt and Thaler [1985] provided more
markets over-react or underreact to an event and then correct. They made further claims: 1. Extreme movements in stock prices will be followed by subsequent price movements in the opposite direction and 2. The more extreme the initial price movement the greater will be the subsequent price movement. detail that markets can react to events. Their central claim was:
De Bondt and Thaler claimed that events can move markets, and because they overreact or underreact it may be possible to implement a successful trading strategy. An illustrative
1
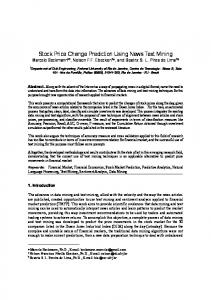
example of this e�ect was the false United Airlines bankruptcy story in September 2008 . The share price plunged on the bankruptcy news and then recovered when the story was corrected. The share price is illustrated in Figure 1.1. The graph demonstrates the opening price, the lowest price and the closing price. A trading strategy which used the De Bondt and Thaler hypothesis would have bought at the lowest price because it would have anticipated a later market correction. The false news story also had a depressing e�ect on other major airlines [Carvalhob, Klaggea, and Moencha, 2011]. This e�ect is known as �spill-over� and
1
Details can be found at http://news.bbc.co.uk/2/hi/7605885.stm
CHAPTER 1.
OVERVIEW
13
will be discussed later on in this section. Veronesi [1999] suggested that the overreaction and
6 0
2
4
Share Price
8
10
12
underreaction to news is a form a hedging by market actors.
Open
Low
Close
Price State
Figure 1.1: United Airlines share price September 8th 2008.
There are further examples where share price has reacted to events, for example the Google+ launch [Schonfeld, 2011] and the free Nokia GPS launch [Hamblen, 2010].
The impact of
events upon share prices is documented in Table 1.1 A possible �aw with the De Bondt and Thaler hypothesis is that not all events provoke a reaction [Schuster, 2003][Culter, Poterba, and Summers, 1991][Robbani and Anantharaman, 2004]. Schuster [2003] provides a review of �big events� and the reaction of the S&P market index. The results are described in Figure 1.2. Events which have an economic consequence provoke the expected reaction [De Bondt and Thaler, 1985].
Events can provoke an immediate reaction in the stock market, but the event must have economic consequences.
Hypothesis 1:
The e�ect of a relevant event on a given instrument can be ampli�ed if it is unexpected Schuster [2003][Bom�m, 2000].
Expected events tend to provoke no reaction [Schuster, 2003].
The identi�cation of unexpected events in news may be assisted by the economics of news
CHAPTER 1.
OVERVIEW
14
Company
Date
Event
Open
Low
Close
United Air-
08-09-2008
Bankruptcy Rumour
12.17
3.00
10.92
28-10-2009
Launch
GPS
10.60
8.06
8.11
GPS
36.02
30.85
31.59
GPS
6.50
5.43
5.90
GPS
34.54
33.95
34.16
474.00
473.50
482.80
lines Tom Tom
of
Free
System by Google Garmin Ltd
28-10-2009
Launch
of
Free
System by Google Tom Tom
21-01-2010
Launch
of
Free
System by Nokia Garmin Ltd
21-01-2010
Launch
of
Free
System by Nokia Google
27-06-2011
Launch of Google+
Table 1.1: Impact of events on share prices. Event
S & P Reaction
Bay of Pigs invasion
-0.47
Soviet invasion of Afghanistan
+0.11
Assassination attempt on Ronald Reagan
+0.27
The death of U.S. marines in Lebanon
+0.02
Chernobyl Nuclear Disaster
-1.06
Hurricane Andrew
-0.8
Table 1.2: Market reaction to big events.
publishing.
Financial news published in the mass media must have su�cient �utility� to
attract readers [McManus, 1988], consequently �nancial news published in the mass-media are likely to be unexpected or su�ciently interesting to be published.
The publication of
events in the mass media are likely to intensify market reaction [Schuster, 2003].
Hypothesis 2:
The mass-media �lters expected or inconsequential news stories.
Sentiment in news can be an indication of the future prospects of an economic actor [Davis and Piger, 2006].
This information can be extracted by sentiment analysis systems which
seek to extract emotions and feelings expressed about people, organisations, nation states, goods and services, in free natural language texts [Glucksberg, 2008]. the e�ect of language in news and its e�ect on economic actors.
Davis hypothesized
She stated: �We �nd a
CHAPTER 1.
OVERVIEW
15
positive (negative) association between optimistic (pessimistic) language usage and future �rm performance and a signi�cant incremental market response to optimistic and pessimistic language usage in earnings press releases.
Results suggest managers use optimistic and
pessimistic language to provide credible information about expected future �rm performance to the market, and that the market responds to managers' language usage.� [Davis and Piger, 2006]. Davis view is supported by Tetlock [Tetlock, Saar-Tsechansky, and Macskassy, 2008] . He provided a �check list� summary of his �ndings, which were:
•
The fraction of negative words in �rm-speci�c news stories forecasts low �rm earnings.
•
Firms' stock prices brie�y underreact to the information embedded in negative words.
•
The earnings and return predictability from negative words is largest for the stories that focus on fundamentals. [Tetlock, Saar-Tsechansky, and Macskassy, 2008]
Henry [2006] analysed the writing style of company reports and found that changes in writing style from optimistic to pessimistic can be a good indicator of a company's futures prospects. She stated: �Results of the study show that inclusion of predictor variables capturing verbal content and writing style of earnings-press releases results in more accurate predictions of market response.�. The view that sentiment in news can e�ect �nancial market's value is not limited to academia. Ravenpack, a company which produces a �news analytic� system released a white paper which stated that there were correlations between sentiment in news and two week returns in the Eurstoxx and DJIA (Dow Jones) market indexes [Hafez, 2009].
The market reaction to sentiment information can be over a longer period than market reaction to events
Hypothesis 3:
News stories may e�ect other economic actors which are not speci�cally mentioned in the news story, for example: the downgrade of the credit rating of Portugal directly e�ected the
2
yields required from government debt for Spain, Italy and Ireland . This e�ect is known as �spill over� where the prospects of one economic actor e�ect other related economic actors.
De�nition Spill-Over: A speci�c economic-actor event which also e�ects the sector index price 2
More details can be found here http://goo.gl/vtxU5
CHAPTER 1.
OVERVIEW
16
Hafez [2010] [Mitra and Mitra, 2011c] states that there are a number of studies which demonstrate company speci�c news events can e�ect the industry index price. Therefore, an event which notionally concerns a single company can have an e�ect on many companies in the same sector. This e�ect is re�ected in the industry index price. He does not elaborate on these sources, but provides an example from company research by Cahan et al who suggested that news sentiment for a company can e�ect the whole industry [Hafez, 2010] [Mitra and
sector excess returns following company speci�c news events are smaller than market excess returns indicating that the sector also moves on the event [Hafez, 2010] [Mitra and Mitra, 2011c].
Mitra, 2011c].
The evidence that they provided was that
Hafez suggests that there are �spill-over� e�ects from news releases because they have impact on risk and covariance of stocks [Hafez, 2010] [Mitra and Mitra, 2011c]. In addition he states there is further evidence of information in macroeconomic news e�ecting company share prices [Panetta, 2002].
Hypothesis 4:
Company share prices can move on news where it is not explicitly mentioned in the news text
This section provides the economic foundations and justi�cations for the approach taken in this thesis. This section is not a comprehensive review of the economic literature because this thesis is in the domain of Computer Science rather than Economics. This section, however presents a summary of the current trends of evaluating the e�ect of news on stock prices from the economics perspective.
1.2.2 Existing Systems This section describes systems which have been published in peer reviewed journals. There is a caveat. The construction of systems which predict the stock markets has an economic value, and consequently there may have been advances which have not been published. A further caveat is that the published work often omits details which can inhibit an implementation of the published system.
Dictionary Approaches A dictionary based system typically relies upon a pre-compiled dictionary. The dictionary normally contains a word n-gram (n
≥ 1
) and a value.
The function of the value is to
infer an in�uence of the word, for example the unigram �bankrupt� may may have a negative
CHAPTER 1.
OVERVIEW
17
value. The research literature contains a number of systems which claim to have achieved positive trading returns. A typical example of a dictionary approach was described by Wuthrich, Cho, and Leung [1998].
Wuthrich's system analysed �overnight� news which is news published when the
�nancial markets were closed. The dictionary constructed by Wuthrich contained tuples of words separated with an �AND� Boolean instruction, for example �Bond� and �Strong�. The news stories were categorized based upon the contents of the dictionary.
The number of
stories in each category would be counted and sell or buy instruction would be generated for the index.
They claim a 21% advantage over and above a trader who would trade by
guessing based on an uniform distribution [Wuthrich, Cho, and Leung, 1998]. The News Categorization and Trading System
(NewsCATS)
2006] also relied upon a pre-compiled dictionary.
[Mittermayer and Knolmayer,
NewsCATS analysed company press re-
leases, and attempted to predict the company's share price upon information contained in the press release. The dictionary was not published, but the authors state that the dictionary was created by hand. The construction methodology was also not published. The function of the dictionary was to assist NewsCATS to categorise press releases into pre-designated categories. These categories were designed to indicate the in�uence (positive or negative) of the press release upon the share price. The system's authors claim that they signi�cantly out perform a trader who buys on a random basis after press releases are released [Mittermayer and Knolmayer, 2006]. Another system which relied upon a pre-compiled dictionary was developed by Peramunetilleke and Wong [2002]. Their system attempted to predict the movements of targeted currencies. The pre-compiled dictionary was constructed by aligning news stories with movements in the targeted currency.
The methodology assumed that news stories which co-occurred with a
gain in a certain currency were positive whereas news stories which co-occurred with a drop in a certain currency were negative.
The system analysed headlines because they have
restricted grammar and provide an accurate summary of the following story. contained word unigrams.
a
The dictionary
The dictionary construction methodology extracted unigrams
from the headlines of the aligned stories. The words were stemmed and assigned a weight. The unigrams were assigned a polarity (+/-) by the aforementioned alignment strategy. The system classi�ed incoming news headlines with terms in the dictionary.
The system used
the classi�ed headlines to make a prediction about the direction of a currency. The authors claim a near human performance of being correct nearly 50% of the time [Peramunetilleke and Wong, 2002].
CHAPTER 1.
OVERVIEW
18
Machine Learning
An alternative to hand-crafted or automatically generated dictionaries is the application of a form of machine learning to classify news stories into predesignated categories. The
AEnalyst
system was a system designed by Lavrenko, Schmill, Lawrie, Ogilvie, Jensen,
and Allan [2000]. The AEnalyst constructed Language Models by aligning news stories with trends in the market. Stories which co-occurred with a negative trend were assumed to be negative whereas stories which co-occurred with a positive trend were assumed to be positive and stories which co-occurred with neither a negative or positive trend were assumed to be neutral. The language models represented probability distributions of unigrams for each category. The AEnalyst system used an activity monitoring strategy to issue alerts to warn of positive or negative trends in streaming news data [Lavrenko, Schmill, Lawrie, Ogilvie, Jensen, and Allan, 2000]. The alerts were issued when the unigrams in the incoming news stories passed a given threshold. Gidófalvi [2001] used the aforementioned alignment strategy to train a Naive Bayes classi�er. The three categories the Naive Bayes classi�er was trained for were: 1.up, 2.
down or 3.
unchanged. Gidófalvi claimed positive returns, but stated the predictive nature of the news stories was limited to 20 minutes from the news stories being published [Gidófalvi, 2001]. Fung, Yu, and Lam [2002] also used a time-series alignment strategy, but used a technique they coined as �guided clustering�. The trends detected in time-series data were clustered and news articles were aligned to the clusters. The authors do not state explicitly how the alignment was achieved, but they stated that the stories
happening of the trends.
would support and account for the
This quote would suggest that alignment was conducted manually
by a domain expert. The features selected from the clusters are then used as features for a Support Vector Machine (SVM). The SVM detected trends which allowed the use of a trading strategy which the authors claim was pro�table. [Fung, Yu, and Lam, 2002] Izumi, Goto, and Matsui [2010] proposed a strategy for predicting bond prices.
They
extracted feature vectors from the Bank of Japan reports. Trends in the bond market were estimated by regression analysis using the aforementioned feature vectors. The authors claim that they could predict long term bond market trends using this methodology. AZFinText system [Schumaker and Chen, 2009] used a machine learning approach to predict a future price of a given stock.
They tested four news story representation strategies: 1.
Bag of Words, 2. Noun Phrases, 3. Proper Nouns and 4. Named Entities. They found that Proper Noun representation provided the best returns.
CHAPTER 1.
OVERVIEW
19
Other Systems A hybrid approach was proposed by Luss [2009]. He created a dictionary which contained negative and positive unigrams. The unigrams were used as features for a Support Vector Machine (SVM). The SVM classi�ed press releases (PRNewswire) and made a prediction of the direction of the market. The author claimed that the approach produced abnormal returns [Luss, 2009]. Another hybrid approach was proposed by Tang, Yang, and Zhou [2009]. They used known words to select news stories for training a learner. The approach separated the stories into known categories, and eliminated stories which occurred in more than one category. They extract features from the stories and eliminate words which were �meaningless�. The features were ranked and weighted.
These features were used in supervised training experiments
where the predictive nature of news was compared with a moving average prediction strategy. Thomas proposed a method of detecting trends in prices of stocks and their correlation to postings on �nancial message boards. to generate predictive models from: �nance boards and 2.
1.
His proposed approach used a genetic algorithm patterns and volume of words in messages on
the volume of messages on �nance boards.
Thomas claimed that
the subsequent models allowed the prediction of the direction of the value of stock market indexes. [Thomas and Sycara, 2000] Another approach was proposed by Lu, Wei, and Chang [2009] who used features from news stories to assist a logistic regression process to detect companies in �nancial distress. There have a been a number of papers which have traded on information from social media sites such as Twitter.
Activity on social media sites can be can correlated with events
on the stock market, and this correlation can be used to successfully trade on the stock market [Ruiz, Hristidis, Castillo, Gionis, and Jaimes, 2012].
The sentiment of posts on
Twitter can assist with stock market prediction [Bollen and Mao, 2011]. The media may be new, but the methods for extracting �actionable information� rely upon event or sentiment detection methods.
1.3 Main Contributions The main contributions of this thesis were achieved to resolve the problems set out in the
problem de�nition
subsection on page 10. In summary, the main problems were: 1. lexical
2, identi�cation, 3. behavioural and 4. data acquisition. The claims are stated below with evidence. article or refereed journal article.
The evidence is either a: refereed conference
CHAPTER 1.
OVERVIEW
20
Claim 1: The domain of a given economic actor can be represented in detail from information contained in news stories and linked data.
Evidence: 1. Drury, B. and Almeida, J.J. Construction of a Local Domain Ontology from News Stories. EPIA, Springer LNCS, pages 400-410, 2009.
2.Drury, B., Almeida, J.J and Morais M.H.M, An Error Correction Methodology for Time Dependent Ontologies. ONTOSE Workshop, CAiSE, Springer LNBIP, pages 501-512, 2011
Claim 2: A limited number of changes and errors in economic actor's domain can be resolved automatically.
Evidence: 1.Drury, B., Almeida, J.J and Morais M.H.M, An Error Correction Methodology for Time Dependent Ontologies. ONTOSE Workshop, CAiSE, Springer LNBIP, pages 501-512, 2011
2. Drury, B., Almeida, J.J and Morais M.H.M, Construction and Maintenance of a Fuzzy Temporal Ontology from News Stories. International Journal of Metadata, Semantics and Ontologies, pages �in print�,2012
CHAPTER 1.
OVERVIEW
21
Claim 3: News stories which have a direct or indirect connection to a given domain can be recommended with good precision on the basis of a domain Ontology.
Evidence: 1. Drury, B., Almeida, J.J and Morais M.H.M, Magellan: An Adaptive Ontology Driven �breaking Financial News� Recommender. CISTI, IEEE, pages 99-105, 2011.
Claim 4: News stories can be weighted and ranked with a temporal weighting scheme which produces a clear advantage in terms of retrieval precision.
Evidence: 1. Drury, B., Almeida, J.J and Morais M.H.M, Magellan: An Adaptive Ontology Driven �breaking Financial News� Recommender. CISTI, IEEE,pages 99-105, 2011.
2. Drury, B., Almeida, J.J and Morais M.H.M, An Error Correction Methodology for Time Dependent Ontologies. ONTOSE Workshop, CAiSE, Springer LNBIP pages 501-512, 2011
Claim 5: News stories recommended with a dynamic error corrected Ontology have a higher precision and recall than those recommend with a static Ontology or a content based system which were evaluated in this thesis.
Evidence: 1. Drury, B. and Almeida, J.J and Morais M.H.M, Magellan: An Adaptive Ontology Driven �breaking Financial News� Recommender. CISTI, IEEE, pages 99-105,2011.
CHAPTER 1.
OVERVIEW
22
Claim 6: Financial news events and sentiment can be extracted with simple grammars.
Evidence: 1. Drury, B. and Almeida, JJ Identi�cation of �ne grained feature based event and sentiment phrases from business news stories. WIMS, ACM, pages NA, 2011.
Claim 7: Language models and naive bayes classi�ers induced through a self-training strategy which is guided by linguistic rules have a higher F-measure and trading pro�t than a classi�er trained on rule selected data on the domains evaluated in this thesis.
Evidence: 1. Drury, B., Torgo L and Almeida, JJ Classifying News Stories to Estimate the Direction of a Stock Market Index. WISA Workshop, CiSTI, pages 958-962, 2011.
2. Drury, B., Torgo L. and Almeida, JJ. Classifying News Stories with a Constrained Learning Strategy to Estimate the Direction of a Market Index, International Journal Of Computer Science and Applications, pages 1-22,2012
CHAPTER 1.
OVERVIEW
23
Claim 8: Restraining the selection of news stories by aligning news with market movements with rules produces a classi�er which has a higher F-measure and trading pro�t than inducing a classi�er from stories selected by aligning news stories with market movements.
Evidence: 1. Drury, B., Torgo L and Almeida, JJ Classifying News Stories to Estimate the Direction of a Stock Market Index WISA Workshop, CiSTI, IEEE, pages 958-962, 2011.
2. Drury, B., Torgo L. and Almeida, JJ. Classifying News Stories with a Constrained Learning Strategy to Estimate the Direction of a Market Index, International Journal Of Computer Science and Applications,pages 1-22, 2012
Claim 9: Splitting a corpus of quotations from �nancial news into separate groups which are determined by speaker and applying separate semi-supervised strategies to each group generates a higher F-measure than applying a single strategy.
Evidence: 1. Drury, B. Dias, G. and Torgo, L. A Contextual Classi�cation Strategy for Polarity Analysis of Direct Quotations from Financial News. RANLP, pages 434-440, 2011.
CHAPTER 1.
OVERVIEW
24
Claim 10: A weak classi�er used in a self-training strategy achieves a higher F-measure if high con�dence errors are corrected by linguistic rules than modules induced from: voting strategy, rule selected data, self-training and inductive strategy.
Evidence: 1. Drury, B., Torgo, L. and Almeida, JJ. Guided Self Training for Sentiment Classi�cation. ROBUS Workshop, pages 9-16, RANLP, 2011.
Claim 11: Names of business sectors and their members can be learnt from news text.
Evidence: 1. Drury, B. and Almeida, JJ. Identi�cation, extraction and population of collective named entities from business news. Resources and Evaluation for Entity Resolution and Entity Management Workshop ,LREC, pages na, 2010
Claim 12: Connections between business sectors can be learnt from news text.
Evidence: 1. Drury, B. and Almeida, JJ. Identi�cation, extraction and population of collective named entities from business news. Resources and Evaluation for Entity Resolution and Entity Management Workshop ,LREC, 2010
1.4 Organization of Thesis This thesis is organized into : 1. 3.
Overview, 2.
Ontology-based Information Retrieval , 4.
Conclusion and 7. Appendix.
News Web Crawler and Text Extraction, Text Analysis, 5.
System Experiments ,6.
CHAPTER 1.
Overview
OVERVIEW
25
: The overview is a general overview of the thesis and contains the economic
underpinnings and justi�cation for the thesis. The introduction contains an overview of past systems in this �eld and the advances that this thesis contains.
News Web Crawler and Text Extraction
:
This chapter describes the crawler which
fetches and extracts text information from RSS feeds.
This chapter describes the
automatic identi�cation of extraction targets in news web pages. the text extraction scheme is provided.
An evaluation of
The chapter also describes the addition of
meta-data.
Ontology-based Information Retrieval
:
This chapter describes two information re-
trieval strategies which rely upon ontologies to select news stories.
The chapter de-
scribes two types of ontologies: 1. industry ontology and 2. company speci�c ontology. The �industry� ontology groups related companies together under industry sectors. The industry ontology uses: 1. related companies to a target company and 2. the target company's industry sector in a entity frequency scoring scheme to select news stories. The �company� speci�c ontology attempts to map in detail the domain of a company. The domain includes:
companies, people, products, etc.
The ontology is managed
overtime to: 1. remove outdated information and errors and 2. add new information. The company ontology uses all the information in the ontology to select news stories.
Text Analysis
: This chapter describes classi�cation of news stories. The section provides
a description of an initial grammar based approach as well as a restricted self training strategy. The section provides an evaluation with: a gold standard, cross validation (F-measure) and trading evaluation.
Direct Speech Analysis
: This chapter provides a description of two strategies for clas-
sifying direct quotations from news stories.
The �rst strategy splits the corpus into
separate groups and applies individual semi-supervised techniques to each group. The second strategy is a guided self-training strategy which allows the learner to select high con�dence individuals to add as training data. High precision rules correct erroneous selections and consequently boost the F-measure of the induced learner.
System Experiments
: This chapter documents the experiments which integrates the work
described in the previous chapters. The competing information retrieval strategies select, rank and score news stories for four companies: Apple, Microsoft, IBM and Google. The text and direct speech classi�cation strategies classify the information contained in the selected news stories. The information gathered from the news story is added as extra features to existing technical indicators features which were gathered by an existing stock trading system. The experiments used the existing stock trading system to make predictions of the share price of the four companies. The experiments describe the stock prediction results for the competing information retrieval and classi�cation
CHAPTER 1.
OVERVIEW
26
strategies for: 1,3,5 and 10 days ahead. The competing strategies are evaluated against a baseline which uses technical indicators only as features.
Conclusion
: This chapter discusses the work conducted for the thesis as well the direction
of future work.
Appendix
: The appendix contains information which was not included in the thesis, but
nevertheless may informative to the reader. For example, full de�nitions of terms and software tools used in this thesis.
Chapter 2
News Web Crawler and Text Extraction 2.1 News Crawler The �raw material� for this project was news stories. There was no large, freely available set of news stories to use for this project and therefore a large set of documents was required to be scraped from the Internet. This chapter will describe the crawler, text extraction and addition of meta-data parts of the system. The functional requirements of the crawler were to: 1. scrape news stories from pre de�ned lists of sites, 2. autonomously extract the story text from the original HTML, 3. assign a published date to the news story, 4. identify the headline, 5. identify duplicate news stories from the same source, 6. be able to run against a pre-de�ned scheduled and 7. run without human intervention. The functional requirements required the identi�cation of a published date and headline of the news story.
This information was available in Really Simple Syndication (RSS) feeds
provided by the news web sites. A RSS feed is a XML dialect which encodes information about a series of news stories. A RSS feed includes: a published date, headline and a uniform resource locator (URL) which provides a link to the news story. The RSS feeds typically have a �linguistic cue� in their URL which indicates the content of the feed, for example a RSS feed URL which contains the term �cricket� would be expected to contain stories about cricket whereas a RSS feed URL which contained the term ��nance� would be expected to contain stories about �nance. The process of scraping news stories had two distinct parts: a crawler which fetched news story HTML data as well as associated data from the RSS feed XML and a story text extractor which extracts story text from the news story HTML. The
27
RSS crawler
relied
CHAPTER 2.
NEWS WEB CRAWLER AND TEXT EXTRACTION
upon a list of pre-de�ned RSS feeds. example, the site
28
The RSS feed discovery used aggregator sites, for
http://dave.org.uk/newsfeeds/ lists a large number of RSS feeds which
can be used to gather candidate RSS feeds. The RSS crawler used a manually constructed list of �linguistic cues� to identify relevant RSS crawler feeds from aggregator sites.
The
cues were: ��nance�,�business� and �company�. A RSS crawler feed was deemed relevant if it had one of these cues in its URL. In addition to automatically located RSS feeds, �add hoc� additions of new RSS feeds could be entered manually. A pre-existing API was used to parse the RSS feeds. The API returned: headline, description, news story URL and published date information. This information was stored in a MySQL database. There were often duplicate news stories because:
1.
RSS feeds with di�erent URLs from the same web site publish
the same news stories and 2. RSS feeds were not updated between crawler runs. Duplicate detection was achieved with: 1.
headline of a news story and 2.
the RSS feed's domain.
A RSS feed's domain was the URL of the site the feed was hosted on, for example all RSS feeds hosted on The Telegraph web site would have a domain of �telegraph.co.uk�. The use of RSS feed domain and headline allowed the detection of duplicates across multiple RSS feeds on the same site. If a duplicate news story version was detected then the story with the most recent published date was deleted. If the published dates were identical then the story which was crawled last was deleted. Once a crawl of RSS feeds had been completed and duplicates deleted, the story HTML for each freshly crawled news story was fetched from its URL contained in the news story's RSS feed information.
2.2 Text Extraction The text extraction stage extracted the news story text from its HTML. It was necessary to have a fast and accurate extraction process because: 1. there were a large number of news stories (400K news stories gathered over 3 years), 2. news story HTML pages can contain non news information, for example advertisements or user comments, which may �contaminate� the news story text with irrelevant text which would introduce errors in an analysis process, and 3. proliferation of web coding standards.
2.2.1 Initial attempts The �rst attempt was to hand-code extraction templates for each individual site.
The
extraction templates relied upon �landmarks� in the HTML to detect outline of the story text. A landmark is a HTML element or section of text which delimits the news story text. The major news web sites often required multiple extraction templates because there were individual coding standards for each separate section of the site. In addition the news web sites changed the coding standards on an irregular basis which necessitated a change in the manual extraction template.
If the change in the coding standard went undetected then
CHAPTER 2.
NEWS WEB CRAWLER AND TEXT EXTRACTION
29
incorrect text would be harvested until the manual extraction template was modi�ed.
A
news story corpus constructed using site speci�c extraction templates contained documents with: 1. no text, 2. HTML and 3. erroneous text. The corpus had to be actively managed on a daily basis. The active management process failed to remove all erroneous documents. A detailed evaluation of the corpus revealed that: 4% of all documents failed to extract the story text, 2.5% contained only HTML code and 20% contained some HTML code. In summary the manual extraction template approach requires: regular changes to the extraction templates as well as active management of the news story database to eliminate erroneously extracted news story text. The results were unsatisfactory.
2.2.2 Text Extraction Literature Review The literature review revealed three distinct approaches for extracting text from web pages: a manual approach (method 1), wrapper induction (method 2) and automatic extraction (method 3) [Liu, 2007b].
attempts
on page 28.
The manual approach was described in the subsection
Initial
The manual approach was unsatisfactory for news text extraction
because web site templates changed on an irregular basis. The wrapper induction strategy is a supervised approach where representative samples of web pages are manually labelled.
Extraction rules are then learnt from the labelled data.
A weakness of the wrapper induction strategy is the detection of changes in HTML source code for a speci�c web site. A change in HTML source code may necessitate a change in extraction rules and consequently the manual labelling e�ort would have to be repeated. This problem is known as
the wrapper veri�cation problem
[Liu, 2007b]. The repetition of
generating extraction wrappers was su�cient to discount this method as a candidate solution for the text extraction stage. An alternative strategy to methods 1 and 2 is an unsupervised method which can learn extraction rules dynamically.
The literature review was restricted to method 3 because
methods 1 and 2 were su�ciently �awed to be discounted as possible solutions to the text extraction problem. The unsupervised methods are typically predicated upon two methods: string matching or tree matching [Liu, 2007b].
String matching is the comparison of two
strings to determine the similarity of the two strings. Typically measures such as Levenshtein distance are used to determine the similarity metric. This string based similarity metric is used to align similar sections of HTML code either: 1. in the same web page or 2, a similar web page from the same web site. An example implementation of this string based matching is the �centre star method�
[Liu, 2007b].
The tree matching technique uses a Document Object Model (DOM) representation of a web page to compute a similarity metric with other web pages by comparing matching nodes. Liu [2007b] provides a number of speci�c tree matching algorithms to identify lists of data
CHAPTER 2.
NEWS WEB CRAWLER AND TEXT EXTRACTION
30
items in web pages. These web sites are typically e-commerce sites which sell products, which presents the user with a large number of products in a form of a list. These methods were unsuitable for the text extraction problem because they were predicated upon repeating HTML elements which may not be available in news story extraction.
An unsupervised
tree matching approach for identifying items in news text was described by Reis, Golgher, Silva, and Laender [2004]. Their approach was predicated on a �tree edit distance�. They de�ne a �tree edit distance� as a minimum mapping cost between two trees. a computational expensive operation, which can be typically Silva, and Laender, 2004] where heights. to
n1
and
n2
are the size of the
This can be
O(n1 n2 h1 h2 ) [Reis, trees, and h1 and h2
Golgher, are their
They used a top down restrictive tree comparison which reduces the complexity
O(n1 n2 )
because the mapping cost is only computed in the leaves. They used tree edit
distances to cluster together web pages from a single news site. Their assumption was that separate extraction rules would be needed for each cluster because of di�erences in DOM structure.
The cluster extraction pattern was generated by matching each
each web page with the
DOM Trees
DOM Tree
of
of the remaining web pages in the cluster. The cluster
extraction patterns were expressed as node extraction expressions. Heuristics such as text length or number of terms in the text were used to identify the relevant text.
A possible
weakness in this approach is that the clustering process and the matching of DOM trees is a computational expensive task.
2.2.3 Proposed Strategy The text extraction method used in the extraction process was a variation of a tree edit distance strategy.
It used characteristics of news data to select comparison web pages
which were used to generate text extraction patterns for a speci�c candidate web page. The extraction process relied upon the comparison pages having a near identical DOM structure to the candidate web page. The extraction process relied upon DOM text tree nodes from a candidate and comparison web page which matched, i.e. same location in a DOM tree, and had a di�ering text value. These text candidates were extracted based upon their size and location in the DOM tree. The comparison web pages were selected by grouping together web pages by their: 1. RSS URL, 2. publication date and 3. web page length which is a count of the characters contained in a web page. The assumption was that pages with the same RSS URL, similar publication dates and page length would have similar DOM trees, and static content.
The two web
pages which: 1. had the same RSS URL, 2. published within 30 days of the text extraction page and 3.
had the closest page length to the text extraction web page were selected as
comparison pages. The di�erence between candidate web page's lengths were calculated by the following equation,
d(page1, page2) = |len(page1) − len(page2)|
(2.1)
CHAPTER 2.
where
page1
NEWS WEB CRAWLER AND TEXT EXTRACTION
and
page2
represent candidate web pages,
(web page length) in the candidate pages, and
d
len
31
represents a count of characters
represents the distance between the two
pages. A �nal comparison page was selected by calculating a tree edit distance for each comparison page with the candidate text extraction page and selecting the comparison page with the lowest tree edit score. This was to ensure that the web page with the most similar DOM tree to the candidate text extraction page was selected for the text extraction phase. The selection strategy was more e�cient than the Reis et al clustering strategy [Reis, Golgher, Silva, and Laender, 2004] because it limited the number of tree comparisons to two per candidate page instead of the of a
n−1 (n=total of pages per web site), used by a clustering process.
candidate extraction web page
An example
and a matching web page which was selected through this
process is presented in Figure 2.1. The example shows that the layout and non news content of each news story is almost identical. The selection algorithm is described in Algorithm 1. News text extraction from the candidate web page was achieved by locating matching text tree nodes from the DOM trees of the comparison page and the
candidate extraction web page.
A matching text node was a text node which was located in the same position of both DOM trees. A simple example is demonstrated in Figure 2.2. The text extraction algorithm was a two step process: step one located sub-trees of the �Body� HTML tag from the candidate extraction page and its comparison page and step two match the nodes from the sub trees located in step one. The step one algorithm is described in Algorithm two algorithm is described in Algorithm 3.
Figure 2.1: Sample Comparison and Target Page.
2 whereas the step
CHAPTER 2.
NEWS WEB CRAWLER AND TEXT EXTRACTION
32
Algorithm 1: Initial web page Candidate Selection. Input: candidate � Text Extraction Candidate Input: documents � News Stories begin tempstore ← () forall the document ∈ documents do if (document.RSSURL = candidate.RSSURL and |document.pubdate − candidate.pubdate| < 30 days) and document.headline 6= candidate.headline) then document.dif f erence ← |document.length − candidate.length|; tempstore.add(document);
//Sort by ascending document length difference; tempstore ← tempstore.sort(); //Add �Closest� News Stories; candidates.add(tempstore[0]); candidates.add(tempstore[1]);
return (candidates) The matching nodes were disregarded if they contained the same text (static content) as this was non-news text common to large numbers of web pages from the same web site. News story text varies from web page to web page because news story cover individual events therefore matching text nodes from the candidate extraction with di�erent text values instead of the matching nodes from the comparison page, were reserved for extraction. The text extraction process from the matching nodes relied upon text length to extract text. The matching node with the longest text value was located. The matching nodes which were not on the same DOM tree branch as the longest text node were eliminated. The �nal text was extracted from the largest text mode, and the remaining text nodes if their text value had a length of at least 30% of the largest text node. This cut o� value was derived through simple experiments. A simpli�ed algorithm for extracting text from matching text nodes is described in Algorithm 4.
2.2.4 Evaluation The evaluation of the proposed text extraction strategy was by comparing the text of a �gold standard� set of news stories with the text extracted by the proposed strategy from the HTML of the �gold standard�. The �gold standard� texts had been extracted with the initial
CHAPTER 2.
NEWS WEB CRAWLER AND TEXT EXTRACTION
33
Algorithm 2: Text Node Match Part 1. Input: Candidate - Candidate Extraction Page Input: Comparison - Comparison Page Output: CandNode - Collection of Matching Nodes begin CandidateDOM ← CreateDOM (Candidate); ComparisonDOM ← CreateDOM (Comparison); ChildN odes ← CandidateDOM.getBodyChildN odes(); CompN odes ← ComparisonDOM.getBodyChildN odes(); //variables for use in the second algorithm; //rootno tracks which branch the algorithm is on; //depthno tracks how far down the the algorithm is on; rootno ← 0; depthno ← 0; candidates ← (); for x = 1 → ChildN odes.Length do rootno = rootno + 1; //Return Matching Node Candidates for text extraction; P ush(candidates, Algorithm3(ChildN odes[x], CompN odes[x], rootno, depthno));
return(candidates)
manual template system and veri�ed by a human annotator. The aim of the experiment was to discover the similarity of the extracted text with the �gold standard� text. The similarity of the �gold standard� texts with the text extracted by the proposed method was calculated by the Simmetrics library [Chapman, 2008] which is a library which implements a number of common similarity measures.
The similarity functions in Simmetrics produced a value
from 0.0 to 1.0 where 0.0 indicated that there was no similarity and 1.0 indicated perfect similarity.
The experiments used three similarity measures which was to ensure that the
results could not be skewed by weaknesses in a single measure. The measures were: Qgrams, Jacard Distance and Cosine. The �gold standard set� contained 2310 manually evaluated news texts. Each text in the: 1.
gold standard set and 2.
texts extracted by proposed strategy (evaluation set) were:
1. converted to lower case, 2. the spacing between the words was changed to a uniform 1 character space and 3. tabs and newlines were removed and replaced with a single space. This was to ensure that the formatting of the text was uniform and consequently any dissimilarity between text would be due to di�erences in the text. The experiment iterated through the evaluation set of documents.
The three similarity
measures were computed for each text against the same text from the gold standard. As a
CHAPTER 2.
NEWS WEB CRAWLER AND TEXT EXTRACTION
34
Algorithm 3: Text Node Match Part 2. Input: Cand - SubTree From Candidate Extraction Input: Comp - SubTree From Comparison Extraction Input: RootNo - Position number of sub-tree Input: DepthNo - Depth Number of Parsed Root begin //Place holder for text candidates; cands ← (); forall the child ∈ Cand.getChildN odes() do child2 ← Comp.getN extChildN ode() //Termination because no corresponding node in comparison sub-tree; if (child2 = N U LL) then return(cands) //Detect if node is start of a sub tree; if (child2.isRoot() ∧ child.isRoot()) then //Recursive Call of Text Match Function to add matched candidates; push(cands, T extN odematch2(child, child2, RootN o, DepthN o + 1));
else if
(child2.isT extN ode() ∧ child.isT extN ode() ∧child.T ext 6= child2.T ext) then child.RootN o ← RootN o; child.DepthN o ← DepthN o; push(cands, child));
return(cands) Algorithm 4: Text Candidate Extraction. Input: cuto� � minimum length for text extraction Input: textcandidates � list of text candidates identi�ed through node matching process begin //Place holder for text from candidate nodes; text ← ””; forall the candidate ∈ textcandidates do //Check length of candidate node text value; if (len(candidate.text) < cutof f ) then return(text) text ← append(candidate.text, text) return(text)
comparison four variations of the proposed strategy were used. The variations were in the strategy for selecting comparison documents. The variations selected comparison documents
CHAPTER 2.
NEWS WEB CRAWLER AND TEXT EXTRACTION
35
Tree 1 a1 Pos . 1 Pos . 2
Tree 2 b1
c1
a2 Pos . 1 Pos . 2
b2
c2
Pos . 3
d2
Figure 2.2: Example of matching text nodes.
by: 1. web page length, 2. web page length and RSS feed, 3. web page length and time and 4. random. The results are presented in Figures 2.4, 2.3,
2.6 and
2.5. The results for the
proposed strategy were good as the set of extracted texts were almost identical to the gold standard set. There were exceptions where larger advertisement text was not �ltered by the extraction rules. The variations of the proposed strategy did not perform as well because the selection of comparison documents allowed large common texts to be present in the extracted text. The common texts were often: time dependent, feed dependent or a combination of the two. This is highlighted by the performance of the time and length strategy which limited the search for documents within a thirty day period which outperformed the proposed strategy contenders on all similarity measures with the exception of Cosine where the Simmetrics library returned an error. The length of a web page can often indicate a common template was validated because using web page length was often su�cient to extract the news text, but the weakness in using only web page size was that it could not detect changes in common text because text was a relatively small part of a web page.
A combination of restrictions by length, RSS feed
and time allowed the selection of comparison web pages which enabled near optimal text extraction. The base line comparison of choosing a random page was poor because in the
CHAPTER 2.
NEWS WEB CRAWLER AND TEXT EXTRACTION
36
0.8 0.6
Similarity
0.4 0.0
0.2
0.4 0.0
0.2
Similarity
0.6
0.8
experiments no text was extracted.
Proposed
Length
Time
Feed
Random
Proposed
Length
Strategy
Figure 2.3:
Jacard similarity for competing
Figure 2.4:
Feed
Random
Cosine similarity for competing
0.6
Similarity
0.0
0.2
0.4 0.0
0.2
0.4
0.6
0.8
text extraction strategies.
0.8
text extraction strategies.
Similarity
Time
Strategy
Proposed
Length
Time
Feed
Random
Proposed
Strategy
Length
Time
Feed
Random
Strategy
Figure 2.5: Mean similarity for competing text
Figure 2.6:
QGram similarity for competing
extraction strategies.
text extraction strategies.
The proposed strategy is an autonomous and e�cient tree based text extraction strategy. It is more e�cient than the strategy proposed by
Reis, Golgher, Silva, and Laender [2004]
because it performs fewer tree comparisons. The proposed strategy performs a maximum of 2 tree comparisons per candidate page where as
Reis, Golgher, Silva, and Laender [2004]
n−1 (n = number of pages on web site) tree comparisons for each target page during clustering phase and c − 1 (c = number of pages in cluster) during the node extraction
performs the
rule calculation stage. The production version of this strategy increased the number of pages
CHAPTER 2.
NEWS WEB CRAWLER AND TEXT EXTRACTION
37
processed per day by using the following strategies: 1. �caching� the newly created web page DOM trees to ensure the same DOM tree was not created twice and 2. storing the tree edit distances between 2 pages if the comparison page's text had not been extracted.
Storing
of edit distances ensured that the computing of tree edit distances between two pages only occurred once.
2.3 Addition of Meta-Data Addition of meta-data in this context are the following tasks: 1 named entity identi�cation, 2. text categorization, 3. fact and event identi�cation and 4. identi�cation of relationships between named entities. There are a number of web services which can perform these tasks, for example Zemanta or Open Calais.
These services are free.
Open Calais was chosen
because it was designed specially for news. Open Calais describes the meta data in Resource Description Framework (RDF) language and embedded in the language are links to �Linked Data�. Linked data is data which has been recovered from reliable sources such as DbPedia or Reuters databases. The data is described in RDF. The addition of meta data was achieved by running a separate program on a schedule to process newly extracted text.
The text is compressed, sent via a Representational state
transfer (REST) API call. The program waits for a reply. The resultant RDF is checked for any error messages. If there is an error then text is resent until the text is processed or it has been resent for a period of 24 hours. If the text has been processed successfully then it is stored, otherwise the text is inspected for the cause of any processing errors. The following chapters often rely upon information contained in the meta-data. To enable the extraction and processing of information contained in the meta-data a custom library was developed. The rational was to insulate the developer of applications which processes the meta data from writing RDF speci�c code. The library parsed the code and produced a series of objects which contained attributes and references to other objects.
2.4 Summary This chapter has described the manner in which stories are crawled and processed.
The
processing involved the extraction of the story text as well as the addition of meta data. This data is the �building blocks� on which the rest of the thesis is built. The meta data is not complete because Open Calais does not identify �industry sectors�. This issue will be addressed in the next chapter. The work produced in relation to this chapter produced a RSS crawler which was fast, robust and extracted text without the need for manual intervention.
Chapter 3
Ontology-based Information Retrieval This chapter details an information retrieval system which uses ontologies to identify strongly related news to a �monitored company�. The information retrieval was necessary because the initial experiments with freely available news stories revealed that there was limited amounts of news for individual companies. There were often large intervals where there was no news available in our corpus for large well known individual companies. For example, in the news story corpus there were only four news stories which directly referred to �Microsoft� published between the 8th of January 2009 and the 16th of January 2009, three of which were published on the 8th and one on the 16th. A trading system which relied on these small volumes of news would only be able to trade infrequently. A proposed solution to limited volumes of company speci�c news was to use directly related news stories. Directly related news is news which does not mention a company by name, but has a strong connection with a monitored company. For example, a news story concerning computer technology is directly related to �Microsoft� because Microsoft produces computer software and hardware. The use of related news to estimate the direction of a company share prices utilizes an e�ect known as �spill-over� [Hafez, 2009] where news from a single company can provoke changes in share prices in a large number of related companies. Related news can be located by identifying terms in news stories which have a identi�able relationship with the monitored company.
Terms can be any form of linguistical unit, for example,
unigrams, bigrams or multiword expressions.
A common strategy for identifying related
news is to use ontologies which describe relationships between nouns.
The relationships
Bill Gates (proper noun) works (verb) for Microsoft In this case, the proper noun Bill Gates has an identi�able relationship consequently news stories which contain the proper noun Bill Gates could
are described with verbs, for example (proper noun). with Microsoft,
be used as related news to Microsoft.
There are a number of pre-built ontologies which
may be used in identifying related news stories. used two pre-built ontologies:
The initial experiments for this chapter
Cyc [Lenat, 1995] and ConceptNet [Liu and Singh, 2004].
38
CHAPTER 3.
ONTOLOGY-BASED INFORMATION RETRIEVAL
ConceptNet assertions rely upon the
39
Open Mind Common Sense Project [Singh, Lin, Mueller,
Lim, Perkins, and Zhu, 2002] which used a website to allow people to enter �common sense� assertions about speci�c subjects. ConceptNet has a large number of assertions, but an initial evaluation in 2009 revealed that there were errors in ConceptNet caused by vandalism and a lack of information about companies. Experiments using ConceptNet to identify related news produced poor results.
Cyc is also a large �common sense� ontology which included
information about companies.
An evaluation in 2009 of the open source version of Cyc
(OpenCyc) revealed that the information about companies lacked detail.
In addition the
update schedules of OpenCyc were not frequent, consequently out of date information in OpenCyc was not corrected rapidly. Experiments in 2009 with OpenCyc to identify related news were not successful. In summary, the available pre built resources were not suitable for the task because of: 1. errors, 2. out of date information and 3. lack of company speci�c information. The proposed solutions used ontologies to map relations between nouns (entities) to identify terms in news stories which had a relationship with a monitored company. The �rst approach created an ontology which mapped relations between industry sectors. Industry sectors were entities which described a collection of companies, for example �car industry� describes a collection of companies which produce cars. Companies can be members of more than one industry sector.
Related news for a monitored company was selected by identifying news
which contained members of the same industry sectors as the monitored company as well the industry sectors the companies were a member of.
The second approach mapped the
domain of a monitored company on a day to day basis. Outdated information was removed whilst new information was added. Related news was identi�ed by locating company speci�c entities in news stories. In both approaches, the related news stories were outputted in XML for further experimentation. The ontology research �eld uses various terms which represent a similar notion.
This
paragraph will de�ne a series of terms and their meaning which will be used in this chapter. An ontology is a computational ontology which formally models a structure of a system [Staab and Studer, 2004b]. An ontology contains: concepts, entities and relations [Staab and Studer, 2004b].
An entity represents the most �general being� and incorporates: subjects, objects
and processed items [Staab and Studer, 2004b].
Related entities can be grouped together
into concepts such as People and Companies. Entities are linked by relations. The relations describe the nature of relationship between the entities. An assertion is an instruction which creates: relation, concept or entity. A reassertion is a repetition of a previous assertion. An attribute is a value assigned to either: a relation or entity. The chapter uses terminology to describe the life cycle of an ontology. will describe the terminology. construction, 2.
population, 3.
This paragraph
The ontology life cycle can involve the following steps: maintenance and 4.
evaluation.
1.
The construction phase
CHAPTER 3.
ONTOLOGY-BASED INFORMATION RETRIEVAL
involves creating the structure of an ontology.
40
The creation of a structure of an ontology
typically involves the creation of concepts. The population step is the population of concepts with entities and the linking of entities. The maintenance phase involves the addition of new entities and the removing of erroneous entities. The evaluation phase involves the estimation of the �tness of the ontology for its designated purpose. This chapter will describe the following: 1. related work, 2. industry ontology, 3. company speci�c ontology and 4. ontology news recall. The related work describes previous work which is related to the work described in this chapter. The industry ontology section describes a method of constructing an ontology based upon the �natural grouping� of companies under related industries.
The company speci�c ontology describes a method of constructing an
ontology for a speci�c company and adapting it over time to allow for changes in the company's domain. The ontology news recall compares the performance of both the industry and company speci�c ontology for identifying related news in a information retrieval system for a speci�c company.
3.1 Related Work The literature search for this chapter encompassed it's main contributions:
1.
ontology
construction / maintenance, 2. news recommendation and 3. query expansion. This section will describe the relevant state of the art for each of the areas which in�uenced the work in this chapter.
3.1.1 Ontology Construction There are a number of generic works which propose general methods for constructing ontologies from text. Lee, Kao, Kuo, and Wang [2011], proposed concept clustering and episodes. An episode was a triple of: term, Part of Speech Label(POS) and location in a sentence. Dahab, Hassan, and Rafea [2008] suggested the use of semantic patterns, for example synsets from WordNet [Fellbaum, 1998], to construct an ontology. These strategies may be e�ective as general methodologies, however there was no evaluation of these techniques on �nancial news. Financial news domain has speci�c problems which these strategies do not address, for example the identi�cation of similar products or �nancial instruments. There have been some attempts to model information gathered from the news [Newman, Chemudugunta, Smyth, and Steyvers, 2006][Vargas-Vera and Celjuska, 2004] [Lloyd, Kechagias, and Skiena, 2005], but the knowledge captured was for a demonstration of a technique, rather than to produce a rich representation of background knowledge.
Newman,
Chemudugunta, Smyth, and Steyvers [2006] constructed topic maps using co-occurrence of named entities in related topics from stories published in the �The New York Times�. The
CHAPTER 3.
ONTOLOGY-BASED INFORMATION RETRIEVAL
41
topic maps were a representation of New York Times stories rather than a detailed illustration of the �nancial / business domain. Vargas-Vera and Celjuska [2004] populated a hand-crafted ontology with news information, but there was no error control. Finally, Borsje, Levering, and Frasincar [2008] used a hand-crafted ontology to represent a general �nancial domain which was used to select news. There are a number of semi-supervised / unsupervised strategies which use a seed set of concepts to construct an ontology. These concepts are expanded and consequently the ontology is enriched with new information.
Levering, Frasincar, and Borsje [2009] demonstrated a
strategy for constructing a domain ontology from news stories. The strategy followed was: 1.
user selects seed set of news stories, 2.
extract concepts from seed set of news stories
and 3. populate the ontology with extracted concepts. The concepts in the domain ontology were used in a news recommender to select news stories. this process:
1.
There are some drawbacks to
humans may select a small or inadequate number of stories to generate
an adequate ontology, 2.
no adaptation of ontology to accept new information or remove
outdated information. It is possible to expand a small manually selected seed set. The literature review revealed some relevant approaches.
For example, concepts can be expanded with synonyms from
WordNet [Fellbaum, 1998], i.e, the concept �Car� can be expanded to auto, automobile, machine, motorcar.
There have been attempts to measure the relevance of synonyms to
seed concepts which can assist in the expansion of a domain ontology [Lee, Kao, Kuo, and Wang, 2011].
General linguistic resources were not suitable for the target domain
because they do not contain domain speci�c language, for example, WordNet does not contain synonyms for common business terms such as companies, products, etc. This ensured that the aforementioned strategies could not be adapted for the problem domain.
3.1.2 Ontology Maintenance The research literature revealed a number of approaches for ontology maintenance. The target domain is dynamic and a derived ontology would require the addition of new information and deletion of errors and outdated information. The literature review discovered semi-automatic methods [Gargouri, Lefebvre, and guy Meunier, 2003] and strategies for collaborative environments [Noy, Chugh, Liu, and Musen, 2006] for ontology management. These techniques were used to expand ontologies rather than to provide active error control. Facts in business news can be volatile because of the dynamic nature of commerce. A source of errors in a company speci�c ontology could be outdated relations which represent an assertion which was once true.
A determination of the life of a relation and its removal
from the ontology when the relation's life has expired may reduce this type of error. The literature review yielded an approach which assumed a relation to be true until a contravening
CHAPTER 3.
ONTOLOGY-BASED INFORMATION RETRIEVAL
event [McCarthy, 1986].
42
A contravening event renders the relation false.
For example, a
person is employed by a company until the employee is: 1. dismissed, 2. resigns, 3. retires or 4.
dies.
The contravening event is any item of the previous list.
A problem with the
mass media is, it does not publish all available news [McManus, 1988] and consequently a contravening event may not be published.
A maintenance strategy must be able to infer
a contravening event. A possible solution was proposed by Dean and Dean and Kanazawa [1988] who used temporal reasoning to infer a contravening event by using a lattice of discrete previous events partially ordered in time. The lattice was used to compute a probability of a contravening event. A high probability of a contravening event would invalidate a relation. This approach relied upon previous events being known. This approach would be unsuitable because: 1. economics of news publishing and 2. companies are not compelled to make all their data public. An ontology which changes overtime can be often referred to as a �dynamic ontology�. An ontology which has been favourably evaluated at the end of construction phase may at other speci�c points in time not accurately represent the target domain.
An evaluation
of the evolution of the ontology over time would be required. There have been a number of attempts to evaluate dynamic ontologies over time.
Murdock, Buckner, and Allen [2010]
proposed two metrics: 1. volatility score which measures structural stability over time and 2. violation score which measures the semantic �t between an ontology's taxonomic structure and the distribution of terms in an underlying text corpus. These measures make an explicit assumption that the ontology should be stable overtime. Facts in news are inherently unstable and therefore any ontology generated from it would be volatile. This feature of news ensures that the evaluation scheme proposed by
Murdock, Buckner, and Allen [2010] would be
unsuitable for this domain. An alternative to evaluating dynamic ontologies for errors is to control the evolution of the ontology overtime to minimise the addition of errors to the ontology.
One approach
is to use �design patterns� to identify errors and propose resolutions [Djedidi and Aufaure, 2010][Djedidi and Aufaure, 2009]. Djedidi and Aufaure [2010] used three design patterns in a pipeline.
The patterns were:
change, inconsistency and alternative.
is a process by which a change in an ontology is speci�ed.
The change pattern
The inconsistency pattern
identi�es possible logical inconsistencies in the ontology created by the proposed change. The alternative pattern provides resolutions to the logical inconsistencies in the ontology identi�ed by the inconsistency pattern. A variation of this approach was proposed by Scharrenbach, d'Amato, Fanizzi, Groutter, Waldvogel, and Bernstein3 [2010]. They used description logics, which is a form of schema for ontologies, to control ontology evolution. This approach also concentrated on resolving logical errors in an ontology. These techniques did not consider resolving errors which were due to false information because there was no ground truth to compare the ontology against.
CHAPTER 3.
ONTOLOGY-BASED INFORMATION RETRIEVAL
43
3.1.3 Query Expansion Query expansion is relevant for the target task of retrieving news that is relevant to a target company because it is not possible to manually construct a de�nitive query to locate all possible relevant news stories in a corpus.
An automatic process of identifying relevant
terms is required.
the process of reformulating a seed query to improve retrieval performance in information retrieval operations. For example, original query keywords can be expanded
Query expansion is
with synonyms from lexical resources [Voorhees, 1994] such as WordNet [Fellbaum, 1998]. The advantage of this approach is that it was automatic and consequently the term expansion could be large. Large �common sense� ontologies such as Cyc [Lenat, 1995] or ConceptNet [Liu and Singh, 2004] can be used to expand initial queries with similar concepts which may not have a lexical relationship, but a semantic relationship [Akrivas, Wallace, Andreou, Stamou, and Kollias, 2002]. A �semantic query� may use named entities [Akrivas, Wallace, Andreou, Stamou, and Kollias, 2002] as keywords in the query, for example, company names.
A
hypothetical query expansion could be to expand the original company name with names of companies which manufacture similar products. There is one further alternative to the lexical and semantic query expansion, corpus based query expansion. Corpus based methods rely upon statistical association between terms in a corpus [Bhogal, Macfarlane, and Smith, 2007].
A typical use of corpus methods is �term clustering�.
In the example described by
Bhogal, Macfarlane, and Smith [2007], the document collection was clustered, and if the terms in the query appeared in
n
documents (n being a pre-set constant) in the cluster then
the whole cluster was returned. The assumption was that documents in a cluster contained language related to the initial query term. To summarize, there are three main approaches to query expansion: 1.
lexical, which is
dependent on language speci�c relations between keywords, 2. semantic, which is dependent on semantic relations between keywords and 3. corpus, which is dependent upon statistical associations between keywords.
3.1.4 News Recommendation News recommendation is a speci�c type of information retrieval which uses latent relationships in news to �personalize� news content for a speci�c reader. There are arguably two types of news recommendation: content based and semantic based [IJntema, Goossen, Frasincar, and Hogenboom, 2010]. The content based systems use statistical measures to recommend news. For example: the �NewsDude� and �YourNews� systems use a Term Frequency Inverse Document Frequency (TF-IDF) which is a weighting scheme which computes a term's weight in a speci�c document by its frequency in the document compared its frequency in the whole document collection [Liu, 2007c]. Content based systems are not limited to TF-IDF
CHAPTER 3.
ONTOLOGY-BASED INFORMATION RETRIEVAL
44
indexing, but can use �article similarity� in a collaborative �ltering environment [Kompman and Bielikova, 2010] to recommend the
most similar articles
to the last read news story.
The inherent weakness of the content based systems is that they ignore the latent relations contained in news stories. A competitor to the content based systems are the �semantic� news recommender systems (SNRS) [IJntema, Goossen, Frasincar, and Hogenboom, 2010][Cantador and Castells, 2009]. The SNRS systems often use a domain ontology to represent latent relations in a speci�c domain [IJntema, Goossen, Frasincar, and Hogenboom, 2010].
The domain ontology can
store �concepts�. A concept is an instantiation of a class which holds values and relations to other classes. A class is a collection of concepts which can be contained in a pre-determined hierarchy.
For example Apple could be of class �company�.
The SRNS systems have the
advantage of knowing the class of the news terms they are evaluating.
In the previously
mentioned �Apple� example a content based system may return stories about: 1. fruit , 2. The Beatles (Apple was a company founded by The Beatles in the 1960s) and 3. Apple the computer company. The SRNS systems will able to evaluate the �class� of the concept and return stories from the target domain - Apple - the computer company.
The SRNS
systems can use a variation of statistical measures to compute the �importance� of the concept to the total document collection, for example: Goossen, IJntema, Frasincar, Hogenboom, and Kaymak [2011] proposed the Concept Frequency Inverse Document Frequency (CFIDF) which is a variant of TF-IDF. CF-IDF computes the relevancy of a news story by: 1. identifying concepts which co-occur in a news story, 2. calculating the frequency of the concepts in the news story, 3 . computing the frequency of the concepts in the whole document collection and 4. normalizing the news story score by the number of times the concept appears in the collection. In addition to knowing the class of a concept, SNRS systems can recommend similar news stories by identify articles which contain related concepts, for example news stories about competitors [Goossen, IJntema, Frasincar, Hogenboom, and Kaymak, 2011]. The SRNS are not limited to using one general domain ontology to identify latent relations in news.
The news story itself can be represented as a specialized ontology, a taxonomy.
Mannens, Coppens, Pessemier, Dacquin, Deursen, and de Walle [2010] used a variety of specialized web services (Open Calais, Zemanta, etc.) to extract named entities and a�x an unique resource identi�er (URI) to the extracted relation. The relations between each named entity were identi�ed and incorporated into a
global knowledge base.
The
global knowledge base
was used in conjunction with user pro�les to recommend news. The user pro�les contained the �habits� of the user, consequently information in the
global knowledge base
could be
used to identify related stories which had a relationship with the concepts stored in the user pro�le of a speci�c user.
An alternative approach proposed by La²ek [2011] was to use a
pre-computed general ontology, DbPedia [Auer, Bizer, Kobilarov, Lehmann, Cyganiak, and Ives, 2007], to identify relations between named entities in news stories. DbPedia is a project to extract structured information from Wikipedia and represent it as a knowledge base. The
CHAPTER 3.
ONTOLOGY-BASED INFORMATION RETRIEVAL
45
resource is described in RDF and therefore entries are linked to each other with a description of the relation. La²ek [2011] used DbPedia to identify relations between named entities in news stories to recommend news.
3.2 Industry Ontology The aim of the work described in this chapter is to locate relevant news to a target company through a query expansion process which uses a lexical resource. The �rst proposed method is to construct an Industry Ontology for use in a future query expansion process. Related companies can be grouped together under a single moniker which describes the function of all of the related companies, for example
The Car Manufacturing Sector
where
each company grouped under this title will be involved in the construction of vehicles. Phrases or terms which describe a related group of companies are often referred to as business or industry sectors because they refer to a subset of activity of the general economy.
The
identi�cation of industry sectors and their related companies can assist in the determination of the economic prospects of an individual company by propagating the e�ects of industry sector level news to the related companies.
In this context news which is relevant to an
industry sector should be relevant to its member companies. A company can be a member of more than one industry sector.
For example, Microsoft
produces an operating system for mobile devices as well as for personal computers, consequently Microsoft can be a member of an industry sector which represents: mobile computing, software development, computer technology and telecommunications.
This basic example
demonstrates that the manual assignment of companies to industry sectors would have taken a signi�cant amount of time. The work undertaken had two aims:
1.
identify industry sectors in news stories and 2.
assign companies to each industry sector. The �rst step is a named entity extraction phase which extracts industry sectors and adds them to the ANNIE Gazetteer. The second step uses company names and industry sectors from the ANNIE Gazetteer as well as prede�ned rules to assign companies to industry sectors. The hierarchical relationship between industry sectors and companies was represented as an ontology.
3.2.1 Industry Sectors Identi�cation The named entity extraction phase used linguistic patterns to identify industry sectors. This technique was preferred to supervised machine learning techniques [Nadeau and Sekine, 2007] because a supervised strategy may require large amounts of labelled data which would have required a signi�cant manual resource which was not available.
The initial experiments
required a series of seed extraction patterns (regular expressions) to extract an initial sample
CHAPTER 3.
ONTOLOGY-BASED INFORMATION RETRIEVAL
of industry sector titles.
46
A possible hypothesis was a Noun Phrase (NP) which contained
the word �industry� would be an indicator of an industry sector. Evidence was required to support the hypothesis and therefore a list of words which were part of known titles was created. The list included words: �car�, �banking�, ��nance�, etc. This list will be referred to as
The Known Industry Sector Variable List.
A regular expression was created where one
word either side of the words from the Known Industry Sector Variable List was extracted. For example, the NP
the car industry would be extracted as �the ...
industry�. The extracted
phrases were counted. A sample of the words returned by the regular expression can be found in Table 3.1. The most frequent NP extracted by the regular expression contained the word:
industry.
This simple experiment provided partial evidence to support the initial hypothesis.
Frequency 1046 952 906 815
Pattern the ... industry GAAP ... measures the ... sector the ... crisis
Table 3.1: Extracted phrase delimiters for known collective entities. The industry section extraction task was not limited to NPs containing the word, �industry� because it would limit industry sector extraction to a subset of possible industry sector titles. It was possible to increase the number of industry sectors detected by expanding the anchor term, �industry� with synonyms. The synonyms were taken from The Oxford Thesaurus Of English [of English, 2010].
This list will be referred to as
The Industry Synonym List.
A
new regular expression was created to extract three word phrases where list items from The Industry Synonym List constituted the second word. A manual inspection indicated that a large number of phrases were not industry sector titles. These phrases contained one or more of the following: stop words, numbers, continuations, adjectives, verbs, comparisons, and quanti�cations. A number of new regular expressions were created, which were variations of the previously described pattern. The variant patterns contained one or more re�nements. Table 3.2 describes the regular expression re�nements as well as its subsequent accuracy and number of phrases returned.
Pattern the Word Industry Synonyms the Any Word Industry Synonyms (-Industry) Word Word Industry the Word Industry
Accuracy 0.33 0.36 0.72 0.98
No. Phrases Returned 23344 5033 3753 1450
Table 3.2: No. = Number. Each run was measured with the following criteria: accuracy and number of phrases returned.
CHAPTER 3.
ONTOLOGY-BASED INFORMATION RETRIEVAL
47
It was not possible to verify all of the extracted industry sector titles because of the large number of candidate phrases, consequently the accuracy of each term was calculated by the veri�cation of the 100 most frequent phrases. The candidate industry sector titles' frequency in the corpus followed a Zipf 's distribution [Zipf, 1949] and therefore a low accuracy amongst the most frequent candidate titles would impair greatly the overall accuracy of the developed resource. It was not possible to calculate a recall �gure because there was no exhaustive list to compare the titles against, consequently a �raw number of phrases returned� value was calculated. A new regular expression was created for each item in The Industry Synonym List.
The
regular expression used the most e�ective re�nement described in Table 3.2, which was the word �the� as the �rst word and the list item as the third word in the three word pattern. The 100 most frequent candidate industry sector titles were extracted.
The second word
of each correct candidate (industry sector variable) phrase was compared to the industry sector variable of candidate phrases generated by the industry pattern. the candidate phrase variable.
The Finance Sector, the word �Finance�
For example, in
would be the industry sector
Each correct industry sector variable identi�ed by patterns without the word
�industry� was also contained in the list of industry sector variables generated by the industry pattern. The �nal list was calculated by extracting the correct terms from the industry list and duplicating the phrase for each term. The duplication consisted of replacing the term �industry� with the new term. The above experiments were with single term patterns.
A further number of experiments
were made with multi-word patterns. The patterns identi�ed the word �the� and up to three words and then a word from The Industry Synonym List (�industry�, �business�, etc). There were substantially less extracted terms, and these candidate terms were hand checked. The terms were expanded in the same manner as the single term candidate phrases.
3.2.2 Assigning Companies to Industry Sectors The ANNIE Gazetteer holds a small list of companies.
It was necessary to expand the
company list to ensure that there were a su�cient number of companies to assign to each industry sector. The expansion of the company list was achieved by extracting companies from the Open Calais meta-data. The Open Calais [Reuters, 2010a] web service uses a series of rules to identify named entities in text rather than extracting terms from a comprehensive dictionary, consequently the Open Calais erroneously identi�ed terms as companies. A list constructed with all the �companies� from the Open Calais meta-data had numerous errors. A solution was to record the frequency of individual companies in the Open Calais meta-data. A �cut-o� � �gure could be computed and companies which had a frequency of less than the cut-o� would be removed. The rational behind this strategy was erroneous company names appeared infrequently in the meta-data.
The �cut-o� � �gure was calculated by setting an
CHAPTER 3.
ONTOLOGY-BASED INFORMATION RETRIEVAL
48
initial cut-o� �gure and taking a sample of the company names with the lowest frequency. If there was an error then the cut-o� �gure would be increased until there were no errors in the sample. At the end of the exercise 42,823 company names were extracted. The strategy for learning members of industry sectors relied upon the co-occurrence of a company with an industry sector. The text held in the corpus was parsed with the ANNIE Gazetteer. recorded.
The location of each industry sector and company in each separate text was There were two alternate methods for computing the members of an industry
sector:
•
Company Proximity to the industry sector, i.e.
industry sector and company co-
occurred in the same sentence
•
Headline proximity, i.e. industry sector was present in the headline and company was present in the text.
A manual inspection of sentences where industry sector and companies co-occurred revealed that there were a number of occasions where the company was not a member of the industry sector. The cause of the lack of relationship between the company and the industry sector was that the company was a 3rd party commenting on the status of the industry sector. For example, an analyst from �nancial services could be commenting on the economic prospects of the industry sector �Car Industry�. To assist the co-occurrence process two JAPE rules were constructed.
The JAPE rules
identi�ed companies which had no direct relationship with the co-occurring industry sector. The rules were:
•
Rule 1: Pattern = Consultant synonyms
•
Rule 2:
of|from|
Company
Pattern = Possessive form of a company name
→
exclude company
Person's Name
→
exclude
company
An industry sector contained in a headline of a news story may indicate that the following news text has a strong relation with the industry sector [Andrew, 2007].
The proposed
hypothesis was because there is a commonly accepted relationship between text and headlines, consequently there may be a relationship between companies in the news text and industry sectors in the headline. For example a news story published by Reuters had the headline:
Signs point to U.S. car industry's resurgence
1.
The industry sector in the headline was
the �Car Industry�. The text made references to �Nissan Motor Co.�, �Hyundai Motor Co.� and �Ford Motor Co.� who are car manufacturers and are part of the �Car Industry�. This
1
http://goo.gl/QmgAc
CHAPTER 3.
ONTOLOGY-BASED INFORMATION RETRIEVAL
49
co-occurrence experiment populated the industry sector in the headline text with all the companies discovered in the news text. The evaluation of the co-occurrence experiments was by manual inspection.
It was not
possible to validate every industry sector and their associated company members.
The
evaluation was by selecting a number of industry sectors and validating their members. There was a single evaluator. An industry sector member was deemed to be correct if: 1. it was known to the evaluator or 2. the membership could be con�rmed through legitimate resources on the Internet, for example company websites. There were two evaluation measures: accuracy and number of industry sectors returned. The accuracy �gure referred to the percentage of companies which were correctly assigned to an industry sector. The range was from 0 (none correct) to 1.0 (all correct). The returned �gure referred to the total number of companies assigned to an industry sector in the extracted sample. The results are displayed in Table 3.3.
Experiment Type Headlines Same Sentence
Accuracy 0.66 0.77
No. Ind. Sectors Returned 630 3535
Table 3.3: No = number and Ind. = Industry. The co-occurrence strategy which assigned companies to industry sectors when they appeared in the same sentence was clearly the superior strategy. The number of companies assigned was greater than the headline strategy and it was more accurate. This strategy was used to assign the companies to the industry sector which was represented as an ontology.
3.2.3 Ontology Re�nements The industry sector member companies can be known by a variety of names, for example: IBM may be known as International Business Machines, IBM or �Big Blue�. A standardization of the names was required because not all variants of the company may be contained in all relevant industry sectors because the ontology would become too large to manage with the available software tools. The name standardization was achieved through information in the Open Calais meta-data. The Open Calais web service a�xes a Uniform Resource Identi�er (URI) to each named entity it detects. The URI points to a �landing page�. The landing page has a standard name for the named entity as well as a further URI which points to a �linked data page� which contains further information.
The �rst step in the standardization step
was to assign the same standard names to companies which pointed to the same �landing page�.
The second step was to use the �SameAs Relation� in the linked data page.
The
�SameAs� relation pointed to companies which were the same as the company described in the linked data page. The �SameAs� relations typically pointed to acquisitions or subsidiaries
CHAPTER 3.
ONTOLOGY-BASED INFORMATION RETRIEVAL
50
of a speci�c company. In common with company names, industry sector names may have many variants, for example
the car manufacturing business may be referred to as the the automotive construction sector or the car construction business. The standardization removed the �determiner� (typically �the�) and the last word which would be an entry from the industry synonym list, consequently
The Finance Industry
and
The Finance Business
ontology with the name �Finance�.
was represented as a single entry in the
The company members of each industry sector were
added to the single entry in the ontology. Tables 3.4 and 3.5 provide examples of 1. industry sectors and their members and 2. companies and their encapsulating industry sectors from the industry ontology. Sector
Members
Web
AOL ,CFC , Ebay, Google, Heroku, Microsoft Nature, News Corp, Shopify, Sun, Times, Virgin Warner, Yahoo, iPharro, The Times
Utilities
AXON, American Electric Power ,BTS Group AB, Centrica, Drax, ETFs, Electric, Energy, HCL, IDC, LNG, Severn Trent, There
Video-Conferencing Television
Cisco, Bell Laboratories ABC, CNN, CSI, Carlton, Dish Network, Ensequence, FA, General Electric, Lifetime, News Corp, Next, Nielsen, Nintendo, One, Operating, PRS, SONY
Table 3.4: Examples of sectors and their members.
This method produced a detailed ontology which grouped together related companies under a common industry.
The grouping of companies revealed expected areas of well known
companies, for example, Google and search as well as some unexpected areas, for example, Microsoft and cars, which on further investigation revealed a direct link between the company
2
and sector .
3.3 Company Speci�c Ontology The second strategy for constructing a lexical resource for query expansion is to construct a company speci�c ontology. The
company speci�c ontology
is a strategy which constructs an
ontology which models the company's system on a day to day basis. A company's system represents entities which have an indirect or direct connection to a company. These items may include: people, companies, products, etc. The ontology changes to re�ect changes in
2
Microsoft produces software for cars,http://goo.gl/sn9Ye
CHAPTER 3.
Microsoft
ONTOLOGY-BASED INFORMATION RETRIEVAL
51
advertising, auto, automobile, automotive, banking, chip, communications, computer,computing, consumer, content, design, device, digital, electronics, energy, entertainment, equipment, game, games, gaming, global, handset, hospitality, hosting, infrastructure, insurance, internet, mainframe, media, mobile, networking, porn,search, securities, semiconductor, server, services, smartphone, software, software and internet, tech, technology, telecom, telecoms,web, wireless
Apple
advertising, book, car, cellphone, chip, communications, computer, computing, consumer, content, education, electronics, energy, entertainment, games, global, graphics, handset, hardware, hosting, laptop, media, mobile, music, netbook, phone, publishing, radio, record, recording, smartphone, software, tech, technology, telecommunications, telecoms, video, wireless
IBM
airline, analytics, automotive, banking, chip, computer, consulting, content, database, hardware,internet, laptop, mainframe, media, networking, pharmaceutical, semiconductor, server, service, services, software, storage, tech, technology, telecom, telecoms
Google
advertising, book, computer, consumer, content, digital, display, electronics, handset, hardware, internet, media, media and telecom, mobile, music, networking, news, newspaper, online, phone, publishing, search, services, smartphone, software, software and internet, tech, technology, telecom, telecommunications, telephone, translation, video, web
Table 3.5: Examples of companies and their industry sector memberships in alphabetical order.
the company's system such as management succession. The ontology was used to score and rank news stories for a chosen company. The
company speci�c ontology
strategy is a two part process which has: a construction phase
and a maintenance phase. The construction step is an iterative process which initially selects a small highly relevant set of news stories with �headline keywords� (name of company). Entities and relations were extracted from the news story text. The extracted entities and relations were used to construct a base ontology. The keywords were expanded with entities from the base ontology. The new keywords were used to identify new stories where entities and relations are extracted to enrich the ontology. The process was repeated until there was no more news stories to process. The process produced a detailed company speci�c ontology. The maintenance phase is predicated upon the redundancy of �facts� in news stories. The news publication process ensures that facts are repeated in multiple information sources and at regular intervals over time.
The maintenance process assigns a value to a relation and
CHAPTER 3.
ONTOLOGY-BASED INFORMATION RETRIEVAL
52
reduces the value until a predetermined value when the relation is deleted. The relation's value is refreshed when its assertion is repeated in a news story. An entity is deleted when it has no relations. �Valid facts� are retained because they are repeated regularly in news stories. Errors or outdated information is expelled because the error or outdated information is not repeated in additional news stories.
3.3.1 Ontology Construction The ontology construction strategy relies upon entities and their relations being explicitly stated in news text. The detection of entities and their relations was with the Open Calais Web Service. News text was sent to Open Calais which returned the news story's meta-data in Resource Description Framework (RDF) language.
The meta-data contained:
named
entities, named entity's relations with other named entities and a news story categorization. A named entity is a section of text which has been classi�ed into a pre-existing category such as company or person. A named entity is synonymous with an entity in an ontology. The meta-data provided the basics of an ontology: named-entities (entities), relations (relations) and named entity category (concepts). The meta-data provided a Uniform Resource Identi�er (URI) for each named entity. The URI acts as an unique identi�er for each named entity and on occasion acted as a link to external information. This external information is known as �linked data�. This external information was also represented in RDF and contained the units to construct an ontology. The company speci�c ontology was constructed from information in news stories and its associated linked data. The Open Calais' named entities and their categories were directly used to represent entities and their concepts, but the Open Calais relations required processing. The relations in the meta-data connected entities with more than one entity. The relation extraction split the relations into separate binary relations. A binary relation connects one entity with another entity. A binary relation is invertible which allows the inference of new relations. For example, the relation,
Microsoft employed Bill Gates.
Bill Gates worked for Microsoft
can be inverted to read
The relation description supplied by Open Calais was �verbose� and inconsistent. A name normalization process was used to provide a descriptive and consistent relation name. The name normalization process relied upon a normalization table which held pairs of concepts (class names) and their relation name. The relation names table was hand constructed and represented all possible concept combinations available in the Open Calais meta-data. The normalization table was used to return the normalized relation name. Other tables held pairs of incompatible concepts, which identi�ed incorrect relations in the Open Calais meta-data. A simple ontology could now be extracted from a single news story and therefore a large number of news stories could be used to create a detailed ontology. The company speci�c strategy
CHAPTER 3.
ONTOLOGY-BASED INFORMATION RETRIEVAL
53
required the construction of an ontology which represented a single company, consequently only �relevant� news stories to the chosen company could be used as ontology building blocks. The process of constructing the ontology was in two steps. The �rst step had the goal of constructing a base ontology using news stories that we were highly con�dent to be related to the target company. This base ontology was then to be improved in the second step of the process. News stories which contained the company name were selected to build the base ontology because there is a known relationship between headlines and news text [Andrew, 2007]. An additional set of similar stories were added. The criteria for a story to be added were: 1. linked by a hyperlink in the story's html to one or more of the stories initially selected and 2.
parent html element of the hyperlink had a �linguistic clue� in its text property.
The
linguistic cues used in this process are in Table 3.6. The relevance of the linking provided by the cues was con�rmed by a manual inspection. In summary, an initial set of seed stories was build by checking the presence of the company in the news headlines and by also selecting stories referred as related to these by means of linguist cues.
Relations and entities were
extracted from this seed set of stories to construct the base ontology. Linguistic Cues Related Stories Related Articles More on this Story We Recommend From around the web
Table 3.6: Examples of linguistic cues.
The next step of the ontology construction is strongly based on a notion of similarity between other potentially useful news stories and the base ontology constructed in the �rst step. This notion of similarity was de�ned as the intersection of the entities in a news story and the entities in the base ontology, as de�ned in Eq. 3.1,
Sim(N, O) = where
Ent(N )
|Ent(O) ∩ Ent(N )| |Ent(N )|
is the set of entities in the news story
the base ontology
N,
and
Ent(O)
(3.1)
is the set of entities in
O.
This notion of similarity was used to improve the base ontology as follows. For all remaining stories not belonging to the initial set used to obtain the base ontology, if their similarity score was higher than a threshold their relations and entities were extracted and added to the ontology. This process of improving the base ontology is detailed in Algorithm 5. This
CHAPTER 3.
ONTOLOGY-BASED INFORMATION RETRIEVAL
54
algorithm includes as input parameter the similarity threshold. In this study the value of this threshold was selected for each company using the following heuristic process. The remaining stories mentioned above were split into 5 di�erent subsets according to their similarity score. Each subset contained stories whose similarity score was in one of the following intervals:
[0, 0.2[, [0.2, 0.4[, [0.4, 0.6[, [0.6, 0.8[, [0.8, 1].
From each of these subsets of stories a random
sample of stories was selected. The resulting set of stories contained stories with a reasonable diversity of similarity scores.
These stories were ordered by similarity score and we have
manually determined the value of the threshold as the score above which all stories were related to the target company.
Algorithm 5: Ontology Enrichment. Input: candStories - set of stories not used for building the base ontology Input: Input: O - the base ontology Input: Input: simThr - the similarity threshold forall the (sincandStories) do if (sim(s, O) > simT hr) then O < −AddConceptsT oOntology(O, s)
return (O)
3.3.2 General Ontology Adaptation Strategy A baseline evaluation was made with ontologies built with the ontology construction strategy. The ontology construction experiments had been conducted with news stories crawled from January 2009 to August 2010. The baseline evaluation was conducted on data which was not used in the construction experiments to ensure that the proposed ontology construction methodology was not biased to the data in the initial experiments. At the time the evaluation was conducted there were 53 days of news story data which had not been used in the initial construction experiments.
The target company selected for the evaluation was Microsoft
because: 1. it is a large company which often features in the news and 2. the company is well known.
A series of ontologies were generated for �Microsoft�, one for each day.
The
generation of an ontology was from news stories available before the ontology was generated, i.e.
an ontology generated on day 1 would have access to one day of news stories and an
ontology generated on day 53 would have access to 53 days of news stories. An ontology was chosen at random (day 18) for evaluation. The evaluation of the ontology was with Vrandecic's [Staab and Studer, 2004a] tests which were: Accuracy, Clarity, Completeness, Computational e�ciency, Conciseness, Consistency. The evaluation was conducted manually by a domain expert.
The ontology was too large to evaluate in its entirety,
consequently the entity with the most relations was chosen for the validation tasks.
The
evaluation methodology obliged the evaluator to positively validate errors, consequently a
CHAPTER 3.
Test Name Accuracy
ONTOLOGY-BASED INFORMATION RETRIEVAL
55
Evaluator Comments The entity with the most relations was the Microsoft entity. Microsoft entity contained 436 relations.
The
61 relations were positively
veri�ed as incorrect Clarity
The number of assertions were large, in-excess of 11,000. There were 10 class types and 20 relation types. Each class and relation type conformed to Vrandecic's [Staab and Studer, 2004a] tests of understandability and transparency.
Completeness
The Microsoft entity's relations were veri�ed for completeness. were a number of unveri�able relations, for example
the Governor of California,
There
Microsoft employs
however the veri�able relations provided a
rich description of the domain.
The assertions exceeded the experts
knowledge and ability to locate all valid relations. Conciseness
The ontology contained a number of irrelevant axioms, for example
Microsoft employs current CEO Consistency
There were a number of axioms which were inconsistent, for example the ontology asserted that both Microsoft and Adobe produced Acrobat Reader.
Table 3.7: Baseline ontology evaluation comments.
relation was assumed to be �correct� if it could not be veri�ed as incorrect.
There was
limited time to verify relations and consequently it was necessary to restrict the e�ort spent on veri�cation. A positive error identi�cation ensured that the manual veri�cation task could be completed in the allocated time. The annotators comments are in Table 3.7. The initial ontology failed three of Vrandecic's [Staab and Studer, 2004a] validation tasks: conciseness, consistency and accuracy. It may have been possible that the selected ontology was atypical, and therefore an ontology which was generated at day 1 with 1 day's worth of stories was compared with an ontology generated at day 53 with 53 day's worth of news stories. The evaluator reported that the day 53 ontology had more assertions, but also more errors than the one generated on day 1. The apparent increase in errors over time necessitated the use of an error correcting strategy.
Correction Strategy The related work section described some error correction strategies which relied upon �nding logical inconstancies or measuring volatility of an ontology against a gold standard. These approaches often rely upon manual tuning or construction of a gold standard. proaches are not possible in this domain because of the lack of: 1.
These ap-
a comprehensive gold
CHAPTER 3.
ONTOLOGY-BASED INFORMATION RETRIEVAL
standard and 2.
56
an authoritative logical model of relations found in news.
The proposed
error correction strategy seeks to avoid the restrictions of the strategies described in the related work. The proposed method was predicated upon �fact redundancy� in news stories, i.e. facts which were true were repeated in multiple locations and at regular intervals. The redundancy of information is created by the dynamics of news publication. The initial story is published by an agency [Bell, 1991](Reuters, AP, UPI, AFP) and then is repeated by mass media news publishers. An example of this phenomenon was a story which concerned the appointment of a Microsoft executive to Nokia.
It was repeated in the corpus by several
information sources with slight di�erences in the headlines. The �central fact� of the story was that
Stephen Elop is the new CEO of Nokia.
This �fact� was repeated multiple times in
each story and separately by multiple information sources [BBC, 2010][Yahoo, 2010]. The proposed strategy assigns a numerical value (weight) to a relation. The relation weight is reduced until a pre-determined value when the relation is removed. The relation weight is reinitialized when the relation is asserted in a news story. An entity is removed when it has no relations. The following paragraph will describe the intuitions and de�nitions which will be used in the strategy description. The weight of a relation
r
is a time-dependent property which is updated according to the
following criteria:
•
The maximum weight is a user-de�ned constant that we will denote as
•
The weight of the relation should be maintained if the relation was re-asserted in todays'
W0 (r)
news stories
•
If the relation was not re-asserted its weight should be decreased at some rate to be de�ned below
•
If the updated weight of the relation reaches a certain user-de�ned threshold, the relation should be deleted from the ontology.
A number of concepts will be de�ned to assist the process of implementing these intuitions. Let
Stw (r)
[t − w + 1, t] that assert t. Let G be a userrelations R of an ontology
be the set of new stories appearing in the time interval
1 the relation r . In this context, St (r) will be the set of stories in day de�ned mutually exclusive grouping (partitioning) of the set of
O.
This grouping should be formed with the goal of expressing the domain knowledge
that relations on the same group are expected to have a similar assertion frequency.
The
grouping is necessary because it is expected that not all relations in an ontology have the
gr
same frequency of assertion. Let The updated weight of a relation
( w Wt+1 (r)
=
be the group to which
w (r), r, Wt+1
r
belongs, i.e.
gr = g ∈ G : r ∈ g .
is given by the following equation,
W0 (r) Wtw (r) × (1 − DRtw (r))
if
|St1 (r)| > 0
otherwise
(3.2)
CHAPTER 3.
ONTOLOGY-BASED INFORMATION RETRIEVAL
57
w is a time window size; St1 (r) is the set of news appearing today r; and DRtw (r) is the decay rate of relation r to be de�ned below. where
that assert relation
As previously mentioned , after a new weight is calculated using the above equation, the system decides whether to maintain or not the relation in the ontology based on a userde�ned minimum weight threshold. The de�nition of the weight updating rule show in Eq. 3.2 means that every time a relation is re-asserted its weight goes back to its default user-de�ned value,
W0 (r).
Otherwise, its
weight will be decreased at some rate that varies with time. The weight decay rate was designed to implement the following intuitive ideas:
•
Di�erent groups (types) of relations have di�erent expected assertion frequencies, which also vary with the company (ontology) being monitored
•
Relations whose assertion frequency is lower than what is expected should see their decay rate increase, while the opposite should also occur.
The key factors behind these ideas are: 1. how to calculate the assertion frequency of 2. how to calculate the expected frequency of assertion of
r.
on a past window
w,
r
w.
is the number of stories asserting
i.e.
AFtw (r) =
and
Given the dynamic nature of
news, these notions are de�ned as a function of the time window The assertion frequency of a relation
r;
r
per day, calculated
|Stw (r)| w
(3.3)
As mentioned before, the relations in an ontology were grouped into a set of sub-sets,
G.
The motivation is the empirical observation that not all types of relations are expected to be asserted with the same frequency. In this context, the expected assertion frequency of a
r will be de�ned as a function of the assertion frequencies of the members of the group r, i.e. gr . Namely, we are searching for relations whose assertion frequency is much lower
relation of
than expected, which provides a clear indication that they may be errors and thus should be deleted from the ontology. In this context, we are looking for unusually low values of the
AF
score with respect to the relation group. From a statistical point of view we are looking for extreme low outliers. A frequent and robust method to determine if a value is an outlier with respect to a given sample of values is the
box plot rule.
This non-parametric rule says that a
[Q1 (x) − 1.5 × IQR(x), Q3 (x) + 1.5 × IQR(x), where Q1 (Q3 ) is the 1st (3rd) quartile of the sample and IQR(x) is the respective interquartile range (= Q3 (x) − Q1 (x)). In this case, we are only interested in AF values unusually low,
value is an outlier if it is outside of the interval
i.e. below the �rst limit of the above interval. Using this statistical notion we can state that if a relation has a value of
AF
that is unusually low with respect to the
AF
scores of its
group, then its weight decay rate should be set to ensure that the relation is deleted from
CHAPTER 3.
ONTOLOGY-BASED INFORMATION RETRIEVAL
the ontology, i.e.
DRtw (r) = 1.
58
For all remaining relations, their weight decay rate will be
set as a function of their position regards the distribution of groups. The motivation is that the higher the
AF
AF
scores in their respective
score the lower should be the decay rate,
so that the weight of the relation is not decreased too much.
AF be the set of AF scores of the relations in the same group as r, i.e. {AFtw (s) : s ∈ gr }. Let k = Q1 (AF) − 1.5 × IQR(AF) be the threshold below which an AF score is considered w unusually low, in accordance to the box plot rule. The weight decay rate of a relation DRt (r) Let
is de�ned as,
( DRtw (r) =
1 0.5 +
mx = arg maxs∈gr AFtw (s) group as r .
where same
if
0.5 mx−k
× (k − AFtw (r))
[0.5, 0]
otherwise
(3.4)
is the maximum assertion frequency of the relations in the
This formulation gives a decay rate of 1 to the unusually low linearly in the interval
AFtw (r) < k
for the relations with
AF
AF
scores and a rate decreasing
scores above the threshold
k.
0.0
0.2
0.4
DR
0.6
0.8
1.0
Figure 3.1 exempli�es the behaviour of the proposed formulation.
k AF score
Figure 3.1: The proposed weight decay rate function.
In summary, the proposed relation weight updating strategy can be used to adapt the
CHAPTER 3.
ONTOLOGY-BASED INFORMATION RETRIEVAL
59
ontology dynamically by deleting relations which are deemed to be invalid. The proposed strategy consists simply starting from the base ontology, with the relation weights set to their default user-de�ned values, and then at the end of each new day updating the weights using Eq. 3.2. If the new weight is below a user-de�ned value the relation is deleted from the ontology, thus dynamically correcting errors.
3.3.3 Evaluation of General Ontology Adaptation Strategy The evaluation of the proposed error correction strategy was by manual evaluation against a baseline which was no error correction strategy. The evaluation set-up was the same as described on page 54. Two sets of ontologies were maintained over a 53 day period. One set of ontologies used the proposed correction strategy whereas the other set did not use any form of error correction. The ontologies used news up to the day they were created, i.e. an ontology generated on day 1 had access to one day of news whilst an ontology generated on day 53 had access to 53 days of news. The evaluation process chose 3 days at random, as well as the ontologies which were generated on days 1 and 53. The evaluation was limited to ontologies generated on 5 selected days because manual evaluation is an expensive process, and consequently it was necessary to limit the number of ontologies evaluated so that the evaluation could be achieved in a reasonable period of time. The selected days were days: 1, 4, 19, 35 and 53. The rules for the manual inspection were the same as described on page 54, i.e. 1. the entity with most relations was evaluated, 2. errors had to be positively identi�ed and 3. relations which were not positively validated as false were assumed to be correct. The number of errors and relations for the entity with most relations was recorded. The results for the number of errors evaluation is presented in Figure 3.2.
The number
of errors in the uncorrected ontology increases when the ontology construction process had access to an increasing number of news stories. For example, on day 1 the entity which has most relations had 18 erroneous relations, and on day 53 it has 63 erroneous relations. The ontologies which used the correction scheme did not have the same increase in the number of erroneous relations. On day 1 the ontology which used the correction scheme the entity which has most relations had 15 erroneous relations, and on day 53 it had 12 erroneous relations. There was a decrease in the number of errors as the ontology construction process had access to more news stories. It is possible that the decrease in erroneous relations could be accounted for by a general reduction in all relations. If this was the case then the error rate for both relations should be similar.
The error rates for both sets of ontologies is in Figure
3.3.
The error rate
demonstrates that the ontologies which had the correction strategy applied to them had a lower error rate than the ontologies which did not.
It is reasonable to assume that if the
error correcting strategy deleted correct relations then it deleted them at a lower rate then it deleted erroneous relations.
ONTOLOGY-BASED INFORMATION RETRIEVAL
60
Ontology with correction strategy. Ontology without correction strategy.
30 0
10
20
Error Count
40
50
60
CHAPTER 3.
1
4
19
35
53
Day
Figure 3.2: umber of errors for entity with most relations for: 1. ontologies with correction scheme and 2. ontologies without correction scheme.
The growth of the number of relations for the entity with the most relations is demonstrated in Figure 3.4. The ontologies which were not subject to the error correction strategy had more relations than the the ontologies which were subject to the error correction scheme. The di�erence may be explained by two factors: 1. higher number of errors and 2. higher number of unveri�ed relations. In summary the evaluation criteria underplayed the e�ectiveness of the proposed methodology because: 1. errors had to be �positively� identi�ed, 2. the "quality" of the relations was not considered. There was a larger number of �unveri�able relations� in the uncorrected ontology than the ontology which had been corrected by the proposed strategy.
The �unveri�able
relations� were not �obviously wrong�, however it was not clear if they were part of the domain. The �unveri�able relations� accounted for the signi�cant part of the di�erence in total relations between the uncorrected and corrected ontologies.
ONTOLOGY-BASED INFORMATION RETRIEVAL
61
5
10
Ontology with correction strategy. Ontology without correction strategy.
0
Errors As Percentage of Total Relations
15
CHAPTER 3.
1
4
19
35
53
Day
Figure 3.3: Error rate for entity with most relations.for: 1. ontologies with correction scheme and 2. ontologies without correction scheme.
The evaluation criteria did not consider the ability of the ontology which had been corrected to resolve ambiguous relations. For example at day 19 both Ontologies asserted that Microsoft and Adobe produced Acrobat Reader. In the ontology which had been corrected there was a measure of �con�dence� for both relations in a form of a �relation weight�. The �relation weight� for the assertion �Adobe produces Acrobat Reader� was higher than the weight for the assertion "Microsoft produces Acrobat Reader".
It was possible to identify the �true�
relation by accepting the relation with the highest weight. It was not possible to evaluate the �completeness� of the ontology as it was not feasible to generate a �Gold Standard� of all of the relations and entities in the domain, however the Modi�ed Ontology contained a number of stable relations which described the commonly known �facts� of the domain. The stable relations did not exit the ontology at the points the intermediate ontologies were manually evaluated. Although this was a limited empirical validation of the proposed strategy, the evidence provides a good indication of the e�ectiveness
ONTOLOGY-BASED INFORMATION RETRIEVAL
62
500
CHAPTER 3.
300 200 0
100
Total Number of Relations
400
Ontology with correction strategy. Ontology without correction strategy.
1
4
19
35
53
Day
Figure 3.4:
Number of relations for entity with most relations for:
1.
ontologies with
correction scheme and 2. ontologies without correction scheme.
of the proposed error control strategy.
3.4 News Retrieval using Ontologies The aim of the construction of both the company speci�c and the industry ontologies was to use the information contained in the ontologies to retrieve relevant news stories.
This
section will describe two alternative ways of retrieving these stories: one based on industry ontologies and the other using the company speci�c ontologies. We will describe methods for using the information contained on these ontologies to calculate a score for each candidate news story.
These scores will be used to select the relevant news stories.
Finally, we will
compare these two alternative proposals for news retrieval based on ontologies.
CHAPTER 3.
ONTOLOGY-BASED INFORMATION RETRIEVAL
63
3.4.1 News Retrieval using the Industry Ontology Given the information contained on the industry ontology it is proposed to calculate a relevance score for each news story.
This score will be obtained by counting how many
of the entities appearing on the story are relevant for the company we are interested in. In this context, it is �rst de�ned the set of entities in an industry ontology that are relevant for
C , which we will denote as EntC (O), where O is an industry ontology. This set is formed by: 1. entities which share the same industry sector as C , 2. entities which are encapsulating the industry sector of C and 3. the entity representing the company C . The set of entities that are mentioned in a news story d are denoted as ent(d) and the relevance a given company
score of the news story is de�ned as the cardinality of the intersection of these two sets of entities,
relIO (d, C) = | ent(d) ∩ EntC (O) | In summary, given the set of stories
Dt
appearing on day
t
(3.5)
our proposed retrieval method
consists of selecting the ones with a relevance score greater than zero, i.e.
{d ∈ Dt :
relIO (d, C) > 0}.
3.4.2 News Retrieval using Company Ontologies The second alternative method we are proposing will use the information of the company speci�c ontology to retrieve the news stories that are relevant for the company. Again, we are proposing to qualify the candidate news by a relevance score that will be used to select the ones we judge relevant for the company. However, given the di�erent nature of the company speci�c ontology, the way we obtain this score is di�erent. Given the set of entities appearing in a news story,
ent(d),
two aspects of these entities will be considered to calculate the news
story relevance score: 1. the importance of the entity within the company speci�c ontology and 2. the strength of the connection between each entity and the target company
C.
The
intuition is that we want to penalize both entities that are not very strongly connected to the company (though being a part of its ontology), and also entities that though su�ciently connected are not very relevant within the ontology. To calculate the importance of an entity within the ontology the notion of centrality from social networks has been used. Centrality measures calculate an
importance
of an entity by
calculating the number of relations it has with other entities[Liu, 2007d]. Given the temporal nature of the company speci�c ontology we have used the notion of assertion frequency to qualify each relation of an entity and thus obtaining the centrality score of an entity as described in Equation 3.6.
CHAPTER 3.
ONTOLOGY-BASED INFORMATION RETRIEVAL
X
ECt (e) =
64
AFtw (r)
(3.6)
r ∈ R(e) where
R(e)
is the set of relations in the ontology involving entity
e
and
AFtw (r)
is the
assertion frequency of a relation (c.f. Equation 3.3 on page 57). The strength of the connection between an entity
e
and the target company
C
is going to be
estimated by means of a Proximity Prestige (P P ) score. This score will be calculated as a function of the weights of the relations in the shortest path from
e to the company entity.
The
shortest path between these two entities was calculated with the Floyd's Algorithm [Floyd, 1962]. Note that this algorithm can return more than one path in case several paths have the shortest length. The Proximity Prestige (PP) of entity entity
eC
e
with respect to the company
is given by the following equation,
1 X Wt (r) p ∈ SP (e,eC ) |p| r ∈ p
P Pt (e, eC ) = arg max
where entity
p is a path formed by a e to eC and Wt (r) is the
set of relations,
SP (e, eC )
(3.7)
is the set of shortest paths from
relation weight (c.f. Equation 3.2 on page 56) at time
t.
Having described these two notions we can now de�ne the relevance score of a news story
d
using the information in a company speci�c ontology as,
relCO (d, C) =
X
P Pt (e, eC ) ×
e ∈ ent(d) where
O
centrality score of the set of entities in the
and
As with the previous relevance score we will retrieve the news stories from
relCO (d, C)
greater than zero, i.e.
(3.8)
arg maxs ∈ ent(O) ECt (s)
arg maxs ∈ ent(O) ECt (s) is the maximum ontology (ent(O)).
is the company speci�c ontology of
C,
ECt (e)
Dt
that have
{d ∈ Dt : relCO (d, C) > 0}.
3.4.3 Comparative Evaluation of Ontology Information Retrieval Strategies This subsection will describe an evaluation of a news retrieval system which uses either the: 1. Industry Ontology or 2. Company Speci�c Ontology which was corrected with the proposed adaptation scheme to score news stories. The strategies will be compared against two baselines: 1.
Lucene [Gospodnetic and McCandless, 2009] which uses the name of a
monitored company to retrieve news stories and 2. was not corrected.
a Company Speci�c Ontology which
Lucene is a document based inverted index, and in the experiments
each individual news story was assigned to a single document. Lucene ranks a news story
CHAPTER 3.
ONTOLOGY-BASED INFORMATION RETRIEVAL
(document) by applying a score to a document.
65
Lucene applies a score to a document in
response to a query. The technical documentation for Lucene is not clear, but it states that a document score is calculated with a combination of boolean logic and the Vector Space Model (VSM). The boolean part of the query excludes documents which do not contain any
3
of the query terms, and the VSM computes a document score for the document . The query issued in this experiment was the date of the required news experiment with a start and end date time, e.g 00.00.01 - 23.59.59, and the name of the target company, e.g.
�Microsoft�.
The document indexing and scoring were the default settings. The stories were ranked in descending order of document score. The Company Speci�c Ontology which was not corrected ranks news stories in the same manner as the corrected Company Speci�c Ontology. The evaluation was a manual evaluation against a set of general guidelines for the evaluator. It was not possible to supply prescriptive guidelines because a number of the judgements would be subjective and therefore left to the discretion of the evaluator. The ranking rules are described in Tables 3.8 and 3.9. Rank
Rule
1
Domain company name in text no other company preceding it.
2
Prominent domain company employee in text no other company or employee preceding it.
3
Domain company product in text no other company, product or employee preceding it.
4
Prominent domain company's competitor in text no other company, employee or product preceding it.
5
Prominent domain company competitor's employee story in text and no other company, employee or product preceding it.
6
Prominent domain company competitor's product story in text and no other company, employee or product preceding it.
7
Domain company general market area, i.e. if company makes phones then a general story about telecoms is acceptable.
Table 3.8: Ranking guidance for manual evaluator.
The evaluation used news stories published between the 1st September 2010 - 1st January 2011.
Earlier news stories were not used because they had been used in the construction
experiments for the Company Speci�c Ontology. The Industry Ontology was generated from news stories published between October 2008 - August 31st 2010. The Industry Ontology was designed to be static and therefore did not use news stories from the evaluation period in its construction.
3
More information about document scoring can be found at the Lucene website at: http://lucene.
apache.org/core/3_6_0/scoring.html
CHAPTER 3.
ONTOLOGY-BASED INFORMATION RETRIEVAL
66
Rule
Reason
Macro Economic News
This news applies to all companies and should not have a high rank.
News which refers to markets which
This news is unrelated to domain
the company does not operate in. News which has preceding mentions of
In general stories which mention large
unrelated companies, products before any
amounts of companies are typically stock
relevant
recommendation stories and have no rele-
terms
(described
in
Ranking
Rules Table)
vance to the domain. Table 3.9: Exclusion guidance for manual evaluator.
The Company Speci�c Ontology was generated on a daily basis. It used news stories from the beginning of the evaluation period to the previous day an ontology was generated, i.e. an ontology which was generated for 2nd September 2010 would have access only to news stories published on 1st September 2010 whereas an ontology generated for 30th September would have access to news stories published between 1st September 2010 - 29th September 2010. This process ensured that there was no company speci�c ontology for September 1st 2010 and consequently September 1st was excluded from the evaluation process because at least two of the strategies would not be able to score news stories for that day. The experiments were conducted in January 2011. target company because:
1.
The evaluation used Microsoft as the
there are a signi�cant number of news stories published for
Microsoft and 2. the domain is well known. In the evaluation each strategy would score all news stories available in the news story corpus on daily basis. News stories which scored 0 were excluded. The remaining news stories were ranked in descending order of their assigned score on daily basis. The evaluation therefore had for each day in the evaluation period: 1. list of all news stories published and 2. four individual ranked lists (one for each competing strategy) of news stories sorted in descending order of news story scores. The evaluation followed a suggested test by Manning and Schütze [1999] which appraised the accuracies of each system at 1-5, 1-10 and 1-20 document ranges.
A document range
in this case is a set of documents with a speci�c rank, i.e. an evaluation range 1-5 would evaluate news stories which had been assigned a rank between 1 and 5 by a speci�c strategy. A random selection range of 5 news stories with a rank greater than 20 was selected for evaluation.
The rational to this evaluation was to ensure that there was an evaluation
measure for news stories with a rank greater than 20. In addition a count of the number of stories each strategy selected was recorded. Manuel evaluation was a labour intensive process and consequently it was not possible to evaluate all of the days in the evaluation period. A large random sample was taken. The
CHAPTER 3.
ONTOLOGY-BASED INFORMATION RETRIEVAL
random sample encompassed 25 days of news stories.
67
The results were an average of the
individual evaluations for each of the 25 days. The results are documented in Tables 3.10 and
3.11. The accuracy �gures are expressed as a percentage and the documents returned
�gure is a raw count.
Strategy
Accuracy(1-5
Accuracy(1-10
Accuracy(1-20
Accuracy
Ran-
Documents)
Documents)
Documents)
dom Selection
Industry
80%±5
90%±8
90%±7
55%±29
Company Speci�c
100%±0
93%±5
90%±5
73%±31
Lucene
70%±16
80%±0
N/A
N/A
Uncorrected
80%±16
73%±22
63%±18
20%±28
Company Speci�c
Table 3.10: Evaluation results for ontology recall strategies.
Strategy Industry
Documents Returned 72
±45
Company Speci�c
65±60
Lucene
12±10
Uncorrected Company Speci�c
173±113
Table 3.11: Average number of documents returned.
The results demonstrate that the proposed correction strategy on the Company Speci�c Ontology had a direct impact on the quality of the results. The accuracy of the Company Speci�c Ontology when used to rank news stories was higher when the correction strategy was applied than when it wasn't. An uncorrected Company Speci�c Ontology when used to rank news returned many news stories, but was inaccurate. The Company Speci�c Ontology based news story recall strategy arguably outperformed the Industry Ontology news story recall strategy because it made less �serious� mistakes. The Industry Ontology news story recall strategy often made mistakes with stories ranked with a position of 5 or higher. In addition, the Company Speci�c Ontology based news story recall strategy accuracy declined slower with the random selection of news stories than the Industry Ontology strategy. The Lucene baseline was less accurate than the competing strategies at rank 1-5 and had a higher accuracy than the uncorrected Company Speci�c Ontology news recall strategy at rank:
1-10.
Lucene did not return enough news stories for either:
random selection and the 1-20 document selection evaluation to be attempted.
the
Company
Speci�c Ontology news recall strategy was unique because it had a high accuracy measure and a relatively high average number of returned documents.
CHAPTER 3.
ONTOLOGY-BASED INFORMATION RETRIEVAL
68
3.5 Summary This chapter presented strategies for identifying related news to a target company.
The
strategies relied upon ontologies to represent relationships between target companies and other entities such as industry sectors or products. The strategies necessitated advances in two areas: 1. ontology construction and maintenance, and 2. news retrieval with ontologies.
3.5.1 Ontology construction and maintenance There were two separate ontology construction strategies presented in this chapter. The �rst strategy (industry ontology) used patterns to identify industry sectors. Industry sectors are entities which represent groups of companies. to build the ontology.
The construction process used news stories
The news stories were divided into sentences and the meta-entities
and companies were located in each sentence. The identi�ed companies were assigned to a meta entity by their co-occurrence in the same sentence as a speci�c meta-entity. The �nal industry ontology contained industry sectors and their company members. A company could be a member of 1 or more industry sector if they conduced business in more than one area. The second strategy (company ontology) attempted to represent the
domain
of a company.
The domain of a company can include a larger variety of entities than the industry ontology because the proposed strategy attempted to provide more detail than the industry ontology. The company ontology was constructed from the Open Calais meta data which was added to each news story as well from external resources the Open Calais meta data provided links to. The construction methodology used a recursive strategy to initially build an ontology from
directly relevant
news stories which contained the target company's name in the headline.
The ontology was used to select related stories which did not contain the company's name in the headline to enrich to the ontology. The increased detail presented problems because these details changed overtime, for example employees changing employer or companies launching new products. The ontology had to be adapted over time to match the changes in the company's domain. There was no gold standard against which to evaluate the ontology, consequently a decay system based upon characteristic's of news where facts are repeated over time was developed. This decay scheme assigned an initial �weight� to a relation of an entity. The weight was reduced until a prede�ned value where it was removed. An entity with no relations was deleted. The relation weight was reinitialized if the relation was reasserted in a news story. In addition a relation weight's decay was in�uenced by the �domain volatility�. A domain where there was frequent publication of news stories would increase a relation's decay rate, but a domain where news stories were published infrequently reduced a relation's decay rate. The ontology construction methods were advances to the �eld of ontology engineering because
CHAPTER 3.
ONTOLOGY-BASED INFORMATION RETRIEVAL
69
there was no similar work published at the time the work was constructed. The concept of building time dependent ontologies from volatile resources such as news stories also seems to be an original concept. Time dependent ontologies and their management are not new concepts because there are many published approaches, but these approaches rely upon either manual management or a
ground truth against which to evaluate an ontology at a given point
in time. There was a lack of published work where there was no ground truth or resources to do active management. The decay scheme seems to be an unique contribution to the �eld of ontology engineering.
3.5.2 News retrieval with ontologies The notion of using ontologies to select news is not a new concept, but the manner in which the ontologies were used to select news is a contribution to the research literature. The notion of using industry sectors and their members to recommend news was not identi�ed during the research literature search. This approach allowed the identi�cation of news which was directly relevant to a target company. The concept of using social network measures in an ontology to rank and score news stories is a novel contribution. The use of social network measures allows the use of the structure of the ontology to rank the entities contained within it. score a news story.
These entities are then used to
This approach di�ers to to traditional information retrieval strategies
which use ontologies to expand queries, but rely upon a separate indexing engine to rank the documents. The addition of a ontology correction strategy may change the structure of the ontology and therefore the information retrieval may alter over time, i.e. a series of stories scored and ranked by ontology created on day evaluated by a separate ontology on day
x
may have a di�erent rank or score when
y.
In summary, this chapter has presented two novel strategies for ontology construction and maintenance, and ontology based news recall. The strategies allowed for an accurate identi�cation of related news to a target company which outperformed two competing strategies.
Chapter 4
Text Analysis The hypothesis of this thesis is news can contain information which is not re�ected in the price of a share or market index at the time of the news story's publication [Mitra and Mitra, 2011a]. This information can allow a trade to be made where the risk is disproportionately lower than the potential returns. This type of information is known as �alpha�. News can be a common source of �alpha� because it contains timely information [Mitra and Mitra, 2011a] which describes either: the immediate future or present whereas numerical data is typically concerned with the past [Kloptchenko, Eklund, Back, and Karlsson, 2004]. The previous chapter described strategies for collecting relevant news stories for speci�c companies. This chapter will describe strategies for analysing the news story text returned by an information retrieval strategy. The analysis strategies calculate a value for the text which re�ects the information it contains. The aggregated value of all the stories analysed on a speci�c day is passed onto a stock trading system. This chapter presents two types of text analysis strategies: sentence level and document level. Sentence level strategies classify information at the sentence level, and therefore preserve linguistic information between words in the same sentence. The sentence level strategy and its application to classifying a day's worth of news can be summarized as the following:
•
Split news stories published on a single day into sentences.
•
Score each sentence.
•
Aggregate the score of all sentences into a single value.
The document level strategies classify individual news stories. each news story as a �bag of words�.
The strategies represent
A bag of words representation does not preserve
linguistic relationships between words. The document level strategies and their application to classifying a day's worth of news can be summarized as the following:
70
CHAPTER 4.
TEXT ANALYSIS
71
•
Represent each news story as a bag of words.
•
Classify news story into one of three categories: neutral, positive or negative.
•
Replace the categories with a value, for example 1 for positive and -1 for negative.
•
Aggregate the values of the news classi�ed on a single day.
The development of each of the strategies had three restrictions: 1. there was no resource to label a large amount of documents, 2. there was no resource available with speci�c knowledge about �nancial markets and 3. there was no readily available set of labelled documents. The implication of the restrictions was that a signi�cant amount of time was devoted to labelling data for each strategy. The labelling strategies relied upon: 1. insights about the �nancial news domain, 2. insights about �nancial markets or 3. general linguistic characteristics of the problem domain.
The lack of labelled data impacted the validation of the techniques
which had to rely upon small hand labelled sets of data. The evaluation presented in this chapter is an initial evaluation which provides some justi�cation for the proposed strategies. The strategies will be subjected to a comprehensive trading evaluation which is described in Chapter 6.
4.1 Sentence Level Strategies The sentence level strategies were designed to detect two speci�c types of information in a sentence: event or sentiment information. The justi�cation for this approach is found in the economic literature review on page 12. The economic literature review discovered previous work that suggested that �nancial markets reacted to event or sentiment information in news text, and therefore a text analysis strategy which identi�es this information in news stories could be successful in predicting the direction of a �nancial market. level strategies are rule based.
The sentence
A rule based strategy was selected because of the lack of
labelled data which would be required for a machine learning based approach. The rule based approach relies upon intuitions about the problem domain as well as linguistic knowledge of the language used in news stories. The sentence level strategies had two steps: 1. phrase annotation (labelling) at the sentence level and 2.
phrase scoring.
The phrase annotation was achieved with rules written in
Java Annotation Patterns Engine (JAPE) format for the GATE platform. The annotated phrases are extracted and scored by a separate process which had di�erent methods for scoring event or sentiment phrases. An event phrase is scored by estimating the relationship between the verb and the object. The sentiment phrases are scored by using a modi�ed AVAC algorithm [Subrahmanian and Reforgiato, 2008]. A sentence is scored by combining the scores of the annotated: 1. sentiment phrases, 2. event phrases or 3. event and sentiment phrases
CHAPTER 4.
TEXT ANALYSIS
72
it contains. The combination approach was selected upon due to an intuition about the text. The intuition suggested that sentences which contained more than one event or sentiment phrases could be broken down into smaller sentences due to the presence of conjunctions or semi-colons. For example, the hypothetical sentence, �Shares in BAE Systems, Europe's biggest defence contractor, have fallen 33 per cent over the past 12 months, although they still have outperformed the FTSE All-Share index by 5 per cent.�, contains two events, which are joined by the conjunction �although�. It is arguable that this sentence could be split into two sentences and therefore a strategy which did not combine the phrase scores of larger sentences would reward shorter sentences at the expense of longer sentences. In the complete system a summing strategy was used to combine all the sentence scores to produce a daily score, but in this chapter a document equivalence was calculated by summing all the sentences in a given news story and dividing it by the total number of sentences in the story.
This document
equivalence score was used to compare the sentence and document level strategies against a manually labelled set of stories. The annotation step annotates phrases using extraction patterns: 1.
for event phrases and 2. for sentiment phrases. In both patterns, the subject was either: an economic actor or a property of an economic actor.
The verb in the event pattern was a business event verb and the adjective in the
sentiment pattern was a sentiment adjective. The annotation step relies upon the resources available in GATE, for example sentence splitting, part of speech (POS) tagging and named entity extraction. The resources in GATE were not su�cient, and a number of additional resources were required. The next subsection will describe the resources construction step.
4.1.1 Lexical Resource Construction The lexical resource construction was predicated on the following de�nitions:
•
Named Entity: a proper noun which is assigned to a pre-de�ned class.
•
Economic Actor : classes:
1.
a named entity which is assigned to one of the following pre-de�ned
Company, 2.
Public Organization (government, central bank, etc.), 3.
Business Leader (CEO, Managing Directory,etc.), 4. Market Index (NASDAQ, FTSE, etc.) and 5. Industry Sectors
•
Property of Economic Actor :
a noun which has an a�liation with an economic actor,
for example pro�ts, costs, etc.
•
Business Event Verbs :
a verb which connects a property of an economic actor to an
economic actor.
•
Sentiment Adjective : an economic actor.
an adjective which connects a property of an economic actor to
CHAPTER 4.
TEXT ANALYSIS
•
Negators :
•
Sentiment Modi�ers :
73
an adverb which inverts the sentiment orientation of an adjective.
an adverb which either: intensi�es or minimizes the sentiment
orientation of an adjective.
In addition the lexical resource construction relied upon the notion of Pointwise Mutual Information (PMI). PMI is an association measure which was introduced into linguistics by [Church and Hanks, 1990]. In the lexical resource construction PMI is used to determine the association between words. There are two types of lexical resources constructed for the sentence level strategy:
1.
resources for the GATE platform and 2. resources for a scoring process which is external to GATE. The resources for GATE platform are either: 1. lists with an entry and a class name or 2. a Jape Rule which is a form of regular expression for named entities. The resources for the external scoring process are lists which contain an entry and a numerical value. The resources which were constructed for the GATE platform were the following: 1. economic actor named entity lists, 2. list of business event verbs, 3. list of sentiment adjectives, 4. list of adverbs and 5. list of property of an economic actor. The resources which were constructed for the external scoring process were: 1.
list of business event verbs and their associated
scores, 2. list of sentiment adjectives and their associated scores, 3. list of property of an economic actor and their associated score. 4. list of adverbs and their associated scores. GATE contains a named entity recognizer which is a series of lists with an entry and a class name, for example, the entry Microsoft has a class name �company�.
The lists which are
used in a named entity recognition process is controlled by a single �le which is a central named entity list register.
The named entity lists supplied with GATE did not contain a
su�cient number of economic actors (companies, organizations, etc.). Additional economic actor named entities were extracted from the Open Calais meta-data in a process described on page 47. The lists of: 1. business event verbs, 2. sentiment adjectives and 3. adverbs for the GATE platform were constructed from news stories which were harvested between October 2008 and September 2010. The �rst two construction phases for each of the lexical resources for GATE are identical: split news stories into sentences, add POS and named entity information to a sentence. At this stage there is a list of sentences whose words have a POS tag (Noun, Verb, Adverb, Adjective, etc.)
attached, and a named entity tag.
The description of the
construction method for each lexical resource will assume that these common steps have been completed, and therefore are not required to be stated explicitly. The event extraction pattern relied upon the discovery of a group of verbs known as business event verbs.
Business event verbs were a hypothesized subset of event verbs[Levin, 1993]
which describe actions of an economic actor (EA). The discovery method of these verbs
CHAPTER 4.
TEXT ANALYSIS
74
assumed that these types of verbs would co-occur in the same sentence as an EA and therefore identifying verbs which have a �strong connection� with a class of economic actor would be a good indication of a business event verb.
The discovery process can be summarized as
the following: 1. extract verbs which co-occur in the same sentence as an EA, 2. calculate Pointwise Mutual Information score for verbs and their co-occurrence with EA categories, 3. delete verbs with PMI score of 0 or less, 4. expand verbs with synonyms from WordNet and 5. expand verbs with members of verb's Levin class from VerbNet. The list of sentences created by the common steps were �ltered for sentences which did not contain: 1. an EA or 2. a verb. The remaining sentences contained at least one verb and EA. This group of sentences will be known as the �business event group of sentences�. Each sentence in `business event group of sentences� was labelled with the category of the EA it contained, for example a sentence which contained the named entity �Microsoft� would be labelled as �company�.
A sentence which contained more than one class of named entity
would have multiple labels. The verbs were extracted from these labelled sentences. This set of verbs will be known as the �base set�. The a�nity of a verb contained in the base set with a class of named entity was calculated with a Pointwise Mutual Information score (PMI). The PMI score of verb is described in the following equation,
P M I(Category, V erb) = log2 where
Category
(4.1)
represents a label of a sentence in which an EA and verb co-occur,
represents a probability and The
P r(Category, V erb) P r(Category)P r(V erb)
P r(Category, V erb)
V erb
Pr
represents an entry from the base set.
is the probability of a verb co-occurring with a speci�c category
label. This probability is calculated by the following equation,
P r(Category, V erb) = where
N u(Category, V erb)
N u(Category, V erb) N u(V erb)
(4.2)
is the frequency a verb appears in a sentence from the �business
event group of sentences� which has been assigned a speci�c category and
N u(V erb)
is the
frequency of the verb in all sentences in the news story corpus. All frequencies in the previous and forthcoming equations were calculated from a set of news which was crawled from 1st October 2008 - 30th September 2010. The probability of a verb is determined by the following,
P r(V erb) = where
N u(V erb) N u(AllV erbs)
(4.3)
N u(V erb) is the frequency of a speci�c verb in the whole news corpus and N u(AllV erbs)
is the frequency of all verbs in the whole news corpus.
CHAPTER 4.
TEXT ANALYSIS
The frequency of
75
AllV erbs is a count of words which comply to the requirements of one of the
following POS tags: VB, VBD, VBG, VBN, VBP and VBZ. For example, if there were two verbs in the whole news story corpus, each occurring once each then
N u(AllV erbs)
would
equal two. The probability of a sentence category is determined by the following,
P r(Category) =
N u(Category) N u(Sentences)
N u(Category) is a count of the sentences which have been labelled category and N u(Sentences) is a count of the total number of sentences in where
(4.4) with a speci�c the news story
corpus. Verbs which had a PMI score above 0 were assumed to have an a�liation with a category (class name) of EA. The list of verbs were relatively small, and consequently they were expanded. The expansion process used two linguistic resources: VerbNet [Karin Kipper and Palmer, 2006] and WordNet [Fellbaum, 1998]. VerbNet is a dictionary which groups verbs into Levin classes [Levin, 1993].
A Levin class is a group of verbs which share common
characteristics which were determined by linguistic analysis by Beth Levin. For example, the
bounce could be expanded with members of the Roll Class which were: drift, drop, �oat, glide, move, roll, slide, swing. The base set of verbs and their Levin Class members were
verb
expanded with synonyms from WordNet.
This �nal list of expanded verbs were manually
veri�ed to ensure that there were no obvious errors. An example of the �business event verbs� can be found in Table 4.1 where an arti�cial verb category has been added for clari�cation purposes. The expanded verb lists were added as separate resources to GATE named entity recognizer.
Verb Category Obtained Lost Direction Behaviour In�uence
Examples gain, add, forge, win, attract �re, cut, cancel climb, fall, boost, down storm, unravel hurt,hit push, su�er
Table 4.1: A Sample of business event verbs. The identi�cation of adjectives for use in the sentiment extraction patterns were discovered in a similar manner to the event verbs. A list of adjectives was created by extracting adjectives from sentences which contained an EA and adjective. A PMI score was calculated for each extracted adjective with an EA class.
Adjectives which had a PMI greater than 0 with a
speci�c class of EA were assumed to have an a�liation with that type of EA. At this point the adjective discovery process diverges from the verb discovery process. The extracted adjectives were to be increased in number (expanded) because the initial extracted
CHAPTER 4.
TEXT ANALYSIS
76
adjectives were relatively few in number. The expansion process uses �adjective values� and conjunctions. Adjectives can be assigned a value which indicates the sentiment orientation of an adjective, for example a value of 1 may indicate a positive orientation whereas -1 may indicate a negative orientation. This value will be used in a linguistic resource external to GATE to score the extracted phrases, however this value can assist in an expansion of the initially selected adjectives. Hatzivassiloglou and McKeown [1997] claimed that conjunctions such as �and� and �or� can join together adjectives of similar orientation.
They claimed
it was possible to propagate a label or value from an adjective with a known orientation to an adjective with an unknown orientation. This property of sentiment adjectives allows the expansion of sentiment adjectives for the GATE linguistic resource as well scoring the adjectives for use in a linguistic resource external to GATE which will be used to score extracted sentiment phrases. The �rst step in the expansion process was to score each of the adjectives extracted in the initial process.
A value for each adjective was gathered from Sentiwordnet [Esuli and
Sebastiani, 2006] which is a pre-compiled sentiment dictionary.
Sentiwordnet contains an
entry (a unigram) with an associated value. The list of adjectives were manually veri�ed for errors in the assigned values. from WordNet.
The next step was to expand the adjectives with synonyms
The synonyms were assigned the same value as the original adjective as
input to WordNet. The set of adjectives which were used in the expansion process contained an entry and a value. The sentiment propagation algorithm used in the expansion process was a modi�ed version of the algorithm proposed by Hatzivassiloglou and McKeown [1997], and used conjunctions to identify and predict new sentiment words and their orientation. Candidate words were identi�ed by their �connection� by a conjunction (�and� or �or�) to a word of known sentiment orientation.
The following sequence was extracted in the
experiments for this chapter: 1. good and cost-e�cient, 2. cost-e�cient and fair, 3. fair and transparent. The word �good� was in the original adjective list and therefore had a known sentiment orientation. It's value was propagated from �good� to cost-e�ective and then to �fair� and �nally to �transparent�. Each iteration of the algorithm produced new adjectives which were not in the input list of words.
The new words were expanded with semantic
equivalents from WordNet. A new input list which consisted of the newly expanded words was created and used as a seed list for the new iteration of the algorithm. This process was continued until no more new words were produced. The adjectives were manually veri�ed at the end of the process. The process produced two types of resources: 1. a list of adjectives with a class name, which was a resource for the GATE Platform and 2. a list of adjectives with a value, which was a resource for an external scoring process. The next lexical resource constructed for the GATE platform was a set of sentiment modi�ers and negators. Sentiment modi�ers are typically adverbs which either increase or reduce the sentiment strength of an adjective, whereas a negator inverts the sentiment of an adjective [Benamara, Cesarano, Picariello, Reforgiato, and Subrahmanian, 2007].
An example
CHAPTER 4.
TEXT ANALYSIS
77
of a sentiment modi�er is the adverb �very� which increases the sentiment strength of an adjective, i.e. the bigram �very good� has an arguably stronger sentiment strength than the unigram �good�. An example of a negator is the adverb �not� which inverts the sentiment direction of an adjective, i.e. �not good� has the opposite sentiment direction of �good�. The discovery of adverbs used the steps in the adjective discovery process which produced a list of sentences which contained an adjective and an economic actor named entity. These sentences were required because it was necessary to locate adverbs which had an identi�able in�uence upon an adjective. This process is discussed on page 75. This group of sentences will be known as �adjective group of sentences�. The next step is to calculate a PointWise Mutual Information (PMI) score for adverbs and their co-occurrence with a sentiment adjective. The PMI calculation is described in the following equation,
P M I(sa, ad) = log2 where
sa
which represents all the adjectives,
ad
P r(sa, ad) P r(sa)P r(ad)
is an individual adverb and
(4.5)
Pr
represents a
probability. The probability of an adverb and sentiment adjective (P r(sa, ad)) is calculated by the following equation:
P r(sa, ad) =
N u(sa, ad) N u(ad)
(4.6)
N u(sa, ad) is the frequency an individual adjective appear co-occurs with a sentiment adjective in the same sentence. N u(ad) is the frequency of the adverb in the whole news where
corpus. The probability of an individual adverb was calculated as per the following equation,
P r(ad) = where
N u(ad) N u(AllAdverbs)
(4.7)
N u(ad) is the frequency of an individual adverb, and N u(AllAdverbs) is the frequency
of all adverbs in the news story corpus. The frequency of all adverbs refers to the words which meets the criteria of the following tags:RN and WRB. For example, if there was two adverbs in the whole corpus each appearing the corpus once then
N u(AllAdverbs)
would be two.
The probability of an individual adjective was calculated by the following equation,
P r(sa) =
N u(sa) N u(AllAdjectives)
(4.8)
CHAPTER 4.
where
TEXT ANALYSIS
N u(sa)
78
is the frequency of an individual adjective, and
N u(AllAdjectives)
is the
frequency of all adjectives in the news story corpus. The frequency of all adjectives is a count of all of the adjectives in the news corpus. For example, if there were two adjectives in the news corpus, each occurring once then
N u(AllAdjectives)
is equal to two. Adverbs which scored a PMI of 0 or less were removed. An example of the adverbs discovered are in Table 4.2. This process produced a list of adverbs which contained: an adverb and a class name.
These lists were added to GATE. An example of the discovered adverbs is
described in Table 4.2 with a manually added categorization label. The manual categorization relied upon a native speaker's understanding of adverbs and their sentiment modi�cation
1
properties . Sentiment modi�er categorization
Examples
Maximization
sharply, super, perfectly
Minimization
rickety, pi�ing, just
Negation
not, none, never
Table 4.2: Selection of sample of sentiment modi�cation adverbs.
The last lexical resource produced was the �property of economic actor� (PEA) list. A PEA is a noun, which has a relationship with an economic actor (EA) which is described by either an event verb or adjective. For example: Microsoft's pro�ts fell, the verb �fell� describes the relationship of the noun �pro�ts� to the company �Microsoft�. At this stage the previously mentioned lexical resources (event verbs, sentiment adjectives and adverbs) developed for GATE have been added, and available to use in the PEA construction process, therefore the PEA is dependent upon the previous construction steps. The �rst step of the PEA construction process was to execute the common stages described on page 73.
In addition to the identi�cation of named entities and lexical information,
event verbs, sentiment adjectives and adverbs were annotated in the sentences returned by the common stages. The next step was to identify sentences which contained nouns which were not proper nouns, and contained one of the following: 1.
business event verb or 2.
sentiment adjective. Proper nouns were excluded because they are typically named entities, and therefore could not be a property of another named entity. sentences were extracted.
The nouns from these
The next step was to identify an a�nity between an extracted
noun and: 1. sentiment adjective or 2. business event verb. The method of detecting this a�nity was to calculate a Pointwise Mutual Information (PMI) score for each noun and all
1
A discussion of sentiment negators and sentiment modi�ers can be found at [Hogenboom, van Iterson, Heerschop, Frasincar, and Kaymak, 2011] and [Benamara, Cesarano, Picariello, Reforgiato, and Subrahmanian, 2007]
CHAPTER 4.
TEXT ANALYSIS
79
of the business event verbs and sentiment adjectives.
The PMI score is described in the
following equation,
P M I(n, sabv) = log2 where
n
sabv
P r(n, sabv) P r(n)P r(sabv)
represents all business event verbs or sentiment adjectives,
(4.9)
Pr
a probability and
an extracted noun.
The
P r(n, sabv)
was calculated with the following equation,
P r(n, sabv) = where
N u(n, sabv)
N u(n, sabv) N u(n)
(4.10)
is the frequency of a noun co-occurring with a sentiment adjective or
business event verb in the same sentence and
N u(n)
is the frequency of the noun in the
whole news corpus. The probability of
n is calculated by computing the frequency of the noun in the whole corpus
and diving the number by the total number of nouns in the whole corpus. This calculation is represented in the following equation,
P r(n) = where
N u(n)
N u(n) N u(AllN ouns)
is a frequency of a noun, and
The probability of the
sabv
N u(AllN ouns)
(4.11) of all nouns in the corpus.
was calculated by computing the frequency of all sentiment
adjectives and business event verbs and dividing the result by the total frequency of all the business event verbs and sentiment adjectives in the corpus. The calculation is represented by the following equation,
P r(sabv) = where
N u(sabv) N u(AllSABV )
(4.12)
N u(sabv) is the frequency of the event verb or sentiment adjective, and N u(AllSABV )
is the frequency of all the business event verbs and sentiment adjectives. The nouns which had gained a score of 0 or less were removed. The remaining nouns were assumed to be properties of named entities, and were added to GATE as a list with the class name �PEA�. An example of the extracted nouns can be found in Table 4.3. The small sample has been hand classi�ed under an arti�cial noun category for clari�cation purposes. At this stage all the GATE lexical resources which contained an entry and a class name, had been created. The remaining steps were to create separate resources for an external scoring process. These new resources were created from the GATE resources, and contained an entry and a value rather than an entry and a class name which were present in the original GATE resources.
CHAPTER 4.
TEXT ANALYSIS
Noun Categorization Success Measures
80
Examples footfall, sales, pro�ts, demand
Time Periods
Monday, Tuesday, January, month, year, period
Third Parties
investors, analysts, investors, economists, regulators, consumers
Miscellaneous
transactions, �nance, bankruptcy
Table 4.3: Sample selection of Properties of Economic Actors (PEA).
Lexical Resources for Scoring Process The lexical resources for the scoring process were a subset of the ones developed for GATE. The unique di�erence was that the class label was replaced with a value, therefore the scoring process resources had an entry and a value. The resources to be scored were: business event verbs, PEA and adverbs. Each of the scoring processes was conducted manually and relied upon the intuition of a native speaker. It is accepted that the scoring process could be seen as �ad-hoc�, however there was no authoritative alternate scoring processes. The sentiment adjectives have been already scored in a process described on page 75. The scores of the business event verbs and sentiment adjectives indicated the polarity of a verb or adjective, i.e. a positive score indicates a positive polarity for a verb or adjective, and a negative score indicates a negative polarity. The scores for adverbs indicate their in�uencing role on an adjective, i.e. an adverb with a score of less than 1 reduces the score of an adjective where as a score of greater than 1 increases the positive score and reduces the negative score of an adjective. An adverb which has a score -1 inverts the score of an adjective. The score of a PEA indicates the relationship between a business event verb and a PEA. A score of 1 indicates that the PEA has a �typical� relationship with a business event verb and does not alter the value assigned to a verb, and -1 indicates that the PEA has a �atypical� relationship with a business event verb which alters the value of a business event verb. The �rst step is to score the business event verbs.
The verb scoring process used one
annotator who estimated the relationship of an individual business event verb with the majority of the PEA nouns. A verb which in the opinion of the annotator had a �positive� relationship with the majority of the PEA nouns was assigned a score of 1 whereas a verb with a �negative� relationship with the majority of PEA nouns was assigned a score of -1. A positive relationship for a verb indicates that the verb forms part of a �positive phrase� with the majority of PEAs.
For example, the �positive� phrase, �Microsoft pro�ts rose in
2011�, �rose� and �pro�ts� are the verb and PEA respectively, consequently the verb �rose� would be assigned a score of 1. A negative relationship for a verb indicates that the verb forms part of a �negative phrase� with the majority of PEAs.
For example, the �negative
CHAPTER 4.
TEXT ANALYSIS
81
phrase�, �Microsoft pro�ts dropped in 2011�,�dropped� and �pro�ts� are the verb and PEA respectively, consequently the verb �dropped� would be assigned the score -1. A sample of the values of assigned business event verbs' values are in Table 4.4 with an arti�cial verb category. Verb Category Obtained
Examples gain(1), add(1), forge(1), win(1), attract(1)
Lost
�re(-1), cut(-1), cancel(-1)
Direction
climb(1), fall(-1), boost(1), down(-1)
Behaviour
storm(1), unravel(-1)
In�uence
hurt(-1),hit(-1), push(1), su�er(-1)
Table 4.4: Sample Verb Values.
The next step was to score the �Property of Economic Actor (PEA)� nouns. process was predicated upon two concepts: relationship�.
1.
The scoring
�typical relationship� and 2.
�atypical
A typical relationship is in the opinion of the annotator the PEA does not
e�ect the scores of the business event verbs.
For example, the phase, �Microsoft pro�ts
rose in 2011�, the PEA �pro�ts� does not alter the score (1) of the verb �rose�. An atypical relationship of a PEA is in the opinion of the annotator the PEA does e�ect the scores of the business event verbs. For example, the phase, �Microsoft costs rose in 2011�, the PEA �costs� does alter the score (1) of the verb �rose� to a negative score because �rising costs� are normally seen to be negative. The scoring process for the PEA nouns was a manual process. It is accepted that this may be an �ad-hoc� process, but it was only undertaken because of the lack of an authoritative alternate process. A PEA noun was assigned a score by a single annotator. A PEA was assigned 1 if it had a majority positive relationship with the business event verbs otherwise it was assigned a score of -1. The -1 score was designed to �invert� the score of the event verb, for example the PEA noun �costs� was assigned a score of -1, and in the hypothetical phrase �Premier Foods cut costs� would invert the score of the business verb �cut�. A sample of PEA nouns and their relationships with business event verbs can be found in Table 4.5. PEA Category
Examples
Typical
pro�ts, footfall, sales, demand
Atypical
costs, debt, unemployment, arrears
Table 4.5: A sample of Properties of Economic Actors and their relationship with business event verbs
The �nal step was to score the adverbs. The annotator assigned a score which re�ected the role of an adverb with a sentiment adjective.
The range was arbitrary, but re�ected the
CHAPTER 4.
TEXT ANALYSIS
82
annotator intuition about the adverbs. A sentiment maximizer (adverb) seeks to increase the pre-assigned value of an adjective, and consequently it was scored on the scale
1.1 Induce model for headlines from labelled data **;
hc ← T rainW ithHeadlines(LD); ** DC -> Induce model for description from labelled data **;
dc ← T rainW ithDescriptions(LD); ** DC -> Induce model for news story text from labelled data **;
sc ← T rainW ithStoryT ext(LD); ul ← (); counter ← 0; forall the story ∈ U L do ** Classify news story with each model **;
ruleC ← rc.classif y(story.headline); headC ← hc.classif y(story.headline); descC ← dc.classif y(story.description); textC ← sc.classif y(story.text); ** Check classi�cation con�dence **;
if
headC.conf < Const next;
or descC.conf < Const or textC.conf < Const then
** Check classi�cation agreement **;
if
ruleC = headC ∧ headC = descC ∧ descC = textC LD ← LD.add(story, ruleC); counter ← counter + 1;
then
else ul ← ul.add(story); ** Termination, no further candidates **;
if
counter = 0 then return LD ;
** Recursive call to Self-Train Function **; return
(Self T rain(LD, ul, const));
PM π = PM
i=1 T Pi
i=1 (T Pi
+ F Pi )
(4.19)
CHAPTER 4.
where
FP
TEXT ANALYSIS
93
is a false positive.
The evaluation process had a hand labelled set of 935 documents (evaluation set) which were labelled into three categories: neutral, positive and negative. The competing strategies did not have access to this data in the labelling or training phase. In addition, there were 421984 unlabelled news stories from which the labelling strategies would label a selection as training data for a Naive Bayes learner which would be used to classify the small hand labelled set of documents. The rule, combined and self training strategies had a number of common variations which was not shared by the market alignment strategy. The rule strategy had three variations: 1. label news stories with event rules only, 2. label news stories with sentiment rules only and 3. label news stories with both event and sentiment rules. The combined labelling strategy used the rule variations and market �uctuations to label news stories, consequently there were three sets of labelled data produced by this strategy one for each of the following combinations: 1. event rules and market �uctuations, 2. sentiment and market �uctuations and 3. event and sentiment rules with market �uctuations. The self-training variations used the combined strategy variations to label the initial training data.
The self-training algorithm used: 1.
event, 2. sentiment, and 3. event and sentiment rules as the rule classi�er. The labelling strategies which relied upon market alignment used the FTSE to assist the labelling process.
The FTSE is a British �nancial index and was chosen because at the
time the experiments were conducted the news corpus mainly contained stories from the UK media. The labelling strategies which used market alignment used a number of thresholds which ranged: 1. 0.5% to 2.0% of the FTSE market value for positive news stories and 2. -0.5% to -2.0% of market value for negative news stories. These limits were dictated by the trading evaluation described in Chapter 6. The results are documented in Table 4.8. There are two models induced for each variation strategy: one model induced from news story headline text and another from news story text. There are a range of results for the labelling strategies which used market �uctuations, and consequently the results are presented for these strategies as a range. The F-measure was calculated with Lingpipe's [Alias, 2008] implementation which calculates a micro average
4
F-measure . The worst performance in terms of estimated F-measure was the market alignment strategy whose results were inferior to all of the competing strategies. The remaining strategies have similar estimated F-measures, but it is arguable that the combined rule and market alignment labelling strategies are superior because they have marginally higher estimated F-measure than the competing strategies. This evaluation was not intended to be a comprehensive evaluation, but a baseline evaluation
4
More information can be found at http://goo.gl/vB23t
CHAPTER 4.
TEXT ANALYSIS
94
Labelling Strategy
Model
Estimated F-measure
Sentence Rules (Event only)
Headline
0.67
Sentence Rules (Event only)
Text
0.47
Sentence Rules (Sentiment only)
Headline
0.51
Sentence Rules (Sentiment only)
Text
0.47
Sentence Rules (Sentiment and Event)
Headline
0.64
Sentence Rules (Sentiment and Event)
Text
0.52
Market Alignment
Headline
0.29 - 0.45
Market Alignment
Text
0.31 - 0.42
Combined (Event + Market Alignment)
Headline
0.59 - 0.73
Combined (Event + Market Alignment)
Text
0.41 - 0.57
Combined (Sentiment + Market Alignment)
Headline
0.43 - 0.58
Combined (Sentiment + Market Alignment)
Text
0.37 - 0.52
Combined (Event and Sentiment + Market Alignment)
Headline
0.56 - 0.65
Combined (Event and Sentiment + Market Alignment)
Text
0.34 - 0.50
Self-train (Event + Market Alignment)
Headline
0.57 - 0.70
Self-train (Event + Market Alignment)
Text
0.37 - 0.54
Self-train (Sentiment + Market Alignment)
Headline
0.43 - 0.58
Self-train (Sentiment + Market Alignment)
Text
0.37 - 0.52
Self-train (Event and Sentiment + Market Alignment)
Headline
0.55 - 0.66
Self-train (Event and Sentiment + Market Alignment)
Text
0.37 - 0.52
Table 4.8: Estimated F-measure for competing labelling strategies.
intended to show the viability of each strategy. The applicability of each strategy to trading is shown in Chapter 6.
4.3 Comparing Sentence and Document Level Strategies The goal of the work presented in this chapter is to obtain and aggregate the value of news retrieved for each day. There have been presented two alternate approaches to analyse these news stories which were at the: 1. sentence level and 2. document level. This section will compare these alternatives in terms of their ability to produce a daily score for news stories which is similar to a human annotator. The evaluation used a company speci�c ontology news retrieval system (see page 63) to recommend news for �Microsoft� for the date 20-06-2009, which was randomly selected for the evaluation. The news retrieval system recommended 64 news stories. The news stories were hand scored assigning a value of 1 to a positive news story, 0 to a neutral news story
CHAPTER 4.
TEXT ANALYSIS
95
and -1 to a negative news story. An average news story score was calculated for the day. It was not possible to compare all the strategies and their variations, consequently one representative strategy was selected from the sentence level and one from the document strategy. The selected sentence level strategy was the combination of event and sentiment rules at the news story text level. The selected document strategy was the combined strategy which used a event rule classi�er. The document level strategy classi�ed news stories into one of three categories:
neutral,
positive and negative. The classi�cation label was substituted for a value: 0 for neutral, 1 for positive and 1 for negative. An average score for the day was calculated by dividing the total news score for the day. The sentence level strategy was adapted to produce a document score as it was not possible in the time available to manually label and score all sentences in the selected news stories. The document score was calculated by dividing the score computed for all sentences in a news story by the total number of sentences in a news story. For example, if a total sentence score for a document was 100 and there was 100 sentences in the news story then the document score would be 1. A maximum score for a document was limited to 1 and a minimum score for a document was -1. If a score greater than 1 was returned then it would be replaced by 1, if a score less than -1 was returned it would be replaced by -1
5 . Values between -1 and
+1 were not altered. An average sentence level score was calculated for the day by summing all of the document scores computed by the sentence level strategy and dividing it by the number of stories. The combination of event and sentiment was an average of the averages for the day's sentiment and event scores. The results are in Table 4.9. The manually labelled data set suggests that overall the day was slightly positive.
The sentence level strategy produced a positive value whereas the
combined strategy produced a slightly negative value. The majority of values produced by both strategies were 0 which was similar to the manual evaluation. Although the combined strategy produced a marginally negative value, the evaluation provides some evidence that the strategies produce a single day news score similar to a manual annotator. Average Document Score Manually Labelled
0.03±0.66
Sentence Level Strategy
Document Level Strategy
Event + Sentiment
Self-Training
0.06±0.68
-0.02
±0.71
Table 4.9: Evaluation of sentence and document level strategies' calculation of a daily news value.
It may be possible that the results described in Table 4.9 could have been achieved by chance,
5
In practise this was not necessary as all stories were scored with a value between -1 and 1
CHAPTER 4.
TEXT ANALYSIS
96
consequently an alternate evaluation was conducted where the accuracy of the classi�cations was measured. The results are presented as a percentage of stories estimated correctly. The results are presented in Table 4.10. The sentence level strategy estimated the direction of a news story more accurately than the combined strategy. Accuracy Sentence Level Strategy
Document Level Strategy
Manually Labelled
Combined (Event Rules + Market Alignment)
57.81%
50.00%
Table 4.10: Evaluation of sentence and document level strategies'.
4.4 Discussion of results This chapter has presented two strategies for classifying information in news stories.
The
strategies attempted to classify news stories at two levels:
The
sentence and document.
sentence level used rules to score event and / or sentiment phrases in a sentence. A value for day's news is calculated by aggregating the score for all the sentences of news stories published in a single day. The sentence strategies were evaluated on a manually labelled gold standard. The document level strategies used: rules, market �uctuations, and a combination of rules and market �uctuations to label news stories to be used to train a classi�er. The competing labelling strategies were evaluated with an estimated F-measure using a small labelled set of news stories. The strategies were evaluated with two types of tests. The �rst evaluation tested the ability of a strategy to classify a sentence or a document with the correct label and / or score. The second test evaluated the ability of a strategy to produce a single score for a day's news. The evaluations were limited because it was not possible to manually label large amounts of data. It is debatable whether large amounts of labelled data would provide a more through evaluation because these strategies were designed for trading, and there was no authoritative method for labelling news stories with reference to their e�ect on a �nancial market. The work presented in this chapter provides some evidence that the presented strategies are able to classify news stories or sentences. The ability of these classi�cation and labelling strategies to enhance a trading strategy will be evaluated in Chapter 6.
Chapter 5
Direct Speech Analysis A news story may contain direct speech from a person who has a strong connection with the subject matter. A person who has direct connection to a news story may have knowledge which is not explicitly expressed in the news story, therefore the person's words in the quoted speech may have more e�ect on a stock or �nancial market than the remaining news story text. There are a number of examples where direct speech alone has dramatically moved a market or share value. This chapter describes two novel approaches which were designed to classify direct speech with the aim of using this information for �nancial trading.
5.1 Introduction There are many examples of direct speech which have had a direct impact on �nancial markets. The following are illustrative examples of this e�ect. Gerald Ratner was the CEO of Ratners which was a successful UK chain of low cost jewellers in 1980s and 1990s.
In 1992 Gerald Ratner gave a
humorous
speech to the Institute of
Directors (IOD). Two quotes were reported in the UK mass-media [Ratner, 2007]. The �rst quote was:
We also do cut-glass sherry decanters complete with six glasses on a silver-plated tray that your butler can serve you drinks on, all for ¿4.95. People say, �How can you sell this for such a low price?�, I say, because it's total crap.
The second quote was:
We sold a pair of earrings for under ¿1,which was cheaper than a prawn sandwich from M&S, but probably wouldn't last as last as long.
97
CHAPTER 5.
DIRECT SPEECH ANALYSIS
98
Ratners the company lost 500 million pounds in market value and had to change its name to Signet to distance itself from his speech [Ratner, 2007]. The phrase
doing a Ratner
entered
the British lexicon as a metaphor for making a serious error. The second example is the case of Mervyn King who was the governor of the Bank of England in 2008. He stated:
So, taken together, the combination of a squeeze on real take-home pay and a decline in the availability of credit poses the risk of a sharp and prolonged slowdown in domestic demand.
It now seems likely that Britain is entering a
recession.
The e�ect of the quote was to push the level of the pound to a �ve year low against the
1
dollar, and to remove 400 points from the Dow .
The information in the speech by King
was not new because his hypothesis had been stated earlier in the press by journalists and �nance professionals, but did not have the same e�ect on the markets.
Topman which Menswear Magazine which was
The last example is the case of David Sheppard who in 2001 was the CEO of is a UK based clothing retailer.
He gave an interview to
widely reported in the British mass-media. In the interview he replied to a question which asked him who were the target customers of his company. In reply he stated his customers were:
Hooligans who were more likely to wear a suit for a court appearance than to a
2
job. .
The Arcadia Group, which was the parent group of Topman lost 4 pence from their share price. The three previous examples demonstrate the ability of a
candid
quotation to e�ect a share
price or �nancial market. The research literature, however, was sparse when searched for work which tried to identify a causal e�ect of direct speech and share price movement. Collingwood [2009] proposed that a CEO was the physical embodiment of a company, consequently what the CEO says or does can in�uence the company's future prospects and therefore its share price. Higgins and Bannister [1992] suggest that the communications of a CEO may contain information which could indicate the future direction of the company's share price. CEOs speech may contain useful information, it may not always be truthful. Spindler [2006] states that lying may be a successful business strategy because it can manipulate certain
1 2
More details about the speech can be found at: http://news.bbc.co.uk/2/hi/business/7682723.stm. More details about Sheppard's comments can be found at: http://www.telegraph.co.uk/news/uknews/
1334682/Topman-tailors-for-beer-swilling-hooligans.html
CHAPTER 5.
DIRECT SPEECH ANALYSIS
99
audiences, for example customers, sta� or traders.
Larcker and Zakolyukina [2010] state
that lying by CEOs can be detected because their lies have certain linguistic features. News stories can also quote �nance professionals such as analysts.
There is a substantial
body of work which documents the e�ects of �recommendations� made by analysts, but the research literature is sparse when evaluating the e�ect of an analyst's quotes in news stories. Kuperman, Athavale, and Eisner [2003] suggest that the motivation for �nance professionals who allow themselves to be quoted in the mass-media is threefold:
1.
increasing their
in�uence upon their fellow �nance professionals, 2. providing wider exposure to their stock recommendations and 3. increasing business of their employer. The explicit hypothesis of Kuperman is that analysts wish to in�uence stock prices because it is bene�cial to their clients and to their employer. Daly [2009] suggests that analysts pronouncements can e�ect the behaviour of investors. Busse and Clifton Green [2002] found that analysts who appear on television can in�uence the market within
seconds.
Tamura and Hiromichi [2002] stated
that analysts form a consensus about a certain market or stock. If the Tamura and Hiromichi hypothesis is correct than if the analysts who are quoted in the media form a consensus about a �nancial market or stock then they may represent analysts in general. In summary, analysts quoted in news stories can in�uence the market because they act as
opinion formers
which
in�uence other less high pro�le analysts which in turn in�uence their clients. This is in turn shapes investors attitudes towards markets and stocks. In this context, it is claimed that text mining methodologies are appropriate to discover the relationship between the content of direct speech and its in�uence on share prices.
This
chapter's main goal is to describe two novel strategies which use direct speech analysis with the goal of identifying information which is useful for trading. The proposed approach of this chapter is to classify direct speech in news stories into three categories: negative, neutral and positive. The label is replaced with a value, for example, a �positive label� could be replaced with a value of 1 and a �negative value� could be replaced with a value of -1.
The substituted values for the quotes published on a given day are
summed to produce a single value which is then used as a feature in a stock trading system. This approach faced two main challenges:
1.
there was no freely available labelled data
to train a classi�er and 2. no resources to manually label large amounts of data, therefore the proposed methods were required either: 1. to create their own labelled data or 2. use external resources. were explored:
1.
Given these di�culties associated with direct speech data, two paths use of linguistic strategies to label the data, and 2.
manually label a
small number of documents and apply semi-supervised strategies to add labels to some of the unlabelled documents. Direct speech used in this chapter was contained in news stories. The extraction of this direct speech was achieved with the Open Calais web service [Reuters, 2010b] which extracted for each quote the following: 1. quote, and 2. the speaker. Open Calais, often, but not always,
CHAPTER 5.
DIRECT SPEECH ANALYSIS
100
extracted the following for a quote: 1. the speaker's a�liation and 2. the speaker's job title.
5.2 Related Work The research literature search covered a number of areas which were pertinent for the classi�cation of direct speech into sentiment categories. The researched areas included: bootstrapping, pre-compiled sentiment resources and semi-supervised learning. The bootstrapping and pre-existing linguistic sentiment resources can be grouped under the heading of �linguistic strategies� and therefore they are predicated upon the linguistic characteristics of the data and do not require labelled data.
The bootstrapping strategies allow the extraction and
labelling of linguistic units (unigrams, bigrams, multiword expressions, etc) from unlabelled data to be used in a future classi�cation strategy. Pre-existing linguistic resources are preconstructed resources which have labelled linguistic units with a polarity score which indicates a classi�cation of the linguistic unit, i.e. a linguistic unit which has been assigned a score of greater than 0 could be classi�ed as �positive�.
The following subsections will describe
related work in the bootstrapping, pre-existing linguistic resources (sentiment resources) and semi-supervised learning.
5.2.1 Bootstrapping strategies A �rst step in a bootstrapping strategy could be to create dictionaries with a linguistic unit (unigram, bigram, etc) and a sentiment label.
These dictionaries could be used to assign
a text to categories by scoring dictionary terms which are present in a text.
A potential
strategy for dictionary construction is to use known sequences of words to create multi-word expressions from unlabelled data.
The extracted expressions can be assigned a sentiment
orientation based on their co-occurrence with known sentiment words. An example of this approach was described by Liu [2007a] who published a set of patterns
3 (Table 5.1) which extracted a set of candidate bigrams. The pointwise mutual
of POS tags
information was used to estimate the likelihood of each bigram,
P M I(t1, t2) = log
where
Pr
t1
is the �rst term (word) of a bigram,
PMI
(5.1)
is the second term (word) of a bigram and
is the probability of an expression.
Bigrams which had a
3
t2
P r(t1, t2) P r(t1)P r(t2)
score of 0 or less were removed.
A reference for POS tags can be found at: http://goo.gl/ABLUn
CHAPTER 5.
DIRECT SPEECH ANALYSIS
First Word POS Tag
101
Second Word POS Tag
Third
Word
POS
Tag
(not
extracted) JJ
NN or NNS
anything
RB, RBR, or RBS
JJ
not NN or NNS
JJ
JJ
not NN or NNS
NN or NNS
JJ
not NN or NNS
RB, RBR, or RBS
VB, VBD, VBN or VBG
anything
Table 5.1: Bigram POS sequences for the creation of sentiment bigrams.
The sentiment orientation for each bigram was calculated by its co-occurence with an anchor term of known sentiment orientation. Liu suggested the use of the words �poor� and �excellent� as the negative and positive anchor terms. The sentiment orientation calculation is given by,
SO(b) = log where
b
is a bigram,
p
hits(b hits(b
NEAR NEAR
is a �positive� anchor term and
p)hits(n) n)hits(p) n
(5.2)
is a �negative� anchor term.
Liu worked with Internet search engines, and therefore the terminology he used in Eq.5.2 refers to terms associated with Internet search. The term
hits is synonymous with frequency
because �hits� is typically the number of the documents returned by a search engine which contain the target word [Liu, 2007a].
N ear
is an operator for the Alta Vista search engine
which determined maximum distance between two search terms (words) before they would be included in a search result [Liu, 2007a]. The �Near� operator is no longer supported by Alta Vista, but anecdotal evidence suggests the maximum distance was 10 words, i.e. two search terms had to have no more than 10 words separating them in a document before a document would be included in a search result. A document or sentence is scored by taking an average of the it contains.
SO
score of the bigrams
Liu claims an accuracy of 66% for movie reviews and 88% for automobile
reviews [Liu, 2007a]. An alternate method for labelling linguistic units from unlabelled data is to use
polarity clues.
Polarity clues [Wilson, Wiebe, and Ho�mann, 2005] was a resource released by the MPQA
4
project . The resource provided a set of sequences which combine: words, word stems and POS tags which are known as clues. In each sequence there would be a word or stem (root of a word) which would have a pre-determined polarity (sentiment direction). The resource can be illustrated with a �clue� from the resource. The clue is:
4
MPQA project could be found at: http://www.cs.pitt.edu/mpqa/
CHAPTER 5.
DIRECT SPEECH ANALYSIS
type=weaksubj pos1=adj
102
len=1
stemmed1=n
word1=abandoned priorpolarity=negative
The clue contains the following information:
•
Strength of the polarity of the clue.
•
Length of the target (in words) of the clue.
•
The target of the clue.
•
The target POS tag. Depending on the context words may have di�erent POS tags, for example, the word �receding� can be a: noun, verb or adjective depending upon the context.
•
If the target is stemmed or not. If it is stemmed then the polarity clue can be applied to all words with the same root, rather than the single word.
•
The polarity of the target word or stem.
The �rst entry in the example clue is type=weaksubj which indicates that the target of the clue has weak subjectivity.
A weakly subjective clue describes a word which is subjective
in some circumstances, whereas the alternate strongly subjective clue is subjective in all circumstances [Wilson, Wiebe, and Ho�mann, 2005]. len=1
which indicates that the target is one word.
The next entry in the clue is the The next item in the sequence is
word1=abandoned , which is the target of the �clue� and will be assigned a sentiment or polarity category. The next part of the sequence is
pos1=adj
which indicates that use of
�abandoned� must be as an adjective rather than its verbal state. The next in the sequence is stemmed1=n which indicates that the polarity will be assigned to the word �abandoned� and not its stem. The last in the sequence is
priorpolarity=negative
which indicates that
the polarity of the target word �abandoned� is �negative�. Another approach is to label a small amount of data into known categories and expand linguistic units from each category with external linguistic resources. Liu [2007a] suggests the
Construct separate seed sets for nouns, adjectives, verbs and adverbs from labelled data, 2. Label the nouns, adjectives, verbs and adverbs (positive, negative), 3. The separate seed sets are grown by looking for synonyms and antonyms from WordNet until no new words can be added to the set and 4. Manually inspect the �nal set and remove any words with incorrect labels. The expanded dictionaries can used in a rule based approach to
following strategy: 1.
label documents. An alternative to using linguistic resources to increase the number of entries in a dictionary was proposed by Rilo� and Weibe [2003]. She used extraction patterns with terms of known
CHAPTER 5.
DIRECT SPEECH ANALYSIS
103
polarity to label �high con�dence� subjective sentences in unlabelled data. The information extracted from the labelled �high con�dence� subjective sentences was used to create new extraction patterns which were used to label new �high con�dence� subjective sentences. The process continued until no new sentences were labelled and no new information could be extracted from the unlabelled data.
A further alternative was to use linguistic �hints�
to propagate labels from words of known polarity to words with an unknown polarity. Hatzivassiloglou and McKeown [1997] used linguistic connectors to propagate a label from one word to another. Connectors are words which link one word with another [Peto�, 1988], for example: and, or, but, whereas, etc. The Hatzivassiloglou and Columbia strategy used a set of words with known polarity label. They extracted words which were connected to the known words by a connective. The extracted words were determined to be of the same polarity orientation as the known words by a log linear model regression model. The extracted words are assigned to a category by a clustering process.
5.2.2 Sentiment resources It is often possible to use pre-built sentiment dictionaries to determine the sentiment orientation of a text.
There are several dictionaries available, but this section will discuss
two: SentiwordNet[Esuli and Sebastiani, 2006] and WordNetA�ect[Strapparava and Valitutti,
5
2004]. The two sentiment dictionaries are based upon WordNet. SentiwordNet labels synsets
which are groups of related words that are synonyms of each other. SentiwordNet labels each synset of WordNet as either: positive, negative or objective.
The labelling of a sysnet is
achieved by a set of classi�ers each trained on di�erent data. WordNetA�ect labels concepts which are subsets of synsets into negative, positive or neutral categories. are based upon emotions, for example the word
anger
The categories
would indicate a negative category.
WordNetA�ect was built by manual labelling of a core set of sysnets whose labels were propagated into the remaining unlabelled synsets of WordNet through connections to the labelled synsets.
5.2.3 Semi supervised learning There are many methods of semi-supervised learning (see review by Zhu [2008] for an extensive survey). problem -
The work described here will focus on a particular approach to this
self-training.
Semi-supervised learning uses a mix of unlabelled and labelled data
with the aim of propagating labels from the labelled data to the unlabelled data from which a robust classi�er can be induced. Self-training propagates labels by �rst inducing a classi�er from labelled data. The induced classi�er classi�es all the unlabelled data. The classi�cations which are
5
high con�dence
are added to the labelled data. A new classi�er is induced, and
Synsets can also be referred to as synonym rings.
CHAPTER 5.
DIRECT SPEECH ANALYSIS
104
the process repeated until a stopping condition is met [Abney, 2007]. Classical self-training does not limit the unlabelled data the classi�er can label and add as training data. Variations of self-training can limit the unlabelled data the classi�er has access to, which can improve the quality of the induced model [Chang, Ratinov, and Roth, 2007].
Applying a constraint to the classi�er can limit the amount of data the classi�er
has access to.
There are two documented types of constraints:
hard constraints such as
voting or co-training [Abney, 2007] and soft constraints such as prior knowledge.
A hard
constraint explicitly limits the unlabelled data the learner can add as labelled data.
Soft
constraints do not explicitly limit the unlabelled data, but penalize the learner if it violates a pre-determined constraint. The literature search was restricted to using prior knowledge as a method of constraining the learner because it was thought that the bootstrapping strategies described in at the start of this subsection on page 100 could assist in identifying
knowledge
prior
from labelled data.
Druck, Mann, and Mccallum [2008] used
common knowledge
as a soft constraint.
provided the example of classifying news stories into sports categories.
They
They contended
that the word �puck� would act as a soft constraint because it was a strong indicator of ice hockey stories, consequently a classi�er which classi�ed a news story with the term �puck� as anything other than �ice hockey� would be penalised. Chang, Ratinov, and Roth [2007] used a combination of constraints: unary, dictionary based and n-ary constraints to provide
better
training examples for a self training strategy. Chang, Ratinov, and Roth [2008] provided a framework for using constraints in a semi-supervised strategy which he called
Conditional Models.
Constrained
Carlson, Betteridge, Wang, Jr., and Mitchell [2010] proposed the
training of many classi�ers each with di�erent constraint strategies.
The classi�ers then
act as constraints on each other. There are many published papers which describe the use of constraints for a particular task. The constraints used in these works are often derived with knowledge from outside of the data available for the classi�cation task. There is a problem for this strategy in a domain where there is no external or common knowledge to create constraints.
5.3 Proposed Strategies A quote or direct speech reported in text could be considered to be a sentence, or a group of sentences which may be susceptible to the sentence level strategy described in the previous chapter (see page 71). The sentence level strategy was not successful when applied to quotes which was due to the linguistic characteristics of the quotes for example, invented words and euphemisms. The failure of the sentence level strategy necessitated the construction of separate strategies to classify direct speech. The following subsections describe two contributions of this thesis to semi-supervised clas-
CHAPTER 5.
DIRECT SPEECH ANALYSIS
si�cation of direct speech.
105
The two strategies are Guided Self-Training and a contextual
classi�cation strategy. The Guided Self-Training strategy uses high precision rules to correct mistakes made by a classi�er induced from initially labelled data whereas the contextual strategy relies upon separating the data into groups and applying a separate labelling and classi�cation strategy to each group.
5.3.1 Guided Self-Training The �rst proposed solution is
Guided Self-Training
(GST) which uses high precision rules to
correct high con�dence classi�cations by a base learner in a semi-supervised learning process. GST was initially designed to classify quotations, but it can be used as a general strategy for situations where
weak
models are induced from the initial training data. GST uses a high
precision rule classi�er (HPRC) to guide selections made by an induced model. HPRC guides the selection of candidates by labelling a subset of unlabelled documents which will be known as the
high con�dence pool.
A HPRC labels a subset because high precision classi�cations
are normally made at the expense of recall. This pool of high con�dence classi�cations is used to limit the selection of examples in each iteration of a self-training (ST) process by testing the learner's labelling of high con�dence candidates.
The learner's label is altered
if it is di�erent to the label applied by the HPRC. GST accepts the learner's label: 1. if a classi�ed document is not part of the high con�dence pool or 2. a learner classi�es a high con�dence pool document with the same label as the HPRC. The newly labelled documents are then added to the labelled data and new iteration is started. This process continues until a speci�c stopping condition is met. GST does not prescribe a method for constructing a high precision rule classi�er.
There
are a number of possible rule classi�ers, for example Weibe's high precision subjectivity classi�er [Rilo� and Weibe, 2003]. A selected rule classi�er must have a high precision which typically comes at the expense of recall. A classi�er which does not have high precision may change correct high con�dence classi�cations by a base learner which may impair the training process. The GST method is described in Algorithm 7. GST takes two main inputs: the labelled (LD) and unlabelled (UD) data sets. The outer loop (lines 3-26) represent the typical self-training iterations. The uniqueness of the proposal are the following:
•
Documents classi�ed by the base learner with a high con�dence which are contrary to the high precision classi�cation (the pool of high con�dence candidates) are assigned to the high precision classi�cation. These documents are assigned to the labelled data for training in the next iteration.
•
The high precision classi�er can abdicate (i.e no decision) and therefore high con�dence candidates can be selected by the base learner with out the explicit agreement of the
CHAPTER 5.
DIRECT SPEECH ANALYSIS
106
high precision classi�er.
Algorithm 7: Description of GST Candidate Selection Cycle. Input: LD: Labelled Data Input: UD: Unlabelled Data Input: sThr: Minimum classi�cation con�dence for document to be added to LD Input: Rule: A high con�dence Subjectivity classi�er which return a classi�cation for a document
Input: Learner: the classi�cation algorithm that is to be self-trained Output: Learner: trained classi�er **Learn a classi�er**;
M odel ← Learner(LD);
repeat lClass ← M odel.classif y(U D); rClass ← Rules.classif y(U D); CD ← {}; AD ← {}; forall the d ∈ U D do if lClass.conf idence[d] ≥ sT hr then U D ← U D \ d; if rClass[d] 6= N U LL and rClass[d] 6= lClass[d] CD ← CD ∪ {< d, rClass[d] >};
then
else AD ← AD ∪ {< d, lClass[d] >}; count ← Count(CD); if count == 0 then count ← Count(AD); T D ← ReturnRandomDocs(AD, count); U D ← U D ∪ (AD \ T D); LD ← LD ∪ CD ∪ T D; **Get a new model**;
M odel ← Learner(LD);
until No more new candidates ; return M odel; In summary, the GST algorithm extracts features (words) from manually labelled data to create a list of words. The list of words are expanded by using an external linguistic resource (WordNet) to form a new enhanced list of words. A high precision rule classi�er uses the
CHAPTER 5.
DIRECT SPEECH ANALYSIS
107
enhanced list of words to �correct� classi�cations made by a base learner trained on the original labelled data in iterative self-training process.
5.3.2 Contextual Classi�cation Strategy The contextual strategy relied upon an assumption about the data. The assumption was that there were two groups of people whose comments are reported in the mass-media and that their motivation for speaking di�er. One hypothetical group will be known as the �biased group� and the other group will be known as the �unbiased group�. Members of the biased group will most of the time have quotes that are expected and thus have no e�ect on the market. This means that if quotes of people with job title A most of the time do not e�ect the market then job title A must belong to the biased group. On the contrary if the majority of quotes of people belonging to job title B, have some e�ect (positive or negative) on the market, then job title B must belong to the unbiased group. The discovery of the job titles associated with each group was achieved by manually aligning a set of quotes with a market. The job titles of the respective speakers were determined by Open Calais. For each job title we calculated the proportion of quotes aligned with market movements. If this proportion was found higher than 50% the job title was assigned to the biased group. Conversely, if the proportion of the quotes aligned with no market movement was the higher than 50% the respective job title was assigned to the biased group.
An
example of the discovered job titles are in Table 5.2. The two resulting sets of job titles were used as a decision rule to determine if a quote made by a speaker belongs to either the biased or unbiased group. If the job title of this speaker does not belong to either of the groups the quote is by default assigned to the biased group.
Biased
Non-Biased
Chairman, CTO,
Chief Economist,
Co-head,
Credit Analyst,
Company
CBI
President
economic adviser
chief
Table 5.2: An example of job titles assigned to a group.
An overview of the contextual classi�cation strategy is presented in Figure 5.1. The contextual strategy has three separate classi�ers. Two classi�ers for quotes assigned to the biased group, and one for quotes assigned to the unbiased group. The �rst classi�er for the biased group classi�es the quotes into: expected or surprising categories whilst the second classi�er classi�es the �surprising� quotes into positive or negative categories. The classi�er for the unbiased speakers classi�es quotes into positive and negative categories.
CHAPTER 5.
DIRECT SPEECH ANALYSIS
108
Determine type / group of speaker using job title Biased Group Step 2a: Classify type of quote Surprising Step 3: classify impact on market
Positive quote
Unbiased Group
Step 2b: Classify impact On the market
Expected Neutral quote Positive quote
Negative quote
Negative quote
Figure 5.1: Overview of the contextual classi�cation strategy
The �rst step is to train a classi�er to classify a quote as either �surprising� or �expected�. This was achieved by manual alignment of quotes with market movements. The annotator selected a quote at random, identi�ed a stock ticker associated with the company which was associated with the speaker. The annotator veri�ed the stock price on the day on the quote as made. If the stock price changed su�ciently to satisfy the annotator that the quote had induced the movement then the quote was labelled as �surprising� otherwise it was labelled as �expected�. The small amount of labelled quotes was expanded with a simple form of label propagation which clustered the labelled quotes with the larger amounts of unlabelled quotes. A quote was represented as a �bag of words�. The labelled quotes were clustered with separate batches of unlabelled documents. Each batch contained 1000 labelled quotes. The batches were limited to this number to ensure that the clustering process was conducted in a timely manner. The clustering method used in this process was the RapidMiner �Top Down Clustering operator� [Mierswa, Wurst, Klinkenberg, Scholz, and Euler, 2006]. The `Top Down Clustering operator� was used initially to see if there was any relationship between quotes in clusters
CHAPTER 5.
DIRECT SPEECH ANALYSIS
109
at di�ering levels. The depth of the clustering was the default of 5, no pre-set number of clusters was set.
The labels from the labelled quotes in a cluster were propagated to the
unlabelled data if: 1. a single class of labelled quotes accounts for 75% of quotes in a single cluster and 2. there are no quotes from the other class in the cluster. It is accepted that the size of the clusters will directly e�ect the performance of this technique, but the described experimental set up was satisfactory for the described experiment. The next step is to train a new classi�er to separate quotes which have been classi�ed as surprising into positive and negative categories. This was achieved by aligning the documents labelled in the previous step as surprising with price rises or falls in a given stock price. The aligning process was conducted manually. The annotator had the �nal decision whether the market movement inferred that the quotes was positive or negative. trained with the labelled quotes.
A new classi�er was
At this stage, there were two trained classi�ers:
1.
a
classi�er which had been trained with expected and surprising data and 2. a classi�er which had been with trained with negative and positive quotes. The last step was to create a decision rule for the members of the unbiased group.
The
process was similar to the high precision subjectivity classi�er described by Rilo� and Weibe [2003]. The quotes which are to be used as training data for a classi�er are discovered by the following process: 1. manually label a number of quotes made by members of unbiased group, 2. manually select sentimental words from the labelled data, 3. expand extracted words with WordNet, 4. separate words into positive and negative categories, 5. use a decision rule to label unlabelled quotes made by members of the unbiased group with a label (positive or negative), and 6. train a new classi�er with the quotes labelled from this process. The strategy can be used as a whole, however it is possible to use the trained classi�ers separately.
The motivation of using the classi�ers separately would be to measure the
predictive capability of either the unbiased or the biased group of speakers. These variations of the contextual strategy are evaluated in Chapter 6.
5.3.2.1 Experiments with Direct Speech This section describes some initial experiments with direct speech.
The experiments are
shown to support the hypotheses made on page 107. The �rst experiment was designed to provide evidence that there existed two groups of speakers in the quote collection, and that these groups had separate lexicons which could be identi�ed through lexicon analysis. The two groups will be known as either: 1. biased or 2.
unbiased.
The biased group will contain members who are compelled to speak in a
misleading manner and on occasion are compelled to speak truthfully. The unbiased group will contain members who are compelled to speak truthfully. The initial experiment analysed the lexicon of hypothesized members of the biased and
CHAPTER 5.
DIRECT SPEECH ANALYSIS
110
unbiased groups. The members were selected by their job role: 1. CEO (biased group) and 2. analyst (unbiased group). The experiments used the quotes published between October 2008 and September 2010. In this group of quotations there were 54,845 quotes attributed to �analysts� and 38,089 quotes attributed to CEOs. The experiment extracted adjectives from quotes because adjectives are known to be the conveyors of the opinionated language [Wiebe, Wilson, Bruce, Bell, and Martin, 2004].
The a�nity of an adjective with either the CEO
group of quotations or analyst group of quotations was calculated with Pointwise Mutual Information (PMI) as follows,
P M I(adj, cl) = log2 where
adj
represents an adjective,
Pr
P r(adj, cl) . P r(adj)P r(cl)
represents a probability, and
(5.3)
cl
is the job role of the
speaker. Adjectives which were assigned a score greater than zero when calculating their a�nity with class �CEO� were assumed to be part of the CEO lexicon. The experiment produced a list of 1,401 adjectives.
The adjectives were ranked by PMI score in descending order,
consequently adjectives which had a strong a�nity with the CEO's lexicon had a higher rank than adjectives which had a weaker a�nity with the lexicon.
An inspection of the
CEOs adjective lexicon revealed that the majority of the adjectives were
positive.
The
positive adjectives typically had higher ranks than the negative adjectives. The �rst negative adjective was ranked 87th. The positive adjectives were overly positive, for example, `superb� and �immense', whereas negative adjectives were not exaggerated. There were a number of jargon / domain speci�c adjectives in the CEO's lexicon, for example, `win-win� and �missioncritical�.
A frequency analysis of unigrams in CEOs' quotes was made.
analysis did not consider stop words.
The frequency
A manual inspection was made of the 100 most
frequent and infrequent unigrams. The most frequent unigrams consisted of mainly positive unigrams whereas the infrequent unigrams were: negative, spelling errors or invented words. In summary, the lexicon of the CEO is overwhelmingly positive, which is, nevertheless a contradiction because the quotes were harvested between 2008 and 2010, which was a time of a severe economic crisis. The same experiment was repeated for quotes which were made by analysts. A PMI score was assigned to adjectives which were present in quotes made by people with the job title �analyst�. The PMI score was calculated as per Eq.5.3 for each adjective. Adjectives with a PMI score of 0 or less were removed. The experiment realized 415 adjectives, consequently the analyst's adjective lexicon was 70% smaller than the CEO's lexicon, although there were more quotes attributed to analysts than to CEOs.
The adjectives were ranked in
descending order of PMI score. The �rst negative adjective, �
speculative�,
was ranked 2nd,
conversely the highest ranked negative adjective in the CEO's lexicon was ranked 87th. In addition the negative and positive adjectives were not exaggerated.
A frequency analysis
CHAPTER 5.
DIRECT SPEECH ANALYSIS
111
failed to �nd a division between positive and negative adjectives because both positive and negative adjectives appeared in frequent and infrequent unigram groups. In summary, there is clear evidence that there are signi�cant di�erences in the lexicons of CEOs and Analysts. The lexicon analysis provides evidence for the initial hypothesis that people with connections to companies (biased group) will use language similar to rhetoric[Cyphert, 2010] and lying [Larcker and Zakolyukina, 2010] whereas
independent
people (unbiased group) will
use more measured language. The second experiment evaluated the advantage of using: 1. a speaker's group membership and 2. unigrams in the quotes, as features. This was compared against the following features: 1. speaker's job title and quote unigrams, and 2. quote unigrams. The data was hand labelled into three classes: positive, negative and neutral. There were 155 labelled quotes. A 10 times 10 fold cross validation as implemented in RapidMiner [Mierswa, Wurst, Klinkenberg, Scholz, and Euler, 2006] was used to calculate an average accuracy measure. A Naive Bayes classi�er was used in the evaluation.
The results are in Table 5.3.
The results for this experiment
demonstrate that the addition of a �job role� feature is detrimental to performance whereas the addition of a speaker's group membership provides a small advantage over the experiment which used only unigrams. Classi�er
Features
Avg. Accuracy
Naive Bayes
Unigrams
0.64
±0.01
Naive Bayes
Unigrams + JR
0.39
±0.01
Naive Bayes
Unigrams + OMR
0.72
±0.010
Table 5.3: Estimated Accuracy from 10 times 10 fold cross-validation. JR= Job Role, OMR = Opinion Maker Role (Biased or Unbiased) and Avg. = Average.
5.4 Comparison of the two direct speech classi�cation strategies. This section will describe experiments which provide an evaluation of the proposed strategies. The �rst experiment evaluated the complete contextual strategy, and Guided Self Training (GST), against several competing strategies on a separate labelled set of hand labelled documents. A new set of documents was used for this experiment to ensure that there was no bias in the set of documents (used in the previous experiment) towards the contextual strategy. The experiment used 1322 hand labelled quotes which were classed as either:
negative,
neutral or positive. 32% of the quotes were made by members of the unbiased group and 68% of quotes were made by either: members of the biased group or unidenti�ed speakers.
CHAPTER 5.
DIRECT SPEECH ANALYSIS
112
The contextual strategy classi�ed both quotes from members of the biased and unbiased groups. GST relies upon a high precision rule classi�er (see page 105). There is no recommended rule classi�er, but in this experiment Weibe's [Rilo� and Weibe, 2003] high precision subjectivity classi�er was chosen because previous experiments have found that it has a higher precision than competing rule classi�ers [Drury, Torgo, and Almeida, 2011]. GST and the contextual strategy were evaluated against baseline strategies that had been used in initial attempts to classify direct speech. The strategies were:
•
Inductive: An inductive strategy induces a classi�cation model using only the labelled data [Abney, 2007].
•
Self-Training: An iterative process where at each step a model is induced from the current labelled data and it is used to classify the unlabelled data set. assigns a con�dence measure to each classi�cation.
The model
If the classi�cation con�dence
measure is greater than a prede�ned threshold then the respective unlabelled cases are added to the new iteration training data with the classi�er assigned label. At the end of the cycle the learner is trained on the new labelled data set. This cycle continues until a stopping condition is met [Abney, 2007]. To ensure an equitable comparison the stopping condition for the self-training variants and GST were 50 iterations.
•
Voting strategy: is a variant of GST and uses two classi�ers, Weibe's high precision rule classi�er and a learner. A document is added to the labelled data if the rule classi�er and learner agree.
•
Veto strategy: is a variant of GST and uses two classi�ers, Weibe's high precision rule classi�er and a learner. A document is added to the labelled data if the rule classi�er and learner disagree. The label is applied by the rule classi�er.
The individual strategies labelled a set of documents which was used to train a Naive Bayes classi�er. Each strategy had 10% of the labelled data to either: 1. construct dictionaries and 2. train classi�ers. Each strategy had access to 384296 unlabelled quotes. The evaluation was a �holdout� evaluation which used Lingpipe's [Alias, 2008] F-measure calculation. Lingpipe calculates a micro average F-measure
6 across all the classes7 . The calculation of the F-
measure was on the 1190 labelled quotes that the strategies did not have access to in the training phase. The results are in Table 5.4. The contextual and GST strategies outperformed the competing baseline strategies.
The
di�erence between the contextual strategy and the nearest competitor was small, but the strategy has a signi�cant advantage over the remaining strategies.
6 7
see page 91 More information can be found at http://goo.gl/DvMi3
CHAPTER 5.
DIRECT SPEECH ANALYSIS
113
Strategy
Estimated F-measure
Inductive
0.35
Self-training
0.31
Voting
0.51
Veto
0.13
Contextual
0.53
GST
0.58
Table 5.4: Estimated F-measure for competing strategies.
The previous experiment used a small amount of manually labelled documents, consequently the selection of the quotes may not have been an accurate representation of the quote collection. An additional set of experiments were conducted for GST on linguistically similar domains where all the data was labelled.
The experiments were conducted for GST
only, because unlike the contextual strategy it did not rely upon insights into the data. The additional experimentation was conducted on user generated reviews for 1. meals [airlinemeals.net, 2010], 2.
airline
university lecturers [ratemyprofessors.com, 2010] and 3.
music concerts and records [reviewcentre.com, 2010].
The domains were chosen because
reviews are often written in an informal manner similar to speech, consequently the domains shared the following characteristics with the direct speech collection: 1. invented words, 2. slang, 3. profanity, 4. non standard spelling and grammar, 5. multi-word expressions and 6. non standard punctuation. The rating was taken as an indication of the polarity of the review. class assignment is described in Table 5.5.
The criteria for
Documents not satisfying the criteria for class
assignment were removed from the experiments. The resulting labelled data sets were used to compare:
1.
Two separate base learners (Naive Bayes and Language Models) and 2.
Alternative strategies.
The alternative strategies were:
1.
Inductive (LD) which was a
classi�er trained with only labelled data (LD), 2. Self-Training which was initially a learner trained with labelled data which classi�ed the unlabelled data and added �high con�dence� classi�cations to the labelled data. The labelled data was used to induce a new classi�er. This process continued until a stopping condition was met., 3. Voting, which used the high precision rule classi�er used by GST and a learner in a self-training process. Unlabelled data was added if the learner and the high precision rule classi�er agreed on their classi�cations., 4. Inductive (LD and RC) this strategy trained on the labelled data and the data selected by the rule classi�er (RC) used in GST., and 5. Veto strategy which used GST's rule classi�er and a learner in a self-training process. An unlabelled document was only added if the rule classi�er and learner disagreed. The label applied in this strategy would be that of the rule classi�er.
CHAPTER 5.
DIRECT SPEECH ANALYSIS
114
Domain
Positive Category
Negative Category
Airline Meals
4 -5 Stars
1-2 Stars
Teacher Reviews
�Good Quality�
�Poor Quality�
Music Reviews
4-5 Stars
1-2 Stars
Table 5.5: Polarity Criteria.
The experiments used a micro average F-measure.
The estimated F-measure experiments
used increasing larger random selection of documents as training data. The smallest selection of data was 1% of the total and the largest 5%.
The increments were in steps of 1%, for
example the second iteration of the experiment was 2%, the third 3% etc. At each iteration the experiment was repeated 20 times, for example the 1st iteration there would be 20 random samples of 1% and 20 estimations of F-Measure estimated in a �holdout� evaluation. The test set for the evaluation was the total domain less the data selected for training. For example, if 1% of the data was used for training than the remaining 99% would be used for testing. An overview of the process is the following: 1. randomly select training data (the LD set in Algorithm 7) and 2. hide the labels of the remaining documents to create the UD. The
Airline Food Domain
results are presented in Figures 5.2 and 5.3. The results demon-
strate a clear advantage for the proposed strategy for both classi�ers. The results demonstrate a signi�cant gain in F-Measure at the 2% of domain for training for both classi�ers. The gain in F-Measure halts at the 3% of domain for training. The two inductive strategies gain F-Measure as training data increases. The
Teachers Domain
results are presented in Figures 5.4 and 5.5. The results demonstrate
a clear advantage for the proposed strategy. In common with the airline food domain the Guided Self-Training(GST) shows a large gain in F-Measure at 2% of domain for training. The gain in F-Measure is more pronounced for language models.
GST demonstrates a
reduction in F-Measure with further increases in training data. The reduction in F-Measure is within the mean standard deviation. The inductive strategies in common with the airline food domain gains F-Measure with increases in training data. The self-training strategy gains in F-Measure increase with training data, but at a faster rate than the inductive strategies. The voting schemes also demonstrate a gain in F-Measure, but at a lower rate than the inductive and self-training strategies. The
Music Review Domain
results are presented in:
Figures 5.6 and 5.7.
The results
demonstrate that the proposed strategy shows a distinct disadvantage over the competing strategies. The lack of improvement achieved by GST could have been due to the robustness of the initial models. Robust models would not have made �obvious errors� which would have been corrected by the rule classi�er. A lack of corrections may have accounted for GST's lack of improvement over the competing methods.
GST Inductive(LD) Self−Training Voting Inductive (LD RC) Veto
0.6
0.7
●
● ●
●
● ●
● ● ●
●
GST Inductive(LD) Self−Training Voting Inductive (LD RC) Veto
● ●
●
●
●
●
● ●
0.5
●
●
●
1
2
0.4
●
0.4
0.5
Esitmated F−Measure
0.7
●
115
0.6
●
DIRECT SPEECH ANALYSIS
Esitmated F−Measure
0.8
CHAPTER 5.
1
2
3
4
5
Percentage Training Data
3
4
5
Percentage Training Data
Figure 5.2: Estimated average F-measure for
Figure 5.3: Estimated average F-measure for
each strategy using Language Models as a clas-
each strategy using Naive Bayes as a classi�er
si�er for airline meals reviews. LD = labelled
for airline meals reviews. LD = labelled data
data and RC = Rule Classi�er Selected Data.
and RC = Rule Classi�er Selected Data.
0.8
●
● ●
0.6
●
●
●
●
●
●
●
0.7
● ●
●
●
●
●
●
●
●
0.4
0.4
0.5
●
GST Inductive(LD) Self−Training Voting Inductive (LD RC) Veto
●
0.6
0.7
●
0.5
Esitmated F−Measure
●
GST Inductive(LD) Self−Training Voting Inductive (LD RC) Veto
Esitmated F−Measure
0.8
●
1
2
3
4
5
Percentage Training Data
1
2
3
4
5
Percentage Training Data
Figure 5.4: Estimated average F-measure for
Figure 5.5: Estimated average F-measure for
each strategy using Language Models as a
each strategy using Naive Bayes as a classi�er
classi�er for teacher reviews.
for teacher reviews.
LD = labelled
data and RC = Rule Classi�er Selected Data.
LD = labelled data and
RC = Rule Classi�er Selected Data.
The experiments in the Teacher and Airline meal domains show a peaking of F-measure,
CHAPTER 5.
DIRECT SPEECH ANALYSIS
116
and a decline in F-measure. The decline in F-measure with increasingly larger training data may be due to the more robust models making less mistakes to correct. It may have been possible that the HPRC �corrected� valid classi�cations which would have induced a worse
0.7
●
GST Inductive(LD) Self−Training Voting Inductive (LD RC) Veto
0.8
●
●
●
0.7
0.8
performance than if the HRPC had made no corrections.
GST Inductive(LD) Self−Training Voting Inductive (LD RC) Veto
●
●
0.6
●
●
● ●
●
1
2
●
●
●
0.4
0.4
●
● ●
0.5
●
●
●
Esitmated F−Measure
0.6
● ●
0.5
Esitmated F−Measure
● ●
1
2
3
4
5
Percentage Training Data
3
4
5
Percentage Training Data
Figure 5.6: Estimated average F-measure for
Figure 5.7:
Estimated F-measure for each
each strategy using Language Models as a
strategy using Naive Bayes as a classi�er for
classi�er for music reviews. LD = labelled data
music reviews. LD = labelled data and RC =
and RC = Rule Classi�er Selected Data.
Rule Classi�er Selected Data.
The full results for this experiment are available in the appendix on page 160. The results for strategies which had access to rule selected data frequently have a higher precision measure, but this improvement is frequently at the cost of lower recall. For example the mean recall and precision for the voting strategy in the Airline Food domain was 0.5 and 0.7, where as the inductive strategy yielded recall and precision of: 0.51 and 0.62. A possible explanation for this phenomenon is the fact that the high precision classi�er may only classify a very speci�c sample of documents. The addition of these documents labelled by the high precision classi�er to the initial data set of the models could be biasing the classi�er towards learning very speci�c rules, which may negatively impact on recall, but may boost precision.
The
GST method does not su�er from a decrease in recall. A possible explanation could be the high precision classi�er is being used with a di�erent purpose within GST when compared to the �(LD+RC)� learners. In the GST strategy a high precision classi�er is used to supervise the classi�cations of a standard base learner with the goal of avoiding very obvious mistakes. In the �(LD+RC)� learners the rules are used to add more labelled data to the training set available to the learners. These are two di�erent uses of the high precision classi�er and our experiments clearly provide evidence towards the advantage of our proposal. In e�ect, GST
CHAPTER 5.
DIRECT SPEECH ANALYSIS
117
Manually Labelled
Quote Classi�cation Strategy
Manually Labelled
0.03±0.41
Contextual Strategy GST
0.03
±0.34
-0.07±0.61
Table 5.6: Results for single day's news value.
improvement in precision is not o�set by a drop in recall.
5.4.1 Single news value strategy evaluation As stated on page 99 the aim of the quote classi�cation strategies was to produce a single value. The aim of this evaluation was to ensure that a day's worth of classi�ed quotes produce a similar value to a manually annotated day's worth of quotes. The evaluation used a company speci�c ontology news retrieval system (see page 63) to recommend news for �Microsoft� for the date 20-06-2009, which was randomly selected for the evaluation. The news retrieval system recommended 64 news stories. The quotes were extracted from each news story, and were hand scored. There were in total 289 quotes. A value of 1 was assigned to a positive quote, 0 to a neutral quote and -1 to a negative quote. A mean quote news value was calculated for the day. Both strategies were used. The results are documented in Table 5.6. The manually labelled quotes indicate that the day was marginally �positive�. The contextual quote classi�cation strategy also returned the same value as the mean manually labelled value, but the standard deviation was di�erent.
GST returned a
marginally negative average document score. The selected day was broadly neutral, therefore a large number of the quotes were labelled with a value of 0.
It was possible that the strategies may have achieved these scores by
chance, for example, a strategy would have achieved a similar score if it had marked half the documents as negative and the other half as positive. In this example, the average score would have been near to zero which would have been close to the hand labelled score, but with a small number of quotes' sentiment direction being estimated correctly. A complimentary evaluation was conducted where the accuracy of the sentiment direction estimation was measured.
In this circumstance accuracy is a number expressed as a percentage of the
manually labelled quotes estimated correctly by the contextual strategy and GST. The results are documented in Table 5.7.
The results re�ect the di�erence in single day's news value
with the contextual strategy achieving a signi�cantly higher accuracy than GST.
CHAPTER 5.
DIRECT SPEECH ANALYSIS
118
Strategy
Accuracy (%)
Contextual
81.31%
GST
56.05%
Table 5.7: Accuracy for a single day's quotes.
5.5 Summary This chapter presented work which was intended to classify direct speech reported in the mass media. Direct speech is a di�cult domain to work with because of the linguistic complexity of direct speech and the lack of labelled data. GST and the contextual strategy were speci�cally designed to classify direct speech, however GST can be used as a general strategy to classify texts in domains with small amounts of labelled data. The two approaches are novel classi�cations strategies and are a contribution of the thesis to the �eld of sentiment analysis. The contextual strategy is a novel contribution because it uses speaker motivation and its e�ect upon the speaker's lexicon to classify text. The research literature contains a small number of works which have attempted to classify direct speech, and these works did not consider speaker motivation in their classi�cation approach.
In
addition, the approach separated the speakers by motivation and applied separate labelling and classi�cation strategies.
This part of the strategy seems to be unique in the �eld of
sentiment classi�cation. GST is a novel contribution to the �eld of semi-supervised learning with soft constraints. The novelty of this strategy is that it generates its soft constraints from the labelled data which are then expanded with linguistic resources such as WordNet. The articles discovered in the research literature use soft constraints from outside of the data and are typically based upon �common knowledge�. The advantage of GST is that allows a human to be ignorant about the domain he is working with, but still be able to use soft constraints. The strategies presented on this chapter used either: 1. small manually labelled data sets or 2. fully labelled substitute domains to evaluate each strategy. In these evaluations the proposed strategies had an advantage over the competing ones, but these advantages may not necessarily translate into a trading advantage. The experiments will be evaluated for any trading advantage later on in thesis. The work presented in this chapter does indicate that in the direct speech domain that these proposed strategies have a measurable advantage over competing strategies.
Chapter 6
System Experiments The thesis thus far has described the individual parts of the system. The individual parts have included: web crawling, text extraction, information retrieval and text classi�cation. At each stage the component part of the system has been evaluated. The evaluation presented so far has not considered the impact of each part of the system upon trading. This chapter presents two trading evaluations :
1.
the sentence, document and quote classi�cation strategies
presented in Chapters 4 and 5, and 2. the complete system. The evaluation of the classi�cation strategies used a market index (FTSE250) to compare the returns (points di�erence) of each classi�cation strategy. In addition to comparing each classi�cation strategy the evaluation allowed the selection of one classi�cation strategy at the: 1. sentence, 2. document and 3. quote levels to use in the complete system evaluation. The complete system was the following: 1.
an information retrieval strategy (IRS) which
selected news stories for a speci�c company, and 2. a classi�cation strategy which classi�ed the news stories selected by the IRS. The values garnered in step two were then added as feature(s) to an existing stock trading system, which then used the information to trade with the goal of checking the impact of this extra information on the results of the system. The layout of the chapter will initially concentrate upon the trading evaluation of each individual classi�cation strategy and their associated variants. The trading evaluation will explain the experimental set-up, and the associated con�gurations. The experiments which use a Naive Bayes classi�er will present the results by classi�er con�dence.
This was to
demonstrate the e�ect, if any, of classi�er con�dence on the trading results. The chapter will then concentrate on the company speci�c trading experiments.
The hy-
pothesis of this thesis was that adding news features to a standard quotes only trading system would improve its performance. To test this hypothesis the evaluation compared the stock trading system's performance with technical indicators and technical indicators with news feature(s). In addition, the two competing information retrieval systems documented
119
CHAPTER 6.
SYSTEM EXPERIMENTS
in Chapter 3 were evaluated.
120
Finally the evaluation considered varying combinations of
classi�cations strategies. The chapter will then summarize the experiments and draw a brief conclusion.
6.1 Classi�cation strategies trading evaluation The evaluation of the classi�cation strategies was designed to show their ability to trade successfully.
A decision was made to use a market index because a market index value
incorporates all known information (including news information) in its value.
A further
decision was made to classify news stories published when the market was closed and trade when the market opens the next day, consequently the market would only react to these news stories when it opened. The di�erence may be re�ected in the closing value which is on the same day as market opening. To improve our chances of detecting this reaction a market
1
index needed to be chosen where there was minimal pre-market trading. Pre-market trading
is trading when the market is closed. These trades are executed as the market opens, and the impact of the news is often re�ected in the market opening price. In the trading data available the FTSE 250 had minimal pre-market trading and therefore was chosen for the evaluation. There was one evaluation measure, points di�erence. Market values are measured in points. Points di�erence is the di�erence between market opening and market closing values. In the evaluation this value is the absolute value of the points di�erence. It is added or subtracted if a trade was executed correctly, therefore a strategy which returned a positive points di�erence could be deemed as being pro�table whilst a negative value indicates a strategy had returned a loss. The competing strategies were evaluated using a Monte Carlo Simulation. A Monte Carlo simulation involved splitting of the time which was covered by the news story corpus into 20 randomly selected divisions of 400 contiguous days. News stories published in the �rst 250 days of randomly selected block of time were used as �training data� and news stories which were published in the last 150 days were used as �testing data�. The three competing classi�cation strategies were compared in terms of their ability to correctly drive the trading decisions. Trading decisions for each of the days in the testing periods are made before the market opens and are based on the outcome of the application of one of the three alternative classi�cation strategies to the news of the previous day. Namely, each of the strategies is used to derive a single aggregate value for these news that will guide the decision on which trading action to carry out. If the aggregated score is higher than zero a buy order to open a long position is issued to be carried out when the market opens. If the aggregated score is below zero a sell order is issued to open a short position. Both positions will be closed at the end of the day, with the di�erence between the closing and opening
1
See http://en.wikipedia.org/wiki/Extended_hours_trading.
CHAPTER 6.
SYSTEM EXPERIMENTS
121
prices in that day determining the points di�erence associated with the position. The three classi�cation strategies belong to two types of approaches to text classi�cation. The sentence level method is a purely linguistic strategy, while the document and quote methods are based on supervised learning algorithms that require a set of labelled examples (in one case documents and in the other quotes). These two di�erent approaches have an impact on how the respective classi�ers use the available training data. An overview of the process followed on each of the 20 random train+test divisions is presented in Figure 6.1. The sentence level strategy uses the training data to construct linguistic resources such as dictionaries.
The document and quote level strategies use the training data to obtain a
labelled training set that is then used to train a Naive Bayes classi�er. On each day in the test period a trading decision is made based on the outcome of the classi�cation strategies. This outcome is an aggregated score of the news of the previous day. The way this aggregated score is obtained is di�erent for the three strategies. The sentence level classi�er proceeds as follows:
1. Split the news stories of the previous day into sentences. 2. Use the linguistic rules derived from the training data to assign a score to each of these sentences. 3. Sum up the scores of the sentences to obtain the aggregated score value.
The document level and quote classi�ers use the following strategy:
1. Transform the news stories into testing instances. In the case of document level each story originates a single instance using the bag of words representation. For the quotes classi�er the stories are searched for quotes and each of these is transformed into a testing instance again using a bag of words representation. 2. Use the classi�cation models learnt from the training data to obtain the set of probabilities of each instance belonging to the classes: negative, neutral or positive. 3. Decide the classi�cation of each instance using the set of probabilities and a userde�ned parameter that sets the minimum con�dence required for this decision.
For
each instance if the class with highest probability is above this minimum con�dence value the instance is given that class, otherwise the instance is not classi�ed (i.e. the classi�er abdicates). 4. Map the assigned class into a numeric score according to some user-de�ned function (e.g. negative into -1, neutral into 0 and positive into 1). 5. Sum up the scores of all classi�ed instances to obtain the aggregated score value.
CHAPTER 6.
SYSTEM EXPERIMENTS
122
Figure 6.1: An overview of classi�cation strategies.
6.1.1 Sensitivity analysis of the inductive classi�ers The use of the supervised learning algorithms (document level and quotes) requires several decisions to be made. In this section we study the impact on the results of using di�erent values for these decisions. Namely, we explore: 1. di�erent alternatives for constructing the labelled training set, 2. di�erent values for the minimum required con�dence of classi�cations and 3. classifying di�erent parts of a news story, which in this circumstance was story text and story headings (headlines). The di�erent strategies considered for obtaining the labelled training sets were fully described in Chapters 4 and 5. In this sensitivity study the following alternatives were considered:
Ev - labels are obtained by using event rules. Ma - labels are obtained by using market alignment. MaEv - labels are obtained by using market alignment and event rules. MaSe - labels are obtained by using market alignment and sentiment rules. MaSeEv - labels are obtained by using market alignment with sentiment and event rules. MaEvSt - labels are obtained by using market alignment with event rules and self-training.
MaSeEvSt - labels are obtained by using market alignment with sentiment, event rules and selftraining. Se - labels are obtained by using sentiment rules. SeEv - labels are obtained by using sentiment and event rules.
CHAPTER 6.
SYSTEM EXPERIMENTS
123
The sensitivity of the classi�er con�dence parameter was evaluated.
The results for the
document level strategies are documented in Figure 6.2. The relationship between classi�er con�dence and points di�erence seems unclear as there is no consistent increase or decrease in points value as classi�er con�dence increases.
Text
Headings
MaSeEvSt
Se
SeEv
MaSe
MaSeEv
MaEvSt
300 200 100 0 −100 −200
Points Difference
300 200 100 0 −100 −200
Ev
Ma
MaEv
300 200 100 0 −100
1
9
8
0.
7
0.
6
0.
5
0.
0.
1
9 0.
8
7
0.
0.
6
5
0.
0.
1
9
8
0.
7
0.
6
0.
0.
0.
5
−200
Classifier Confidence
Figure 6.2: Points di�erence for di�erent classi�er con�dence levels. Ev = Event rules, Ma= Market alignment, MaEv = Market alignment with event rules, MaSe = Market alignment with sentiment rules, MaSeEv = Market alignment with sentiment and event rules, MaEvSt = Market alignment with event rules and self-training, MaSeEvSt = Market alignment with sentiment, event rules and self-training, Se = Sentiment rules and SeEv = Sentiment and event rules. The e�ect of classi�er con�dence on trading returns (points di�erence) on quote classi�cation
CHAPTER 6.
SYSTEM EXPERIMENTS
124
strategies is documented in Figure 6.3. In common with the document level strategies the relationship between classi�er con�dence and points di�erence is unclear.
Quotes Bi
GST 300
200
100
Points Difference
0
−100
Ub
UbBi
300
200
100
0
1
9 0.
8 0.
7 0.
6 0.
5 0.
1
9 0.
8 0.
7 0.
6 0.
0.
5
−100
Classifier Confidence
Figure
6.3:
Points
di�erence
for
di�erent
classi�er
con�dence
levels
for
quote
level
classi�cations. Ub= Contextual strategy, members of unbiased group, UbBi = Contextual strategy, members of unbiased and groups, Bi=Contextual strategy, members of biased group, GST = Guided self-training.
In summary, although the graphs show some variations in points di�erence for each parameter tested, it was not possible to identify consistent relationship between a parameter and points di�erence.
CHAPTER 6.
SYSTEM EXPERIMENTS
125
6.1.2 Sentence level evaluation The sentence level strategies were evaluated with the methodology described earlier. Sentence level strategies are linguistic and therefore do not have a classi�er con�dence. The evaluation used the same 20 divisions for the Monte Carlo simulation as per the previous experiments. The training part of the division was used to construct linguistic resources. The di�erence between the linguistic and inductive strategies in this evaluation is described in Figure 6.1. The evaluation, again, was by points di�erence. The results are documented in Table 6.1. The results demonstrate that the use of both sentiment and event rules outperformed the individual use of sentiment or event rules. Strategy
Text
Points Di�erence
Event
ST.
Event
Head.
Sent.
ST.
Sent.
Head.
Sent. & Event
ST.
Sent. & Event
Head.
±315.02 299.04±262.09 -421.13 ±607.05 -143.71±346.40 719.74 ±419.29 341.63 ±489.41 73.78
Table 6.1: Sent.= sentiment, ST. = story text and Head.= headline.
6.2 Full system trading evaluation A full system is a combination of the constituent parts which have been described in the preceding chapters.
A full system therefore performs the following steps:
1.
scrape and
extract news from the web, 2. select and score news stories for a speci�c company or market index, 3. classify a series of news stories at either the: document, quote or sentence level and 4. calculate a value for a day's news stories. This section will describe a series of experiments which evaluated a number of variations of the full system. The full system was compared to a baseline stock trading system inspired in some of the ideas of the system described in Torgo [2010]. Namely, the baseline system is based on predictive models trained to forecast the future daily returns at some time horizon (the experiments considered 1, 3, 5 and 10 days ahead). The predictive models considered as predictors several technical indicators that can be calculated with the past prices. Concretely, the following variables were used as predictors of the forecasting models:
•
ATR - is an average true range which is a Welles Wilder' style moving average of the true range [FMLabs, 2012b].
CHAPTER 6.
•
SYSTEM EXPERIMENTS
126
SMI - is a stochastic oscillator which is a momentum indicator that relates the location of each day's close relative to the high/low range over the past `n' periods [FMLabs, 2012j].
•
ADX - is a directional movement index which is a moving average of the directional movement index [FMLabs, 2012a].
•
Aroon - is an indicator which attempts to identify the start of trends [FMLabs, 2012c].
•
Bollinger bands - is an indicator which compares a security's volatility over time [FMLabs, 2012d].
•
Chaikin volatility - is the rate of change of the trading range FMLabs [2012e].
•
Close Location value - is an indicator which relates the day's close to its trading range [StockCharts.com, 2012].
•
Ease of movement value - is an indicator which emphasizes the days where the security moves easily and minimizes the days where the security does not move easily [FMLabs, 2012f].
•
MACD - is an indicator which is a price oscillator [FMLabs, 2012g].
•
MFI - is a ratio of positive and negative money �ow over time [FMLabs, 2012h].
•
SAR - is a Parabolic Stop-and-Reverse which calculates a trailing stop [FMLabs, 2012i]
•
Volatility - this was a variety of volatility indicators: Close-to-Close,OHLC Volatility, and High-Low Volatility. [Sitmo, 2012]
Several learning algorithms were considered to obtain forecasting models using the set up described above.
Moreover, for each of these learning algorithms a large set of parameter
variants was also considered in the experiments. The learning algorithms were:
•
Support vector machines (SVM) as implemented in the R package
e1071 [Dimitriadou,
Hornik, Leisch, Meyer, and Weingessel, 2011].
•
Multivariate adaptive regression splines (MARS) as implemented in the R package
earth [Hastie and Tibshirani., 2011]. •
Arti�cial neural networks (NN) using the implementation available in the R package
nnet [Venables and Ripley, 2002]. randomForest [Breiman, 2001].
•
Random forest (RFs) as implemented in the R package
•
Regression trees (RTs) as implemented in the R package son., 2012].
rpart [Therneau and Atkin-
CHAPTER 6.
SYSTEM EXPERIMENTS
127
The overall goal of the these experiments was to test its initial hypothesis, which was: adding information from past news stories will improve the predictive performance of an existing stock trading system.
With that purpose several experiments were designed where extra
features resulting from the text mining strategies described in the previous chapters, were added to the technical features. The experiments used 4 companies:
1.
Microsoft, 2.
Apple, 3.
Google and 4.
IBM to
evaluate the system. The four companies were chosen because 1. they were relatively well represented in the news corpus and consequently it was possible to use the information retrieval techniques to select related news stories and 2. not biased to a single company.
to ensure that any results were
The evaluation results were an average of the combined
results returned by all of the companies.
The systems were compared using the following
measures: 1. F-measure, 2. sell returns and 3. buy returns. These evaluation measures were chosen because company share prices are quoted in currency (pounds, dollars, etc) whereas the market indexes used in the previous experiments are measured in points.
6.2.1 Selection of strategies for full system testing It was not possible to test every variation of each classi�cation and information retrieval strategy on the full system evaluation. A decision was made to select the best classi�cation strategy for each �level� (sentence, document and quote) of the news story. The best sentence level strategy was determined to be the strategy which returned the highest points di�erence in the previous experiments. The quote and document level strategies could be con�gured by classi�er con�dence, consequently a decision was taken to select a strategy for each level which had the highest mean points di�erence. The three chosen strategies for the full system evaluation were:
•
Sentence level, event and sentiment rules which classi�ed news story text.
•
Document level, self-train which used event & sentiment rules to classify news headings (headlines).
•
Quote level, contextual strategy which classi�ed direct speech from members of the unbiased group.
6.2.2 Experimental Setup The stock trading system relies upon the construction of models from features, and therefore requires training and evaluation data.
There was limited news data available because the
news corpus contained stories published between October 2008 and April 2011. News stories which were published on weekends and holidays could not be used because the �nancial
CHAPTER 6.
SYSTEM EXPERIMENTS
128
markets were closed. The split selected was 300 days for training and 100 days for evaluation. The experiments were repeated 20 times with di�ering selections of dates from the training and evaluation data in a process known as Monte Carlo Simulations which is a process intended to eliminate bias from the results. The selected classi�cation strategies had access to news data published between October 2008 and July 2010 to construct models or linguistic resources. The existing stock system calculates separate evaluation results with a number of individual models. It was not possible to run all the experiments with all of the possible learners. A decision was made to select the three �best� learners to use in the experiments. A baseline experiment was made where technical indicators were used as the only features. The baseline experiment used data between October 2008 and April 2011 with share price information from �Microsoft�, �Apple�, �IBM� and �Google�. The stock system ranked the learners from each experiment. A mean rank was taken for each learner, and the learners with the lowest mean rank were selected for the experiments. The selected learners were a selection of SVMs and a MARS learner. The experiments were carried out on 4 separate trading horizons: 1,3,5 and 10 days ahead. The trading horizon indicated how many days in the future a position would be closed , for example 10 days ahead would indicate that a position would be closed 10 days after the original trade. The variation of trading horizons was to identify if news e�ected stock prices for more than one day. The experiments used the models generated from the baseline technical indicators (see page 125) as well as features extracted from news information. News information is: 1. sentences from news text, 2. quotes extracted from news text and 3. complete news stories. A news information feature is a separate daily score computed for: sentences, quotes or news stories. A daily score was computed for 1. sentences by aggregating the scores of individual sentences, 2. quotes by aggregating the scores of individual quotes and 3. news stories by aggregating scores of the individual news stories published in a single day which were selected for a speci�c company (�Microsoft�, �Apple�, �IBM� or �Google�). The news features were combined with the models in the following manner: 1. a single news feature (sentence, quote or news story), 2. two news features (sentence and quote, quote and news story or news story and sentence) or 3. three news features (sentence, quote and news story).
6.2.3 Results This subsection will present results in three parts:
comparison of information retrieval
strategies, comparison of combinations of news information features and comparison of information retrieval and news information features with baseline system which uses technical indicators only. The evaluation metrics used for the experiments were: 1. F-measure, 2. buy
CHAPTER 6.
SYSTEM EXPERIMENTS
129
returns and 3. sell returns. The comparison of information retrieval system experiments were designed to identify the in�uence of a speci�c information retrieval system (company or industry ontology) on the evaluation metrics, consequently the experiments used an average of the evaluation metrics for all possible experiments grouped by information retrieval strategy. An average was chosen because it was the information retrieval strategy that was evaluated rather than individual combinations of news features and information retrieval strategy. The combination of news features experiments were designed to identify the in�uence of using 1, 2 or 3 news features in combination with the technical indicator features irrespective of the information retrieval strategy. The experiments used an average of the evaluation metrics for experiments which used either 1,2 or 3 news information, consequently for each trading horizon there were three results. The �nal experiments compared a baseline of technical indicators against all possible combinations of news information features and information retrieval strategies.
The results
were an average of the evaluation metrics for the experiments conducted for each company (�Microsoft�, �Apple�, �IBM� or �Google�). An average was chosen to ensure that the results were not biased towards an individual company.
Comparison of Information Retrieval Strategies The information retrieval evaluation tested the in�uence of the company and industry ontologies information retrieval strategies upon the trading results. The results are in Table 6.2. The results demonstrate that the news story classi�cation strategies which used the Industry ontology to recommend news stories had superior results at trading horizons 3 and 10 days for buy returns, and trading horizons 3,5 and 10 days for F-measure. The superiority, however, was within the standard deviation. In summary, the in�uence of the information retrieval strategies on the evaluation measures was negligible.
News Feature Combination The news feature combination evaluation tested the e�ect of having 1, 2 or 3 news features created with separate news classi�cation strategies in combination with technical indicator features. The results are displayed in Table 6.3. There are negligible di�erences between the number of news features and the evaluation measures.
CHAPTER 6.
SYSTEM EXPERIMENTS
130
IRS
Trading Horizon
F-measure
Buy Return
Sell Return
Company
1
0.02±0.03
0.00±0.00
0.00±0.00
Industry
1
0.02±0.03
0.00±0.00
0.00±0.00
Company
3
0.20±0.09
0.06±0.05
0.00±0.01
Industry
3
0.25±0.09
0.09±0.07
0.00±0.01
Company
5
0.31±0.09
0.07±0.06
-0.01±0.02
Industry
5
0.33±0.08
0.07±0.06
-0.01±0.02
Company
10
0.30±0.07
0.07±0.06
-0.01±0.02
Industry
10
0.32±0.10
0.08±0.09
0.00±0.03
Table 6.2: Comparison of Information Retrieval Strategies.
IRS = Information Retrieval
Strategies.
Evaluation against baseline This evaluation compares the results of adding news feature and combination of news features to the baseline of using technical indicator features.
The evaluation separated the news
features by information retrieval strategy and trading horizon (1,3,5 and 10 days). The results for trading horizon 1 day ahead are displayed in Table 6.4.There were a number of experiments which used news features which returned a F-measure score, but the score was marginally above 0. There was no experiment which used news features which scored signi�cantly higher than the baseline.
CHAPTER 6.
SYSTEM EXPERIMENTS
NNS
Trading Horizon
1
1
0.02
2
1
0.02
3
1
0.02
1
3
0.23
2
3
0.22
3
3
0.22
1
5
0.32
2
5
0.33
3
5
0.32
1
10
0.30
2
10
0.31
3
10
0.31
131
F-measure
Buy Return
±0.03 ±0.03 ±0.04
0.00
±0.09 ±0.10 ±0.08
0.08
±0.09 ±0.09 ±0.09
0.07
±0.08 ±0.09 ±0.09
0.08
0.00 0.00
0.07 0.07
0.08 0.07
0.08 0.08
Sell Return
±0.00 ±0.01 ±0.01
0.00
±0.06 ±0.06 ±0.05
0.00
±0.06 ±0.07 ±0.07
±0.01 0.00 ±0.01 -0.01 ±0.02
±0.09 ±0.09 ±0.10
0.00
0.00 0.00
0.00 0.00
±0.00 ±0.00 ±0.01 ±0.01 ±0.01 ±0.01
0.00
0.00 0.00
±0.03 ±0.03 ±0.04
Table 6.3: Comparison of Combinations of news features. NNS = number of news features.
CHAPTER 6.
SYSTEM EXPERIMENTS
132
Features
I.R.
F-measure
Buy Return
TI
NA
0.00±0.00
0.00±0.00
0.00±0.00
TI + Qu.
Comp.
0.00±0.00
0.00±0.00
0.00±0.00
TI + Qu.
Ind.
0.02±0.04
0.00±0.01
0.00±0.00
TI + Ru.
Comp.
0.02±0.04
0.00±0.01
0.00±0.00
TI + Ru.
Ind.
0.02±0.03
0.00±0.01
0.00±0.00
TI + St.
Comp.
0.02±0.04
0.00±0.01
0.00±0.00
TI + St.
Ind.
0.02±0.03
0.00±0.01
0.00±0.00
TI + Qu.+ Ru.
Comp.
0.02±0.04
0.00±0.01
0.00±0.01
TI + Qu.+ Ru.
Ind.
0.02±0.03
0.00±0.01
0.00±0.00
TI + Qu.+ St.
Comp.
0.02±0.04
0.00±0.01
0.00±0.01
TI + Qu.+ St.
Ind.
0.02±0.04
0.00±0.01
0.00±0.00
TI+ Ru.+ St.
Comp.
0.02
TI+ Ru.+ St.
Ind.
0.02
TI+ Ru+ St. Qu.
Comp.
0.02
TI+ Ru+ St. Qu.
Ind.
0.02
Table 6.4:
±0.04 ±0.04
0.00
±0.04 ±0.04
0.00
0.00
0.00
Sell Return
±0.01 ±0.01
0.00
±0.01 ±0.01
0.00
0.00
0.00
±0.01 ±0.01 ±0.01 ±0.01
Comparison of results for full system trading horizon 1 day.
indicators, Ru.=Rules, Qu.
= quotes, ST. = self-training, Comp.
TI= technical
= Company Ontology
and Ind. = Industry Ontology.
The trading results for trading horizon 3 days are presented in Table 6.5. There were a number of experiments which returned higher F-measures and Buy Returns than the baseline, but the di�erence was within the standard deviation for the experiment. In summary, there was a negligible di�erence between the baseline and experiments which used news features. The trading results for trading horizon 5 days are presented in Table 6.6. There were a number of experiments which returned higher F-measures and Buy Returns than the baseline, but the di�erence was within the standard deviation for the experiment. In summary, there was a negligible di�erence between the baseline and experiments which used news features. The trading results for trading horizon 10 days are presented in Table 6.7.
There were a
number of experiments which returned higher F-measures and Buy Returns than the baseline, but the di�erence was within the standard deviation for the experiment. In summary, there was a negligible di�erence between the baseline and experiments which used news features. In summary, there was no demonstrable advantage for the experiments which used news feature(s) and technical indicators over the baseline which used only technical indicators. There were some experiments which outperformed the baseline, but the gain were within the standard deviation of the experiment.
CHAPTER 6.
SYSTEM EXPERIMENTS
133
Features
I.R.
F-measure
Buy Return
TI
NA
0.23
±0.10
0.08
±0.07
0.00±0.01
TI+ Qu.
Comp.
0.20
0.05
Ind.
0.25
±0.04 ±0.07
0.00
TI+ Qu.
±0.05 ±0.09
TI+ Ru.
Comp.
0.20
0.07
Ind.
0.27
±0.06 0.10±0.11
0.00
TI+ Ru.
±0.13 ±0.12
TI+ St.
Comp.
0.23
0.07
Ind.
0.25
±0.06 ±0.05
0.00
TI+ St.
±0.08 ±0.07
TI+ Qu.+ Ru.
Comp.
0.20
0.07
Ind.
0.27
±0.06 ±0.10
0.00
TI+ Qu.+ Ru.
±0.15 ±0.13
TI+ Qu.+ St.
Comp.
0.19
0.05
Ind.
0.25
±0.04 ±0.06
0.00
TI+ Qu.+ St.
±0.07 ±0.09
TI+ Ru.+ St.
Comp.
0.22
0.06
Ind.
0.23
±0.05 ±0.06
0.00
TI+ Ru.+ St.
±0.08 ±0.08
TI+ Ru+ St. Qu.
Comp.
0.17
0.05
Ind.
0.26
±0.05 ±0.07
0.00
TI+ Ru+ St. Qu.
±0.11 ±0.10
0.08
0.07
0.11
0.08
0.08
0.08
Sell Return
0.00
0.00
±0.01 ±0.02 ±0.01 ±0.00
±0.01 -0.01 ±0.01 ±0.01 -0.01 ±0.01 ±0.01 -0.01 ±0.01 0.00
±0.01 ±0.01
±0.01 -0.01 ±0.01
Table 6.5: Comparison of the results for full system trading horizon 3 days. TI= technical indicators, Ru.= Rules ,Qu. = quotes, ST. = self-training, Comp. = Company Ontology and Ind. = Industry Ontology.
6.3 Discussion of results This chapter has used trading to evaluate individual news classi�cation strategies as well as the full system which used the news classi�cation and the information retrieval strategies. The news classi�cation strategies were evaluated by points di�erence. A sensitivity experiment was conducted to evaluate the in�uence of classi�er con�dence upon points di�erence. The results were inconclusive. Three news classi�cation strategies which scored the highest points di�erence were selected for each level (quote, sentence and story) to use in the full system experiment. The full system evaluation used the three selected classi�cation measures in conjunction with the information retrieval strategies to classify news for speci�c companies (Apple, IBM, GOOGLE and Microsoft) and add this information as news based features. The news classi�cation strategies output was added either as a single feature or in conjunction with the remaining classi�cation strategies to produce two or three extra features. These features were added to an existing stock trading system which used technical indicators as features. The evaluation measures were 1. percentage sell returns, 2. percentage buy returns and 3. F-measure.
CHAPTER 6.
SYSTEM EXPERIMENTS
134
Features
I.R.
F-measure
TI
NA
0.31
TI+ Qu.
Comp.
0.32
TI+ Qu.
Ind.
0.33
TI+ Ru.
Comp.
0.31
TI+ Ru.
Ind.
0.33
TI+ St.
Comp.
0.31
TI+ St.
Ind.
0.32
TI+ Qu.+ Ru.
Comp.
0.28
TI+ Qu.+ Ru.
Ind.
0.35
TI+ Qu.+ St.
Comp.
0.32
TI+ Qu.+ St.
Ind.
0.34
TI+ Ru.+ St.
Comp.
0.32
TI+ Ru.+ St.
Ind.
0.32
TI+ Ru+ St. Qu.
Comp.
0.34
TI+ Ru+ St. Qu.
Ind.
0.34
Table 6.6:
Buy Return
Sell Return
±0.10
0.06±0.06
0.00
±0.10 ±0.08
0.07
±0.09 ±0.09
0.06
±0.10 ±0.08
0.07
±0.10 ±0.09
0.07
±0.09 ±0.08
0.07
±0.09 ±0.09
0.07
±0.11 ±0.08
0.09
±0.02
±0.07 ±0.07
-0.01
±0.06 ±0.07
0.00
±0.07 ±0.07
0.00
±0.07 0.09±0.08
0.00
0.08
0.07
0.07
0.08
0.07
0.09
-0.01
±0.02 ±0.01
±0.02 -0.01 ±0.02 ±0.01 -0.02 ±0.02 ±0.01 -0.01 ±0.02
±0.07 ±0.08
-0.01
±0.07 ±0.07
-0.01
±0.07 ±0.08
-0.01
-0.01
-0.01
-0.01
±0.02 ±0.02 ±0.02 ±0.02 ±0.02 ±0.01
Comparison of results for full system trading horizon 5 days.
TI= technical
indicators, Ru.=Rules, Qu. = quotes, ST. = self-training, Comp. = Company Ontology and Ind. = Industry Ontology.
The full system evaluation tested the in�uence of: 1. information retrieval strategies and 2. addition of news features (1,2 or 3). The experiments revealed a small di�erence between the information retrieval strategies, but this di�erence was less than the standard deviation for the experiment.
There was a small di�erence between experiments which used 1,2 or
3 additional news features, but the di�erence was within the standard deviation for the experiment. The �nal experiment evaluated each possible combination of technical indicator, news features and information retrieval strategy against a baseline which used only technical indicators. There were some combinations which outperformed the baseline, but the di�erence was within the standard deviation for the experiment. In summary, there was some weak evidence for features derived from news improving a stock prediction system which only used technical indicators. The evidence was inconsistent and demonstrated gains which were within the standard deviation.
CHAPTER 6.
SYSTEM EXPERIMENTS
Features
135
Model
F-measure
NA
0.30
±0.07
0.08
±0.09
0.00
TI+ Qu.
Comp.
0.29
0.08
Ind.
0.31
±0.09 ±0.11
0.00
TI+ Qu.
±0.07 ±0.13
TI+ Ru.
Comp.
0.29
0.08
Ind.
0.30
±0.09 ±0.09
0.00
TI+ Ru.
±0.07 ±0.07
TI+ St.
Comp.
0.29
0.08
Ind.
0.30
±0.09 ±0.09
0.00
TI+ St.
±0.08 ±0.08
TI+ Qu.+ Ru.
Comp.
0.30
0.08
Ind.
0.34
±0.09 ±0.10
0.00
TI+ Qu.+ Ru.
±0.08 ±0.12
TI+ Qu.+ St.
Comp.
0.29
0.08
Ind.
0.33
±0.09 ±0.10
0.00
TI+ Qu.+ St.
±0.08 ±0.13
TI+ Ru.+ St.
Comp.
0.30
0.08
Ind.
0.32
±0.09 ±0.10
0.00
TI+ Ru.+ St.
±0.08 ±0.10
TI+ Ru+ St. Qu.
Comp.
0.29
0.08
Ind.
0.32
±0.09 ±0.10
0.00
TI+ Ru+ St. Qu.
±0.08 ±0.11
TI
Table 6.7:
Buy Return
0.08
0.08
0.08
0.09
0.09
0.09
0.08
Sell Return
±0.03
±0.03 -0.01 ±0.03 0.00
0.00
±0.03 ±0.03 ±0.03 ±0.03
±0.03 -0.01 ±0.03 0.00
±0.04 ±0.04
±0.04 -0.01 ±0.03 ±0.04 -0.01 ±0.02
Comparison of results for full system trading horizon 10 days.
TI= technical
indicators, Ru.= Rules, Qu. = quotes, ST. = self-training, Comp. = Company Ontology and Ind. = Industry Ontology.
Chapter 7
Conclusion This chapter will discuss the contributions presented in this thesis and the direction of future work as well as a conclusion for the thesis. The contributions will be discussed in general terms rather than the speci�c claims presented in Chapter 1.
7.1 Discussion of Thesis This thesis has documented a project which attempted to use news features to improve an existing stock trading system. The overall aim of this project was not realized because the news features did not aid the existing stock trading system. only motive of the project.
This aim was not the
There were other motives which sought to make advances in
the constituent parts of the complete system. The thesis when compared to the secondary motivations was successful as there were demonstrable advances in: 1. ontology engineering, 2. semi-supervised learning, 3. news classi�cation and 4. information retrieval. The advances in ontology engineering represent a signi�cant advance in modelling a volatile data source. The related work demonstrated that there were no signi�cant works in this area. Furthermore, a number of works suggested that a volatile ontology was an indication of a poor construction or maintenance strategy. This assumption in a volatile domain is false. A �perfect� ontology which is derived from a domain which contains facts which are transitory will be itself volatile. The advance presented in this thesis allows the automatic construction and maintenance of an ontology generated from news stories. The ontology generated from news was used in the information retrieval variation.
The
uniqueness of this variation was that it used the structure of the ontology to rank and score news stories. Ontologies in information retrieval are typically used as a form of query expansion. The indexing of a news story is typically undertaken by a separate process which uses statistical measures.
Statistical measures such as term frequency inverse document
136
CHAPTER 7.
CONCLUSION
137
frequency (TF-IDF) ignore the semantic relationship between terms, therefore statistical relationships between terms may occur by chance. An information retrieval system which uses an indexing strategy which discovers semantic relationships between terms may be more accurate than a statistical system because a semantic relationship between terms has an underlying cause.
The advance in information retrieval also used the concept of distance
between terms, i.e. the greater the distance between two terms the weaker the relationship. Distance allows the discovery of related terms which never co-occur.
The relationship is
inferred through the interconnection in the ontology. The news classi�cation strategies provided two general advances: constraints from labelled data and 2.
1.
generation of soft
identi�cation of speaker groups to assist sentiment
classi�cation. These advances were discovered for the classi�cation of direct speech. Direct speech has some speci�c problems for sentiment classi�cation which include: non-standard grammar, invented words and di�ering motivations for speakers. Classical sentiment classi�cation techniques were not suitable. The use of soft constraints from labelled data and their expansion with lexical resources allows a person to generate soft constraints in a domain of which he is ignorant. This di�ers from traditional strategies which typically generate soft constraints from common knowledge or from resources outside of the domain. The second advance used the motivation of speakers to assist a classi�cation strategy. The assumption was that di�ering groups of speakers had di�ering motivations for speaking, which maybe susceptible to di�erent sentiment classi�cation techniques. The classi�cation strategy used a combination of semantic and sentiment techniques to classify direct speech. The work conducted for this thesis revealed problems for evaluating classi�cation techniques. The approach chosen for this thesis was to hand label small gold standards against which the classi�cation techniques were tested by an estimated F-measure. The weakness of small labelled sets is that they do not represent the whole collection of texts, consequently a classi�cation strategy which demonstrates an advantage in one set of labelled texts may not show the same advantage in a di�erent set of labelled texts. An alternate method of trading evaluation was used to assist the gold standard evaluation. There were di�erences between the evaluations, for example, Guided Self Training (GST) gained a similar F-measure score to the contextual strategy when evaluated with a gold standard, however GST performed poorly compared to the contextual strategy in the trading evaluation.
This di�erence may have
been due to: 1. the relatively small gold standard and 2. the evaluations measured di�erent qualities of the classi�ed documents, sentences or quotes.
The gold standard rewarded a
strategy if it classi�ed a document, sentence or quote correctly, whereas the trading evaluation rewarded a strategy if it identi�ed correctly classi�ed documents, sentences or quotes which induced a movement in a market. This thesis is a signi�cant contribution to the �elds of information retrieval, ontology engineering, semi-supervised learning and news classi�cation. It provides the basis for further
CHAPTER 7.
CONCLUSION
138
investigation in the aforementioned �elds.
7.1.1 Future Work The future work will be centred around two themes: evaluation of classi�cation techniques in domains with limited labelled data and sentiment analysis with background information. The future work with evaluation seeks to compare the relative performance a candidate classi�er technique against a random classi�er. A random classi�er is hypothetically the worst type of classi�er because it assigns a text to a category based upon a random probability distribution. It is likely that the features in the text will be equally distributed amongst the categories. A candidate classi�cation strategy may demonstrate its strength or weakness by its relative distribution of features. The nearer a candidate classi�cation strategy distribution of features is to a random distribution, the weaker the aforementioned strategy. At the present time it is not clear how a score can be calculated by comparing a candidate classi�cation distribution of terms against a random distribution, but will be subject of future investigation. The second direction of the future work will concentrate upon using background information to assist sentiment classi�cation.
The work conducted for this thesis produced a domain
ontology which represents the interconnection of entities within a given area. This ontology can be used for two processes: reasoning with direct speech and ranking opinion makers for their in�uence in a given domain. We conducted some basic experiments in reasoning with a domain ontology and direct speech which used two simple rules to select quotes: 1. company against a competitor and 2.
a positive quote made by a leader of a
a negative quote made by a leader of a company
against his own company. The results are in Table 7.1. The rules were simple, but revealed some �interesting� quotations, for example the quote made by the CEO of Sony, which was sarcastic. It may be possible that with more sophisticated techniques direct speech which has more in�uence on a �nancial market could be identi�ed. Speakers have di�ering in�uences upon the �nancial market. An example of this was presented in Chapter 1 where Mervyn King stated the UK was in recession and sterling dropped in value. This sentiment of this statement had been made earlier by less in�uential speakers without any noticeable e�ect on the markets.
A possible method is to use social network
measures in a similar manner to the one used in the information retrieval section to rank speakers. The advantage of this method is that a speaker's hypothetical rank or in�uence score will change depending upon the domain. This scenario is an attempt to re�ect a real world situation where a person is more in�uential in one domain than another. For example, Bill Gates works in the education domain through the Bill and Melinda Gates foundation and the technology sector through Microsoft. It is arguable that Gates has a stronger in�uence in the technology domain that the education sector. The value assigned to a speaker could
CHAPTER 7.
CONCLUSION
139
A�liation
Quotation
Sony
he was very happy that Nokia chose Microsoft rather than Android.
Intel
Intel expects the consumer PC market to continue growing in the fourth quarter, but at a slower pace than in the �rst half of the year.
Apple
We're thrilled to be working with Verizon Wireless to get iPad into the hands of even more customers this holiday season.
Google
Microsoft is Google's top competitor, and questioned why everybody is so obsessed with Facebook and Google.
Nvidia
Manufacturers of smartphones using Google's Android operating system plan to use the Tegra chips.
Halliburton
Halliburton will comply immediately with the judge's order.
Verizon
selling 11 million iPhone this year was very doable.
Table 7.1: �Interesting� quotations derived with simple rules.
be used to increase a value assigned to a quote and therefore increasing the in�uence of the quote on the day's trading decision. The work on direct speech classi�cation presented in this thesis did not attempt to locate the subject of a quote. The classi�cation approach assumed that if the quote was selected then it had a connection to a monitored domain. It may be possible to identify the subject of a quote using �anaphora� analysis. The examples in Table 7.1 used simple �anaphora� analysis by assuming that the subject of was the �rst named entity in a sentence when read left to right. For example, in the sentence �Halliburton will comply immediately with the judge's order� the subject of the sentence was assumed to be Halliburton.
This simple approach
may not be su�ciently robust for analysing accurately a large number of sentences, and consequently a more sophisticated approach maybe required. A possible alternative to this simple �anaphora� analysis is to use a dependency tree analysis to extract a subject for a sentence.
For example, the phrase �Halliburton will comply immediately with the judge's
order� dependency tree are the following:
CHAPTER 7.
CONCLUSION
140
(ROOT (S (NP (NNP Halliburton)) (VP (MD will) (VP (VB comply) (ADVP (RB immediately)) (PP (IN with) (NP (NP (DT the) (NN judge) (POS 's)) (NN order))))))) The dependencies from this tree is:
nsubj(comply-3, Halliburton-1) aux(comply-3, will-2) root(ROOT-0, comply-3) advmod(comply-3, immediately-4) prep(comply-3, with-5) det(judge-7, the-6) poss(order-9, judge-7) possessive(judge-7, 's-8) pobj(with-5, order-9) The subject of this sentence is the dependency �nsubj(comply-3, Halliburton-1)� is the nominal subject of the sentence.
The dependency tree is a more sophisticated approach
than the rudimentary approach previously described. To summarize, future work will based around: 1. �nding an evaluation method for domains where there is no fully labelled set of data available 2. a more sophisticated version of direct speech analysis which involves accurately identifying a subject of a quote, estimating the relationship between a quote and weighting a quote based upon the in�uence of the speaker.
7.1.2 Conclusion To conclude, this thesis presents a number of advances in several areas, and in addition provides a solid basis for future investigation. The overall aim was not met, however this does not invalidate the work presented in this thesis. There are a number reasons why an advantage could not be detected in the company speci�c trading evaluation, for example, the selected companies may not be susceptible to the proposed trading techniques. Despite the overall system failing to produce a measurable gain over the baseline system, the component parts of the system represent an advance to their requisite �elds and to computer science in general.
BIBLIOGRAPHY
141
Bibliography S. Abney.
Semisupervised Learning for Computational Linguistics,
and Co-Training,
pages 13�31.
chapter Self Training
Chapman & Hall/CRC, 2007.
ISBN 1584885599,
9781584885597. airlinemeals.net. Airlinemeals, 2010.
http://www.airlinemeals.net/,
consulted in 2010.
G. Akrivas, M. Wallace, G. Andreou, G. Stamou, and S. Kollias. Context - sensitive semantic
Proceedings of IEEE International Conference on Arti�cial Intelligence Systems (ICAIS 2002), pages 109�114, Divnomorskoe, Russia, September 2002.
query expansion. In
Alias. Lingpipe 4.1.0, 2008. Blake Andrew.
http://alias-i.com/lingpipe.
Media-generated shortcuts:
Do newspaper headlines present another
roadblock for low-information rationality?
The Harvard International Journal of
Press/Politics, 12(2):24�43, 2007.
S. Auer, C. Bizer, G. Kobilarov, J. Lehmann, R. Cyganiak, and Z. Ives. Nucleus for a Web of Open Data The Semantic Web.
DBpedia:
A
In Karl Aberer, Key-Sun Choi,
Natasha Noy, Dean Allemang, Kyung-Il Lee, Lyndon Nixon, Jennifer Golbeck, Peter Mika, Diana Maynard, Riichiro Mizoguchi, Guus Schreiber, and Philippe Cudré-Mauroux,
Proceedings of 6th International Semantic Web Conference, 2nd Asian Semantic Web Conference (ISWC+ASWC 2007), volume 4825 of Lecture Notes in Computer Science, editors,
chapter 52. Springer Berlin / Heidelberg, 2007. ISBN 978-3-540-76297-3. Gustavo E. A. P. A. Batista, Ronaldo C. Prati, and Maria Carolina Monard.
A study of
the behavior of several methods for balancing machine learning training data.
Explorations, 6(1):20�29, 2004. BBC. Nokia appoints microsoft executive as new head, 2010.
business-11257069, Allan Bell.
Subrahmanian. alone.
In
http://www.bbc.co.uk/news/
consulted 9/2010.
The Language of News Media.
Farah Benamara,
SIGKDD
Language in Society. Blackwell, 1991.
Carmine Cesarano,
Antonio Picariello,
Diego Reforgiato,
and V. S.
Sentiment analysis:
Adjectives and adverbs are better than adjectives
Proceedings of the International Conference on Weblogs and Social Media
(ICWSM), pages 1�4, 2007.
J. Bhogal, A. Macfarlane, and P. Smith.
A review of ontology based query expansion.
Information Processing and Management, 43(4):866�886, 2007. A Blum and T Mitchell.
Combining labeled and unlabelled data with co-training.
Workshop on Computational Learning Theory, pages 92�100, 1998.
In
BIBLIOGRAPHY
142
Johan Bollen and Huina Mao. Twitter mood as a stock market predictor.
IEEE Computer,
44(10):91�94, 2011. Antulio Bom�m. Pre-announcement e�ects, news, and volatility: Monetary policy and the stock market. Technical report, Federal Reserve System, 2000. Jethro Borsje, Leonard Levering, and Flavius Frasincar.
Hermes:
a semantic web-based
The 23rd ACM Symposium on Applied Computing (SAC 2008), Special Track on Web Technologies, 2008.
news decision support system. In
Leo Breiman. Random forests.
Machine Learning, 45(1):5�32, 2001.
Je�rey A. Busse and T. Clifton Green. Market e�ciency in real time.
Economics, 65(3):415�437, September 2002.
Journal of Financial
Ivn Cantador and Pablo Castells. Semantic contextualisation in a news recommender system. In
Proceedings of the Workshop on Context-Aware Recommender Systems,
2009.
http:
//ids.csom.umn.edu/faculty/gedas/cars2009/. Andrew Carlson, Justin Betteridge, Richard C. Wang, Estevam R. Hruschka Jr., and Tom M. Mitchell. Coupled semi-supervised learning for information extraction. In
the third ACM international conference on Web search and data mining,
Proceedings of
pages 101�110.
ACM, 2010. Carlos Carvalhob, Nicholas Klaggea, and Emanuel Moencha. The persistent e�ects of a false news shock.
Journal of Empirical Finance, 18(4):597�615, November 2011.
Ming Chang, Lev Ratinov, and Dan Roth. Guiding semi-supervision with constraint-driven learning. In
Proceedings of the Annual Meeting of the ACL, pages 280�287, 2007.
Ming-Wei Chang, Lev Ratinov, and Dan Roth. Constraints as prior knowledge. In
ICML
Workshop on Prior Knowledge for Text and Language Processing, pages 32�39, 2008.
S. Chapman. Simmetrics (open source extensible library of similarity or distance metrics), 2008.
http://goo.gl/cn4cd.
N.V. Chawla, K.W. Bowyer, L.O. Hall, and W.P. Kegelmeyer. Smote: Synthetic minority over-sampling technique.
Journal of Arti�cial Intelligence Research, 16:321�357, 2002.
Kenneth Ward Church and Patrick Hanks. and lexicography.
Word association norms, mutual information,
Comput. Linguist., 16(1):22�29, March 1990.
Harris Collingwood. Do ceos matter?
The Atlantic, 2009. http://www.theatlantic.com/
magazine/archive/2009/06/do-ceos-matter/307437/. David Culter, James Poterba, and Lawerence Summers. Speculative dynamics.
of Economic Studies, pages 529�546, 1991.
The Review
BIBLIOGRAPHY
Bontcheva
143
Cunningham,
Maynard
and
Tablan.
Gate:
A
framework
and
graphical
Proceedings of the 40th Anniversary Meeting of the Association for Computational Linguistics, 2002. development environment for robust nlp tools and applications.
In
Dale Cyphert. The rhetorical analysis of business speech : Unresolved questions.
Business Communication, 47(3):346�368, 2010. Mohamed Yehia Dahab, Hesham Hassan, and Ahmed Rafea. ontology construction from natural english text.
Textontoex:
Journal of Automatic
Expert Systems with Applications,
34:
1474�1480, 2008.
Analyst statements, stockholder reactions, and banking relationships : do analysts' words matter? PhD thesis, University of Texas, 2009.
John A Daly.
Angela Davis and Jeremy Piger.
Beyond the numbers:
An analysis of optimistic and
pessimistic language in earnings press releases. Technical report, Federal Reserve Bank, 2006. W. F. M. De Bondt and R. H. Thaler. Does the stock-market overreact?
Journal of Finance.,
40:793�805, 1985. Marie-Catherine de Marne�e, Bill MacCartney, and Christopher Manning. Generating typed dependency parses from phrase structure parses. In Nicoletta Calzolari, Khalid Choukri, Aldo Gangemi, Bente Maegaard, Joseph Mariani, Jan Odijk, and Daniel Tapias, editors,
Proceedings of Language Resources and Evaluation, pages 449�454, 2006. Thomas Dean and Keiji Kanazawa.
Probabilistic temporal reasoning.
AAAI, pages 524�529, 1988.
In
Proceedings of
Evgenia Dimitriadou, Kurt Hornik, Friedrich Leisch, David Meyer, and Andreas Weingessel.
e1071: Misc Functions of the Department of Statistics (e1071), TU Wien, 2011. R package version 1.6. Rim Djedidi and Marie-Aude Aufaure. evolution process.
In
Change management patterns (cmp) for ontology
Proceedings of International Workshop on Ontology Dynamics,
IWOD2009, 2009. Rim Djedidi and Marie-Aude Aufaure. Onto-evoal an ontology evolution approach guided
Proceedings of the 6th international conference on Foundations of Information and Knowledge Systems, FoIKS'10, pages 286� by pattern modeling and quality evaluation.
In
305. Springer-Verlag, 2010. Gregory Druck, Gideon S. Mann, and Andrew Mccallum. Learning from labelled features using generalized expectation criteria. In
Proceedings of SIGIR, pages 595�602, 2008.
BIBLIOGRAPHY
144
Brett Drury, Luis Torgo, and J.J Almeida. Guided self training for sentiment classi�cation. In
ROBUS WORKSHOP RANLP Proceedings, pages 9�16, 2011.
A Esuli and F Sebastiani.
Sentiwordnet a publicly available lexical resource for opinion
mining. In Maria Teresa Lino, Maria Francisca Xavier, Rute Costa Fátima Ferreira, and
Language Resources and Evaluation (LREC), pages 417�422, 2006.
Raquel Silva, editors, C Fellbaum.
WordNet: An Electronic Lexical Database.
Robert W. Floyd. Algorithm 97: Shortest path.
The MIT Press, 1998.
Commun. ACM,
5:345, June 1962. ISSN
0001-0782. FMLabs.
Average directional movement index.
reference/default.htm?url=ADX.htm, FMLabs.
http://www.fmlabs.com/
11 2012a.
Web Site -http://www.fmlabs.com/reference/
Average true range (atr).
default.htm?url=ATR.htm,
Web Site -
11 2012b.
http://www.fmlabs.com/reference/Aroon.htm,
FMLabs. Aroon. Web Site -
FMLabs. Bollinger bands. Web Site -
11 2012c.
http://www.fmlabs.com/reference/Bollinger.htm,
11 2012d. FMLabs.
Chaikin
volatility.
ChaikinVolatility.htm, FMLabs.
Web
-
http://www.fmlabs.com/reference/
11 2012e.
Ease of movment values.
ArmsEMV.htm,
Site
Web Site -
http://www.fmlabs.com/reference/
11 2012f.
FMLabs. Macd. Web Site -
http://www.fmlabs.com/reference/MACD.htm,
FMLabs. Money �ow index. Web Site -
url=MoneyFlowIndex.htm, FMLabs. Sar. Web Site -
11 2012g.
http://www.fmlabs.com/reference/default.htm?
11 2012h.
http://www.fmlabs.com/reference/SAR.htm,
FMLabs. Stochastic oscillator. Web Site -
htm?url=StochasticOscillator.htm,
11 2012i.
http://www.fmlabs.com/reference/default.
11 2012j.
Gabriel Fung, Je�rey Xu Yu, and Wai Lam.
News sensitive stock trend prediction.
In
Proceedings of the 6th Paci�c-Asia Conference on Advances in Knowledge, pages 481�493, 2002. Yassine Gargouri, Bernard Lefebvre, and Jean guy Meunier. textual analysis.
In
Informatics SCI, 2003.
Ontology maintenance using
Proceedings of Multi-Conference on Systemics, Cybernetics and
BIBLIOGRAPHY
145
Gy®z® Gidófalvi. Using news articles to predict stock price movements. Technical report, University of California, 2001. Sam Glucksberg.
Sentiment analysis: Emotion, metaphor, ontology and terminology.
In
Nicoletta Calzolari, Khalid Choukri, Bente Maegaard, Joseph Mariani, Jan Odijk, Stelios Piperidis, and Daniel Tapias, editors,
(LREC), pages 94�101, 2008.
Proceedings of Language Resources and Evaluation
Frank Goossen, Wouter IJntema, Flavius Frasincar, Frederik Hogenboom, and Uzay Kaymak. News personalization using the cf-idf semantic recommender. In Rajendra Akerkar, editor,
Proceedings of the International Conference on Web Intelligence Mining and Semantics, WIMS '11, pages 10:1�10:12, 2011. Hatcher Gospodnetic, Otis and McCandless.
Lucene in Action.
Manning Publications, 2009.
ISBN 1-933988-17-7. Peter Ager Hafez. Construction of market sentiment indices using news sentiment. Technical report, Ravenpack, 2009. Peter Ager Hafez. How news events impact market sentiment. Technical report, Ravenpack, 2010. Matt Hamblen.
Analysis:
Free nokia gps could hurt tomtom, garmin.
web site, 2010.
http://goo.gl/B0PJV. Trevor Hastie and Rob Tibshirani.
earth: Multivariate Adaptive Regression Spline Models,
2011. R package version 3.2-1. Vasileios Hatzivassiloglou and Kathleen R. McKeown. Predicting the semantic orientation of
Proceedings of the eighth conference on European chapter of the Association for Computational Linguistics, pages 174�181, 1997. adjectives. In
Elaine Henry. Market reaction to verbal components of earnings press releases.
Emerging Technologies in Accounting, 3:1�19, 2006.
Journal of
Richard Higgins and Brendan D. Bannister. How corporate communication of strategy a�ects share price.
Long Range Planning, 25(3):27�35, 1992.
Alexander Hogenboom, Paul van Iterson, Bas Heerschop, Flavius Frasincar, and Uzay
Proceedings
Kaymak. Determining negation scope and strength in sentiment analysis. In
IEEE International Conference on Systems, Man, and Cybernetics (SMC),
pages 2589�
2594, 2011. Wouter IJntema, Frank Goossen, Flavius Frasincar, and Frederik Hogenboom. based news recommendation. In pages 16:1�16:6, 2010.
Ontology-
Proceedings of the EDBT/ICDT Workshops, EDBT '10,
BIBLIOGRAPHY
146
K. Izumi, T. Goto, and T. Matsui. mining.
In
Trading tests of long-term market forecast by text
Proceedings of International Conference on Data Mining Workshops,
pages
935�942, 2010. Nathalie Japkowicz. Learning from imbalanced data sets: A comparison of various strategies. In Raghu Ramakrishnan, Salvatore J., Stolfo Roberto, J. Bayardo, and Ismail Parsa, editors,
ACM SIGKDD, pages 10�15. AAAI Press, 2000.
Neville Ryant Karin Kipper, Anna Korhonen and Martha Palmer. A large-scale extension of verbnet with novel verb classes. In
Proceedings of Euralex International Congress,
pages
173�185, 2006. Antonina Kloptchenko, Tomas Eklund, Barbro Back, and Jonas Karlsson. data and text mining techniques for analysing �nancial reports.
Combining
International Journal
of Intelligent Systems in Accounting, Finance and Management, 12(1):29�41, 2004.
M Kompman and M Bielikova. Content based news recommendation. In Giovanni Semeraro, editor,
E-Commerce and Web Technologies:, pages 61�72. Springer, 2010.
M. Kubat and S. Matwin.
Addressing the curse of imbalanced training sets:
selection. In Douglas H. Fisher, editor,
One-sided
Fourteenth International Conference on Machine
Learning, pages 179�186. Morgan Kaufmann, 1997.
Jerome Kuperman, Manoj Athavale, and Alan Eisner. Evolving roles and recent trends.
Financial analysts in the media:
American Business Review, 21(2):74�80, 2003.
D.F. Larcker and A. Zakolyukina. Detecting deceptive discussions in conference calls, 2010. URL
http://ssrn.com/abstract=920470.
Victor Lavrenko, Matt Schmill, Dawn Lawrie, Paul Ogilvie, David Jensen, and James
Proceedings of the Ninth International Conference on Information and Knowledge Management, pages 389�396.
Allan. Language models for �nancial news recommendation. In
ACM Press, 2000. Ivo La²ek.
Dc proposal: model for news �ltering with named entities.
In
Proceedings of
the 10th international conference on The semantic web - Volume Part II, ISWC'11, pages 309�316. Springer-Verlag, 2011. Chang-Shing Lee, Yuan-Fang Kao, Yuan-Fang Kuo, and Mei-Hui Wang. domain ontology construction with a crystallizing approach.
Enhancement of
Expert Systems Applications,
38(6):7544�7557, 2011. Douglas B. Lenat. Cyc: a large-scale investment in knowledge infrastructure.
tions of the ACM, 38(11):33�38, November 1995.
ISSN 0001-0782.
Communica-
BIBLIOGRAPHY
147
Leonard Levering, Flavius Frasincar, and Jethro Borsje. A semantic web-based approach for building personalized news services.
International Journal of E-Business Research, pages
35�53, 2009. Beth Levin.
Levin.
English verb classes and alternations: a preliminary investigation" by Beth
The University of Chicago Press, 1993.
Bing Liu.
Web Data Mining, chapter Opinion Mining, pages 411�438.
Bing Liu.
Handbook of Natural Language Processing.
Bing Liu.
Web Data Mining, chapter Information Retrieval and Web Search, pages 183�236.
Springer, 2007a.
Springer, 2007b.
Springer, 2007c. Bing Liu.
Web Data Mining, chapter Link Analysis, pages 237�272.
Springer, 2007d.
H. Liu and P. Singh. Conceptnet a practical common-sense reasoning tool-kit.
Journal, 22(4):211�226, 2004. L. Lloyd, D. Kechagias, and S. Skiena. News and blog analysis with lydia.
Conference Spire, pages 161�166, 2005.
BT Technology 12 Internation
Y.C. Lu, Y.C. Wei, and W. S. Chang. The application of text mining on �nancial corpus
Proceedings of the 17th Conference on the Theories and Practices of Securities and Financial Markets, 2009. to the earning warning model for corporate �nancial distress. In
Ronny Luss. Predicting abnormal returns from news using text classi�cation. In
in Machine Learning for Computational Finance. UCL, 2009.
Advances
Erik Mannens, Sam Coppens, Toon De Pessemier, Hendrik Dacquin, Davy Van Deursen,
Proceedings of the 3rd international workshop on Automated information extraction in media production, and Rik Van de Walle. Automatic news recommendations via pro�ling. In
AIEMPro '10, pages 45�50, 2010. ISBN 978-1-4503-0164-0. Christopher Manning and Hinrich Schütze.
processing.
Foundations of statistical natural language
MIT Press, Cambridge, MA, USA, 1999. ISBN 0-262-13360-1.
John McCarthy.
Applications of circumscription to formalizing common-sense knowledge.
Arti�cial Intelligence, 28:89�116, 1986. John McManus. An economic theory of news selection. In
Journalism and Mass Communication, 1988.
Annual Meeting for Education in
I. Mierswa, M. Wurst, R. Klinkenberg, M. Scholz, and T. Euler. Yale: Rapid prototyping
Proceedings of the 12th ACM SIGKDD International Conference on Knowledge Discovery and Data Mining (KDD 2006), pages 935�940, 2006.
for complex data mining tasks. In
BIBLIOGRAPHY
148
Gautam Mitra and L Mitra, editors.
The Handbook of News Analytics in Finance,
chapter
Applications of news analytics in �nance, pages 1�42. Wiley Finance, 2011a. Gautam Mitra and Leela Mitra, editors.
The Handbook of News Analytics in Finance, chapter
News Analytics: Framework, techniques and metrics, pages 43�69. Wiley Finance, 2011b. Gautam Mitra and Leela Mitra, editors.
The Handbook of News Analytics in Finance, chapter
How news events impact market sentiment, pages 129�145. Wiley Finance, 2011c. Marc-Andre Mittermayer and Gerhard F. Knolmayer. Newscats: A news categorization and trading system.
In
Proceedings of the Sixth International Conference on Data Mining,
ICDM '06, pages 1002�1007. IEEE Computer Society, 2006. ISBN 0-7695-2701-9. Jaimie Murdock, Cameron Buckner, and Colin Allen. Two methods for evaluating dynamic ontologies. In Joaquim Filipe and Jan Dietz, editors,
and Ontology Development, pages 110�122, 2010.
Proceedings of Knowledge Engineering
David Nadeau and Satoshi Sekine. A survey of named entity recognition and classi�cation.
Journal of Linguistic Investigations, 30(1):1�20, 2007. http://nlp.cs.nyu.edu/sekine/ papers/li07.pdf. D Newman, C Chemudugunta, P Smyth, and M Steyvers. in news articles using statistical topic models.
Analyzing entities and topics
In Sharad Mehrotra, editor,
Proceedings
of IEEE International Conference on Intelligence and Security Informatics, pages 93�104, 2006. Vicotor Niederho�er. The analysis of world events and stock prices.
Journal Of Business, 44
(2):193�219, 1971. Natalya Noy, Abhita Chugh, William Liu, and Mark Musen.
A framework for ontology
evolution in collaborative environments. In Isabel Cruz, Stefan Decker, Dean Allemang, Chris Preist, Daniel Schwabe, Peter Mika, Mike Uschold, and Lora Aroyo, editors,
Semantic Web - ISWC 2006,
volume 4273 of
Lecture Notes in Computer Science,
The
pages
544�558. Springer Berlin / Heidelberg, 2006. Oxford Thesaurus of English. Oxford thesaurus of english, 2010.
com/worldofwords/thesauri/?view=uk,
http://www.askoxford.
consulted in 2009.
F Panetta. The stability of the relation between the stock market and macroeconomic forces.
Economic Notes, pages 417�450, 2002. D Peramunetilleke and RK Wong. Currency exchange rate forecasting from news headlines. In X. Zhou, editor, 2002.
Proceedings of 13th Australasian Database Conference., pages 131�139,
BIBLIOGRAPHY
149
Text and discourse constitution: Empirical aspects, theoretical approaches,
J Peto�, editor.
chapter Connective relations�connective expressions�connective structures. De Gruyter, 1988. F. Provost. Machine learning from imbalanced data sets 101. In Nathalie Japkowicz, editor,
AAAI Workshop on Imbalanced Data Sets, pages 1�4, 2000. ratemyprofessors.com.
Ratemyprofessors,
http://www.ratemyprofessors.com/,
2010.
consulted in 2010. Gerald Ratner.
The Rise and Fall... and Rise Again.
Wiley, J, 2007.
D. C. Reis, P. B. Golgher, A. S. Silva, and A. F. Laender. Automatic web news extraction using tree edit distance. In
World Wide Web Conference Series, pages 502�511, 2004.
http://d.opencalais.com/er/company/ ralg-tr1r/9e3f6c34-aa6b-3a3b-b221-a07aa7933633.html, consulted in 2010.
Reuters.
Calais web service linked data, 2010a.
Reuters. Calais web service, 2010b.
http://opencalais.com/,
reviewcentre.com. Reviewcentre, 2010.
consulted in 2009.
http://www.reviewcentre.com/, consulted in 2010.
E. Rilo� and J. Weibe. Learning extraction patterns for subjective expressions. In
Proceedings
of the 2003 Conference on Empirical Methods in Natural Language Processing, pages 105� 112, 2003. Mohammad Robbani and Sekhar Anantharaman. An econometric analysis of stock market reaction to political events in emerging markets. In
Conference, 2004.
Proceedings of Second Annual ABIT
Eduardo Ruiz, Vagelis Hristidis, Carlos Castillo, Aristides Gionis, and Alejandro Jaimes. Correlating �nancial time series with micro-blogging data. In
Proceedings of International
Conference on Web Search and Data Mining, pages 513�522. ACM, 2012.
Thomas Scharrenbach, Claudia d'Amato, Nicola Fanizzi, Rolf Groutter, Bettina Waldvogel, and Abraham Bernstein3. Unsupervised conict-free ontology evolution without removing axioms.
In
Proceedings of International Workshop on Ontology Dynamics,
IWOD2010,
2010. Erick Schonfeld.
Google+ added $20 billion to google's market cap.
web page (http:
//techcrunch.com/2011/07/10/google-plus-20-billion-market-cap/),
July
2011.
http://techcrunch.com/2011/07/10/google-plus-20-billion-market-cap/. Robert Schumaker and Hsinchun Chen. Textual analysis of stock market prediction using breaking �nancial news: The az�ntext system. (2):1�19, 2009.
Transactions on Information Systems, 27
BIBLIOGRAPHY
150
Thomas Schuster.
News events and price movements. price e�ects of economic and non-
economic publications in the news media. Technical report, EconWPA, May 2003. Push Singh, Thomas Lin, Erik T. Mueller, Grace Lim, Travell Perkins, and Wan Li Zhu. Open mind common sense: Knowledge acquisition from the general public. In
the Move to Meaningful Internet Systems Conference,
Proceedings, On
pages 1223�1237. Springer-Verlag,
2002. Sitmo. Volatility indicators. Web Site - (http://www.sitmo.com/eq/172), 11 2012. James Spindler. Why shareholders want their ceos to lie more after dura pharmaceuticals. Technical Report 06, USC, July 2006. Ste�en Staab and Rudi Studer, editors.
http://ssrn.com/abstract=1572705.
Ontology Evaluation, pages 293�313.
International
Handbooks on Information Systems. Springer, 2004a. ISBN 3-540-40834-7.
Handbook on Ontologies,
Ste�en Staab and Rudi Studer, editors. Ontology?, pages 293�313.
chapter What is an
International Handbooks on Information Systems. Springer,
2004b. ISBN 3-540-40834-7. StockCharts.com. Close location value. Web Site -
http://stockcharts.com/education/
IndicatorAnalysis/indic_AccumDistLine.html, Carlo Strapparava and Alessandro Valitutti. wordnet.
11 2012.
Wordnet-a�ect:
an a�ective extension of
In Maria Teresa Lino, Maria Francisca Xavier, Rute Costa Fátima Ferreira,
and Raquel Silva, editors,
Proceedings of Language Resources and Evaluation (LREC),
pages 1083�1086, 2004. V. S. Subrahmanian and Diego Reforgiato. sentiment analysis.
Ava:
Adjective-verb-adverb combinations for
IEEE Intelligent Systems, 23(4):43�50, 2008.
Tamura and Hiromichi.
ISSN 1541-1672.
Individual analyst characteristics and forecast error.
Analysts Journal, 58(4):28�35, 2002.
Financial
X. Tang, C. Yang, and J. Zhou. Stock price forecasting by combining news mining and time series analysis.
In
Web Intelligence and Intelligent Agent Technologies,
pages 279�282,
2009. Paul Tetlock, Maytal Saar-Tsechansky, and Sofus Macskassy. More than words: Quantifying language to measure �rms' fundamentals. Terry M Therneau and Beth Atkinson.
Journal of Finance, 63:1437�1467, 2008.
rpart: Recursive Partitioning,
2012.
R package
version 3.1-51. James Thomas and Katia Sycara.
Integrating genetic algorithms and text learning for
Genetic and Evolutionary Computing 2000 Conference Workshop on Data Mining with Evolutionary Algorithms, pages 72�75, 2000. �nancial prediction. In
BIBLIOGRAPHY
Luis Torgo.
151
Data Mining with R, learning with case studies.
Chapman and Hall/CRC, 2010.
http://www.liaad.up.pt/~ltorgo/DataMiningWithR. Maria Vargas-Vera and David Celjuska. Event recognition on news stories and semi-automatic population of an ontology.
In
Proceedings of the 2004 IEEE/WIC/ACM International
Conference on Web Intelligence, pages 615 � 618, 2004. W. N. Venables and B. D. Ripley.
Modern Applied Statistics with S.
Springer, New York,
fourth edition, 2002. ISBN 0-387-95457-0. Pietro Veronesi.
Stock market overreactions to bad news in good times:
expectations equilibrium model.
a rational
Review of Financial Studies, 12(5):975�1007, 1999.
Proceedings of the 17th annual international ACM SIGIR conference on Research and development in information retrieval, SIGIR '94, pages 61�69, New York, NY, USA, 1994. Springer-Verlag New York,
Ellen Voorhees. Query expansion using lexical-semantic relations. In
Inc. ISBN 0-387-19889-X. Ellen M. Voorhees and Donna. Harman.
Common evaluation measures.
Text Retrieval Conference (TREC), pages 200�251, 2003. J. Wiebe, T. Wilson, R. Bruce, M. Bell, and M. Martin.
In
The Eleventh
NIST Special Publication. Learning subjective language.
Computational Linguistics, 30(3):277�308, 2004. Theresa Wilson, Janyce Wiebe, and Paul Ho�mann.
Recognizing contextual polarity in
Proceedings of the conference on Human Language Technology and Empirical Methods in Natural Language Processing, HLT '05, pages 347� phrase-level sentiment analysis.
In
354. Association for Computational Linguistics, 2005. Wuthrich, Cho, and Leung. Daily prediction of major stock indices from textual www data. In
4th ACM SIGKDD Int. Conference on Knowledge Discovery and Data Mining,
pages
364�368, 1998.
http://finance. yahoo.com/news/Nokia-Replaces-CEO-With-ibd-4210132396.html?x=0&.v=1,
Yahoo. Nokia replaces ceo with microsoft exec in smart phone war, 2010.
consulted 9/2010. Xiaojin Zhu.
Semi-supervised learning literature survey.
Technical Report 1530, Dept. of
Computer Sciences, University of Wisconsin-Madison, 2008. G Zipf.
Human Behavior and the Principle of least e�ort: Introduction to human Ecology.
Addison Wesley, 1949. Arzucan Özgür, Levent Özgür, and Tunga Güngör. Text categorization with class-based and corpus-based keyword selection. In Pinar Yolum, Tunga Güngör, Fikret S. Gürgen, and Can C. Özturan, editors,
ISCIS, pages 606�615, 2005.
Appendix A
De�nitions A.1 De�nitions The thesis will make references to �software tools�, linguistic and machine learning terms which the reader may be unfamiliar. This section will de�ne each term used in the thesis so there is a single point of reference rather than distributing the de�nitions through out the thesis. Gate
Gate is a collection of software libraries which is used for processing text. There are two modes of operation: interactive and API. The interactive mode uses a graphical interface where a user can produce �pipelines� where output from a library is piped into the next library.
The API
access allows a programmer to have access to the GATE libraries and therefore it is possible for the programmer to include �Gate functionality � into their programmes. More information can be found at the GATE website JAPE
http://gate.ac.uk/
JAPE is an acronym for Java Annotation Patterns Engine. The pattern engine allows the construction of expressions expressed in the JAPE syntax to capture sections of text from a �Gate Document �. The JAPE expressions are executed by a JAPE transducer. Multiple JAPE transducers can be chained together allowing the output of one transducer to be operated on by another transducer. More information can be found at the Gate website
http://gate.ac.uk/sale/tao/splitch8.html#chap:
jape
152
APPENDIX A. DEFINITIONS
ANNIE
153
ANNIE is an acronym for: a Nearly-New Information Extraction System. The extraction system contains a: tokenizer, gazetteer, sentence splitter, part of speech tagger, semantic tagger and orthographic coreference. The work conducted for the thesis used the tokenizer, gazetteer, sentence splitter and part of speech tagger. These tools will be de�ned later on in this table. More information can be found at the Gate websitehttp:
//gate.ac.uk/sale/tao/splitch6.html#chap:annie. ANNIE Tokenizer
The tokenizer a�xes token information to each linguistical unit in the text. The token information indicates if the linguistical unit is a: word, number or punctuation.
ANNIE Gazetter
The Gazetter is a series of lists which contain a �named entity� and its label. These lists are used to identify named entities in text and a�x its label to the relevant text.
ANNIE
Sentence
Splitter
The sentence splitter is a series of JAPE rules which splits the text into sentences. The rules rely upon �split� punctuation tokens marked by the tokenizer.
ANNIE POS Tag-
The Part of Speech (POS) Tagger a�xes part of speech information
ger
to text.
Part of speech information at its most basic indicates if the
word is a: Noun, Adjective, Adverb or Verb. Part of speech taggers can add other part of speech information. For example the Brown Corpus part of speech tag set can be found at:
uk/ccalas/tagsets/brown.html
http://www.comp.leeds.ac.
APPENDIX A. DEFINITIONS
Lingpipe
154
Lingpipe is a collection of Java libraries which can be used to process text. The lingpipe library contains chunkers, taggers and classi�ers. The work for the thesis used only the classi�er which will be de�ned later in this table.
Lingpipe
Lingpipe contains several �generative classi�ers�:
Classi�er
Naive Bayes and Bernoulli.
Language Models,
The classi�ers classify text into predeter-
mined categories by analysing �features� in text.
The classi�ers use a
�model� which has been induced in training phase from pre classi�ed documents to classify the unlabelled documents. RapidMiner
RapidMiner is a GUI for machine learning. Experiments are conducted by chaining together operators (machine learning strategies) and the results are outputted to a �le. More information can be found at:
http:
//rapid-i.com/content/view/181/190/ Lucene
Lucene is an �inverted index� which is used for full text search. A lucene index is a collection of �documents� which store �elds. The �elds contain textual information. The search process is conducted at the �eld level where a query is used to look for �tokens� in the relevant �elds. A token is a linguistical unit which may be a: implementation.
unigram, bigram or a custom
The selection of tokens for indexing is controlled by
the person who produces the index. More information can be found at
http://lucene.apache.org/core/. OWLAPI
OWLAPI is a API which allows the construction, querying and management of Ontologies.
More information can be found at:
//owlapi.sourceforge.net/
http:
APPENDIX A. DEFINITIONS
155
A.1.1 Speci�c term de�nition Feature
A feature is a variable which has a name and a value.
The variable
describes some part of the data being presented to the learner. In this thesis a feature is always a unigram. Generative
A generative learner represents observable data (labelled data) as a joint
Learner
distribution.
The joint distribution is used to estimate a category or
value for unknown data points (unlabelled data). Discriminative
In contrast a discriminative learner separates the space which encapsu-
Learner
lates data points into regions. The regions are used to assign categories or values to the data points captured in the region
Linguistical Unit
A selection of natural units which text can be broken down into for analysis, for example unigram or bigrams
n-grams
is a contentious sequence of n items in text. The sequence may be letters (letter n-grams) or words (word n-grams). In thesis when the term ngram or any derivative is used then reader must assume that they are word n-grams.
Inverted Index
is a data structure which maps �tokens� to locations in a database �le.
Ontology
is a formal representation of knowledge in a domain. The representation of knowledge consists of: concepts and relations between concepts. The concepts used in this thesis are �business / �nance� concepts, for example, names of companies
OWL
Web Ontology Language (OWL) is knowledge representation language for ontologies
RDF
Resource Description Framework which is used in the modelling of information. RDF is often used to model ontologies
Regular
Regular Expressions is a pattern language which matches strings in a
Expressions
larger text
APPENDIX A. DEFINITIONS
156
An example of a Jape Rule is presented below:
Phase:TokenUse //Rule takes three named entities, PEA (Property of Economic Actor), // BEV (Business Event Verb) and company. The rule works on // sentences which are delimited by split. Input: Split PEA BEV Company Options: control = brill Rule: Event ( ({Company.rule =="rename"} {BEV.rule =="rename"} {PEA.rule =="rename"}) | ( {PEA.rule =="rename"} {Company.rule =="rename"} {BEV.rule =="rename"} )| ( {Company.rule =="rename"} {PEA.rule =="rename"} {BEV.rule =="rename"} ) | ({PEA.rule =="rename"} {BEV.rule =="rename"} {Company.rule =="rename"}) ) :Event --> :Event.Company = {rule="Event"}
Appendix B
Publications B.1 Thesis Publications •
Brett Drury and J. J. Almeida.
Construction of a local domain ontology from news
Proceedings of the 14th Portuguese Conference on Arti�cial Intelligence: Progress in Arti�cial Intelligence, pages 400�410. Springer-Verlag, 2009.
stories.
•
In
Brett Drury, Gaël Dias, and Luís Torgo. A contextual classi�cation strategy for polarity analysis of direct quotations from �nancial news. In
•
RANLP, pages 434�440, 2011.
Brett Drury and José João Almeida. Identi�cation of �ne grained feature based event
Proceedings of the International Conference on Web Intelligence, Mining and Semantics. and sentiment phrases from business news stories.
In Rajendra Akerkar, editor,
ACM, 2011.
•
Brett Drury, Luis Torgo, and José João Almeida. Classifying news stories to estimate the direction of a stock market index.
In
Systems and Technologies, 2011. •
6th Iberian Conference on Information
Brett Drury, José João Almeida, and M.H.M Morais. tology driven �breaking �nancial news� recommender.
Information Systems and Technologies, 2011. •
Brett Drury, Luis Torgo, and Jose Joao Almeida.
Magellan: In
An adaptive on-
6th Iberian Conference on
Guided self training for sentiment
Proceedings of Workshop on Robust Unsupervised and Semisupervised Methods in Natural Language Processing, 2011.
classi�cation. In
•
Brett Drury, José João Almeida, and M. H. M. Morais. Construction and maintenance of a fuzzy temporal ontology from news stories.
157
IJMSO, 6(3/4):219�233, 2011.
APPENDIX B. PUBLICATIONS
•
158
Brett Drury, Luís Torgo, and José João Almeida.
Classifying news stories with a
constrained learning strategy to estimate the direction of a market index.
IJCSA,
9(1):1�22, 2012.
•
Brett Drury and José João Almeida.
The minho quotation resource.
In Nicoletta
Calzolari (Conference Chair), Khalid Choukri, Thierry Declerck, Mehmet U§ur Do§an,
Proceedings of the Eight International Conference on Language Resources and Evaluation. EuroBente Maegaard, Joseph Mariani, Jan Odijk, and Stelios Piperidis, editors,
pean Language Resources Association (ELRA), 2012.
•
Brett M. Drury and José João Almeida.
Predicting Market Direction from Direct
Speech by Business Leaders. In Alberto Simões, Ricardo Queirós, and Daniela da Cruz, editors,
1st Symposium on Languages, Applications and Technologies, volume 21, pages
163�172. Schloss Dagstuhl�Leibniz-Zentrum fuer Informatik, 2012.
•
Brett Drury, José João Almeida, and M. H. M. Morais. ology for time dependent ontologies. In
An error correction method-
CAiSE Workshops, pages 501�512, 2011.
Appendix C
Supplementary Results C.1 Comparative Information Retrieval Date
Headline
Company Rank
Industry Rank
2010-04-12
Tencent to invest $300m in DST
24
1
2010-04-12
Telecom Italia trims growth targets
-
2
2010-04-12
IBM helps New York go after tax deadbeats
2
-
C.2 Company Speci�c Ontology Concept Steve Ballmer Steve Ballmer Steven Sinofsky Steven Sinofsky Helmut Panke Helmut Panke John Lilly John Lilly
Relation EmployedAs EmployedBy
Concept Type Chief Executive Microsoft
Description Commonly know information. Steve Ballmer is often quoted in all news media EmployedAs Head of the Windows Group Less well known EmployedBy Microsoft He is quoted less frequently than Steve Ballmer EmployedAs Director Less well known EmployedBy Microsoft It is di�cult to �nd where he is quoted directly EmployedAs Chief Executive Reasonably well known EmployedBy Mozzilla Head of a competitor company and 55 more entities with 2 or more assertions Table C.1: Subset of assertions for entity type person
159
APPENDIX C. SUPPLEMENTARY RESULTS
160
Concept Relation Concept Microsoft CompetitorOf Google Microsoft CompetitorOf SalesForce.Com Microsoft Employs Ray Ozzie Microsoft Employs Sean Poulley Microsoft Produces Windows Microsoft Produces Silverlight Microsoft PlannedPurchaseOf Yahoo Microsoft LocatedIn Seattle Microsoft HasRelationship Dell Microsoft HasRelationship Verizon Microsoft ParentOf Aquantive Microsoft Produces Works ... and more than 200 further assertions Table C.2: Selection of assertions which concern Microsoft
C.3 Experimental Results - Data
Algorithm Fully Supervised Fully Supervised GST GST Voting Voting Inductive (LD) Inductive (LD) Inductive (LD+RC) Inductive (LD+RC) Self-Training (LD) Self-Training (LD) Veto Veto
Classi�er NB LM NB LM NB LM NB LM NB LM NB LM NB LM
1 F-Measure 0.52 ±0.05 0.49 ±0.04 0.48 ±0.00 0.48 ±0.00 0.51 ±0.01 0.49 ±0.02 0.54 ±0.00 0.53 ±0.00 0.50 ±0.01 0.48 ±0.01 0.54 ±0.00 0.53 ±0.00
% of Data for Training 2 3 F-Measure F-Measure 0.91 0.98 0.61 ±0.01 0.63 ±0.01 0.60 ±0.02 0.64 ±0.01 0.49 ±0.00 0.50 ±0.01 0.49 ±0.00 0.49 ±0.00 0.51 ±0.01 0.52 ±0.01 0.50 ±0.01 0.51 ±0.01 0.55 ±0.00 0.56 ±0.00 0.54 ±0.00 0.55 ±0.00 0.50 ±0.01 0.51 ±0.01 0.49 ±0.00 0.50 ±0.00 0.55 ±0.00 0.56 ±0.00 0.54 ±0.00 0.55 ±0.00
Table C.3: Airline Meals Experimental Results
4 F-Measure
5 F-Measure
0.63 ±0.01 0.64 ±0.01 0.51 ±0.01 0.50 ±0.00 0.54 ±0.01 0.52 ±0.01 0.56 ±0.00 0.55 ±0.00 0.51 ±0.01 0.50 ±0.01 0.49 ±0.00 0.55 ±0.00
0.63 ±0.01 0.63 ±0.02 0.51 ±0.01 0.51 ±0.00 0.55 ±0.01 0.53 ±0.01 0.57 ±0.00 0.56 ±0.00 0.52 ±0.01 0.51 ±0.00 0.49 ±0.00 0.56 ±0.00
APPENDIX C. SUPPLEMENTARY RESULTS
Algorithm Fully Supervised Fully Supervised GST GST Voting Voting Inductive (LD) Inductive (LD) Inductive (LD+RC) Inductive (LD+RC) Self-Training (LD) Self-Training (LD) Veto Veto
Classi�er NB LM NB LM NB LM NB LM NB LM NB LM NB LM
1 F-Measure 0.67 ±0.04 0.58 ±0.01 0.47 ±0.01 0.45 ±0.01 0.56 ±0.03 0.52 ±0.02 0.53 ±0.00 0.52 ±0.00 0.53 ±0.03 0.49 ±0.02 0.52 ±0.00 0.52 ±0.00
% of Data for Training 2 3 F-Measure F-Measure 0.96 0.99 0.71 ±0.02 0.67 ±0.03 0.75 ±0.01 0.76 ±0.01 0.48 ±0.01 0.51 ±0.01 0.48 ±0.01 0.49 ±0.01 0.60 ±0.02 0.63 ±0.03 0.59 ±0.03 0.61 ±0.02 0.54 ±0.00 0.54 ±0.05 0.53 ±0.00 0.55 ±0.00 0.56 ±0.02 0.60 ±0.02 0.55 ±0.03 0.57 ±0.02 0.54 ±0.00 0.55 ±0.00 0.53 ±0.00 0.55 ±0.00
161
4 F-Measure
5 F-Measure
0.66 ±0.02 0.74 ±0.02 0.52 ±0.01 0.51 ±0.01 0.65 ±0.02 0.64 ±0.02 0.57 ±0.00 0.56 ±0.00 0.62 ±0.03 0.60 ±0.02 0.57 ±0.00 0.56 ±0.00
0.65 ±0.02 0.73 ±0.02 0.54 ±0.01 0.53 ±0.01 0.66 ±0.02 0.66 ±0.02 0.58 ±0.00 0.57 ±0.00 0.64 ±0.02 0.62 ±0.02 0.58 ±0.00 0.57 ±0.00
Table C.4: Teacher Review Experimental Results
Algorithm Fully Supervised Fully Supervised GST GST Voting Voting Inductive (LD) Inductive (LD) Inductive (LD+RC) Inductive (LD+RC) Self-Training (LD) Self-Training (LD) Veto Veto
Classi�er NB LM NB LM NB LM NB LM NB LM NB LM NB LM
1 F-Measure 0.51 ±0.01 0.54 ±0.01 0.43 ±0.00 0.43 ±0.00 0.57 ±0.09 0.54 ±0.09 0.45 ±0.00 0.45 ±0.01 0.58 ±0.01 0.54 ±0.09 0.45 ±0.00 0.45 ±0.00
% of Data for Training 2 3 F-Measure F-Measure 0.96 0.99 0.46 ±0.02 0.48 ±0.02 0.55 ±0.01 0.49 ±0.01 0.44 ±0.00 0.45 ±0.01 0.45 ±0.01 0.45 ±0.01 0.64 ±0.07 0.61 ±0.07 0.59 ±0.11 0.60 ±0.07 0.45 ±0.00 0.46 ±0.01 0.46 ±0.00 0.46 ±0.00 0.64 ±0.07 0.61 ±0.07 0.58 ±0.12 0.60 ±0.08 0.45 ±0.00 0.46 ±0.01 0.46 ±0.01 0.46 ±0.00
4 F-Measure
5 F-Measure
0.49 ±0.02 0.49 ±0.02 0.46 ±0.01 0.46 ±0.01 0.66 ±0.07 0.65 ±0.08 0.47 ±0.01 0.47 ±0.00 0.66 ±0.08 0.65 ±0.09 0.47 ±0.01 0.47 ±0.00
0.50 ±0.03 0.48 ±0.02 0.47 ±0.01 0.47 ±0.01 0.65 ±0.06 0.67 ±0.06 0.48 ±0.01 0.48 ±0.01 0.65 ±0.06 0.66 ±0.07 0.48 ±0.01 0.48 ±0.01
Table C.5: Music Reviews Experimental Results
APPENDIX C. SUPPLEMENTARY RESULTS
Algorithm GST Inductive (RD+LC)
Classi�er LM LM
1 F-Measure 0.13 ±0.00 0.58 ±0.00
% of Data for Training 2 3 4 F-Measure F-Measure F-Measure 0.15 ±0.00 0.17 ±0.00 0.21 ±0.00 0.58 ±0.00 0.59 ±0.00 0.59 ±0.00
Table C.6: GST Strategy with lower precision classi�er
162
5 F-Measure 0.25 ±0.00 0.59 ±0.00