alignment between news articles and stock prices, pre-processing, and classifier ...... found out the interaction effect between Twitter and news sentiment has a ...
STOCK PRICE CHANGE PREDICTION USING NEWS TEXT MINING
Marcelo Beckmann
Tese de Doutorado apresentada ao Programa de Pós-Graduação em Engenharia Civil, COPPE, da Universidade Federal do Rio de Janeiro, como parte dos requisitos necessários à obtenção do título de Doutor em Engenharia Civil. Orientadores: Nelson
Francisco
Favilla
Ebecken Beatriz de Souza Leite Pires de Lima
Rio de Janeiro Janeiro de 2017
i
STOCK PRICE CHANGE PREDICTION USING NEWS TEXT MINING
Marcelo Beckmann
TESE SUBMETIDA AO CORPO DOCENTE DO INSTITUTO ALBERTO LUIZ COIMBRA DE PÓS-GRADUAÇÃO E PESQUISA DE ENGENHARIA (COPPE) DA UNIVERSIDADE FEDERAL DO RIO DE JANEIRO COMO PARTE DOS REQUISITOS NECESSÁRIOS PARA A OBTENÇÃO DO GRAU DE DOUTOR EM CIÊNCIAS EM ENGENHARIA CIVIL.
Examinada por: _________________________________________________ Prof. Nelson Francisco Favilla Ebecken, D.Sc.
_________________________________________________ Profª. Beatriz de Souza Leite Pires de Lima, D.Sc.
_________________________________________________ Prof. Elton Fernandes
_________________________________________________
Prof. Helio José Corrêa Barbosa
_________________________________________________ Profª. Solange Guimarães
_________________________________________________ Profª. Regina Celia Paula Leal Toledo
RIO DE JANEIRO, RJ, BRASIL JANEIRO/2017
ii
Beckmann, Marcelo Stock Price Change Prediction Using News Text Mining/Marcelo
Beckmann.
-
Rio
de
Janeiro:
UFRJ/COPPE, 2017. XVII, 143 p.: il.; 29,7 cm. Orientadores: Nelson Francisco Favilla Ebecken Beatriz de Souza Leite Pires de Lima Tese (doutorado) - UFRJ/COPPE/ Programa de Engenharia de Civil, 2017. Referências Bibliográficas: p. 120-135. 1. Finanças. 2. Mineração de Textos. 3. Mineração de Dados. I. Ebecken, Nelson Francisco Favilla et al. II. Universidade Federal do Rio de Janeiro, COPPE, Programa de Engenharia Civil. III. Título.
iii
Acknowledgments To God.
To my mother, who taught me to love the people and the world, and to be who I am.
To my wife, my love, my life.
To my sons, my light, my inspiration.
To my friends, Eduardo Nicodemos and Julia M. R. F. Santos, which devote their careers to high frequency algorithmic trading, and since the beginning they helped me to have a clear understanding and good insights in this area.
To Andrea Mussap, who kindly volunteered to review the English grammar and textual structure of this thesis.
To my friends from COPPE/Federal University of Rio de Janeiro. In special Mauricio Onoda and Cristian Klen, without their friendship, competence and clever ideas, it would never have been possible to reach this point.
To my teachers.
A special thanks to the giants whose shoulders I stood on all these years. They showed me a way to go, self-learning, research, think ahead, and propagate good science. These giants are my professors from COPPE/Federal University of Rio de Janeiro. Thank you very much, Nelson Francisco Favilla Ebecken, Beatriz de Souza Leite Pires de Lima, and Alexandre Gonçalves Evsukoff.
iv
Resumo da Tese apresentada à COPPE/UFRJ como parte dos requisitos necessários para a obtenção do grau de Doutor em Ciências (D.Sc.)
PREDIÇÃO DA VARIAÇÃO DE PREÇOS DE AÇÕES UTILIZANDO MINERAÇÃO DE TEXTOS EM NOTÍCIAS
Marcelo Beckmann Janeiro/2017
Orientadores: Nelson Francisco Favilla Ebecken Beatriz de Souza Leite Pires de Lima
Programa: Engenharia Civil
Com o advento da Internet como um meio de propagação de notícias em formato digital, veio a necessidade de entender e transformar esses dados em informação.
Este trabalho tem como objetivo apresentar um processo computacional para predição de preços de ações ao longo do dia, dada a ocorrência de notícias relacionadas às companhias listadas no índice Down Jones. Para esta tarefa, um processo automatizado que coleta, limpa, rotula, classifica e simula investimentos foi desenvolvido. Este processo integra algoritmos de mineração de dados e textos já existentes, com novas técnicas de alinhamento entre notícias e preços de ações, pré-processamento, e assembleia de classificadores. Os resultados dos experimentos em termos de medidas de classificação e o retorno acumulado obtido através de simulação de investimentos foram maiores do que outros resultados encontrados após uma extensa revisão da literatura. Este trabalho também discute que a acurácia como medida de classificação, e a incorreta utilização da técnica de validação cruzada, têm muito pouco a contribuir em termos de recomendação de investimentos no mercado financeiro.
Ao todo, a metodologia desenvolvida e resultados contribuem com o estado da arte nesta área de pesquisa emergente, demonstrando que o uso correto de técnicas de mineração de dados e texto é uma alternativa aplicável para a predição de movimentos no mercado financeiro.
v
Abstract of Thesis presented to COPPE/UFRJ as partial fulfillment of the requirements for the degree of Doctor in Science (D.Sc.)
STOCK PRICE CHANGE PREDICTION USING NEWS TEXT MINING
Marcelo Beckmann January/2017
Advisors: Nelson Francisco Favilla Ebecken Beatriz de Souza Leite Pires de Lima
Department: Civil Engineering
Along with the advent of the Internet as a new way of propagating news in a digital format, came the need to understand and transform this data into information. This work presents a computational framework that aims to predict the changes of stock prices along the day, given the occurrence of news articles related to the companies listed in the Down Jones Index. For this task, an automated process that gathers, cleans, labels, classifies, and simulates investments was developed. This process integrates the existing data mining and text algorithms, with the proposal of new techniques of alignment between news articles and stock prices, pre-processing, and classifier ensemble. The result of experiments in terms of classification measures and the Cumulative Return obtained through investment simulation outperformed the other results found after an extensive review in the related literature. This work also argues that the classification measure of Accuracy and incorrect use of cross validation technique have too few to contribute in terms of investment recommendation for financial market. Altogether, the developed methodology and results contribute with the state of art in this emerging research field, demonstrating that the correct use of text mining techniques is an applicable alternative to predict stock price movements in the financial market.
vi
Table of Contents
Acknowledgments ........................................................................................................... iv Table of Contents ........................................................................................................... vii Chapter 1 – Introduction ................................................................................................... 1 Chapter 2 – Data Mining .................................................................................................. 5 2.1 Pre-Processing Techniques ..................................................................................... 6 2.2 Classification Algorithms ....................................................................................... 7 2.2.1 Support Vector Machine .................................................................................. 9 2.2.2 K Nearest Neighbors ..................................................................................... 19 2.3 Evaluation Measures ............................................................................................ 20 2.3.1 Error Rate and Accuracy ............................................................................... 21 2.3.2 Precision ........................................................................................................ 22 2.3.3 Recall ............................................................................................................. 22 2.3.4 F-Measure ...................................................................................................... 23 2.3.5 G-Mean .......................................................................................................... 24 2.3.6 ROC Curve .................................................................................................... 24 2.3.7 AUC ............................................................................................................... 26 2.4 – Text Mining ....................................................................................................... 26 2.4.1 - Data Acquisition.......................................................................................... 27 2.4.2 - Pre-Processing ............................................................................................. 27 2.4.3 - Mining ......................................................................................................... 29 Chapter 3 – Text Mining for Financial Market Prediction ............................................. 31 3.1 Financial Economics Background ........................................................................ 31 3.1.1 - Efficient Market Hypothesis ....................................................................... 31 3.1.2 - Behavioral Economics ................................................................................ 32 3.1.3 - Technical Analysis ...................................................................................... 33 3.1.4 - Fundamental Analysis ................................................................................. 34 3.1.5 - Technological Approaches .......................................................................... 35 3.2 Related Works ...................................................................................................... 38 3.2.1 – Year of Publication ..................................................................................... 39 3.2.2 - Source of News ........................................................................................... 40 3.2.3 - Number of Items ......................................................................................... 41
vii
3.2.4 - Market / Index / Exchange .......................................................................... 42 3.2.5 - Time-Frame / Alignment offset .................................................................. 43 3.2.6 – Period of News Collection / Number of Months ........................................ 44 3.2.7 - Number of Classes / Target prediction ........................................................ 46 3.2.8 - Feature Selection / Representation .............................................................. 47 3.2.9 - Dimensionality Reduction ........................................................................... 50 3.2.10 - Learning Algorithm ................................................................................... 51 3.2.11 - Training vs. Testing .................................................................................. 52 3.2.12 - Sliding Window ........................................................................................ 54 3.2.13 – Sentiment Analysis ................................................................................... 55 3.2.14 - Semantics .................................................................................................. 57 3.2.15 - Syntax ........................................................................................................ 58 3.2.16 – Data Balancing ......................................................................................... 58 Chapter 4 – Methodology ............................................................................................... 61 4.1 – Data Gathering................................................................................................... 62 4.1.1 – Obtain news ................................................................................................ 62 4.1.2 – Obtain market data...................................................................................... 63 4.1.3 - Text Cleaning .............................................................................................. 64 4.1.4 - Stock Price Labeling ................................................................................... 64 4.1.5 - News articles and prices alignment ............................................................. 66 4.1.6 – Database Storage ........................................................................................ 70 4.2 – Data splitting ..................................................................................................... 71 4.2.1 – Split............................................................................................................. 71 4.3 – Training ............................................................................................................. 73 4.3.1 – Feature Selection / Representation ............................................................. 73 4.3.2 – Dimensionality Reduction .......................................................................... 75 4.3.3 – Data Balancing ........................................................................................... 75 4.3.4 – Training ...................................................................................................... 83 4.4 – Test .................................................................................................................... 83 4.4.1 – Feature Selection ........................................................................................ 84 4.4.2 – Feature Removal ......................................................................................... 84 4.4.3 – Test ............................................................................................................. 84 4.4.4 – News Aggregation ...................................................................................... 85 4.5 – Evaluation .......................................................................................................... 91 4.5.1 – Model Evaluation (Good Model?).............................................................. 91 4.5.2 – Investment Simulation ................................................................................ 92 4.5.3 – Good Simulation? ...................................................................................... 93 viii
4.5.4 – Real Investment Recommendation ............................................................. 95 Chapter 5 – Experiments ................................................................................................ 97 5.1 – Experiment Setup .............................................................................................. 97 5.2 – Classifier Performance ...................................................................................... 99 5.3 – Investment Simulation ..................................................................................... 104 5.4 – Discussion........................................................................................................ 109 Chapter 6 - Conclusion ................................................................................................. 117 6.1 – Future Work..................................................................................................... 119 References .................................................................................................................... 121 Appendix A .................................................................................................................. 137
ix
x
Chapter 1 – Introduction With the advent and popularization of the Internet during the ‘90s, the news articles that before were available in the day after, printed in paper, started to be available as soon as possible, in digital format, at the velocity that financial market needs. During the same decade, the developments in computing, inferential statistics, artificial intelligence, machine learning, information retrieval, natural language processing, and linguistics culminated in the creation of data mining and text mining as emerging technologies.
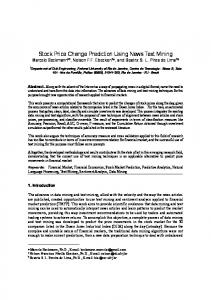
The advances in data mining and text mining, allied with the velocity and the way the news articles are published, created opportunities to use text mining applied to financial market prediction (TMFP). Nevertheless, to make possible computers to interpret news articles at the right time and generate profit in financial markets, an interdisciplinary field of research has been created. The Venn diagram in Figure 1 describes the three disciplines involved in this emerging field.
Figure 1 - Venn diagram describing the intersection of disciplines involved in this work.
TMFP is supported by Behavioral Economics (BE) theories, which analyse the psychological, social, cognitive, and emotional aspects of human behaviour when taking
1
investment decisions. BE claims that humans can make irrational decisions that lead to discrepancies and market inefficiencies. Due to this inefficiency, the stock prices cannot reflect in real time the changes in the world, creating an opportunity for predictive techniques like data mining and text mining.
The main objective in this work is to prove that data mining and text mining can be used to automatically interpret news articles and learn patterns to predict the movement in the stock markets, providing in this way investment recommendations to be used by traders and automated trading systems to achieve returns. To accomplish this objective, a complete process of data mining and text mining was developed to predict the price movements in the stock market for the 30 companies listed in the Down Jones Industrial Index (DJIA) along the day (intraday). Due to the complex and unstable nature of financial markets, the traditional data mining algorithms were not enough to make correct predictions, and then a new data preparation technique to deal with imbalanced class problem, and a classifier ensemble technique to remove class overlapping were proposed in this work.
The experiment results are demonstrated in terms of classification measures such as Accuracy, Precision, Recall, AUC, G-Mean, and F-Measure; and an investment simulator was developed to validate the predictions generated by the classifier. The classifier measures and the cumulative return obtained with the investment simulation outperformed the results existing in the reviewed literature.
In this work, an extensive review of the literature related to TMFP was conducted, and problems like the use of Accuracy as classification measure, lack of information about the model evaluation, and incorrect use of cross validation were identified and will be discussed.
This thesis is organized as follows: Chapter 2 presents the data mining techniques used in this work. Chapter 3 presents the financial economics background that supports the application of text mining in financial market prediction, followed by an extensive review of the literature on this subject. Chapter 4 introduces the proposed methodology, followed by the experiments and discussion in Chapter 5. Finally, Chapter 6 concludes
2
the thesis and proposes new developments in the future. The meaning of acronyms and financial terms can be found in Table 19 Appendix A.
3
4
Chapter 2 – Data Mining The great volume of data generated nowadays and the expected growth in the next years bring new challenges to explore, understand, and transform all this data in useful information. The use of data mining techniques, also known as Knowledge Discovery in Databases (KDD), play an important role to deal with these new challenges.
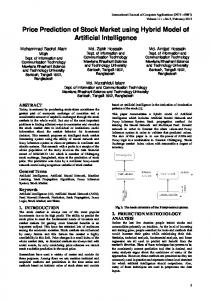
Data mining is an interdisciplinary field of computer science. This term was coined in the ‘90s, and mainly involves inferential statistics, artificial intelligence, machine learning, and database systems techniques that were developed in the previous decades. As demonstrated in Figure 2, data mining is divided in supervised and unsupervised learning tasks. The supervised tasks are related to analyzing and learning from examples (also known as rows, records, or instances) with a previous identification (the class), and they aim to classify the new examples, using the concepts learned previously. In regression tasks, the learning algorithm uses a numerical value (integer or continuous) instead of a class, and the outcome of this algorithm is also a numerical value. In unsupervised learning, there is no class or numerical value associated with the examples from the dataset under analysis, and the clustering and association are exploratory tasks looking for unknown patterns, groups, and similarities.
5
Figure 2 - Taxonomy of data mining tasks
This work focuses on supervised learning and classification tasks. In the next sections, the pre-processing, classification algorithms, evaluation measures, and text mining techniques will be described.
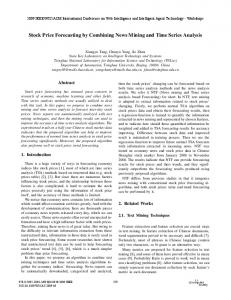
2.1 Pre-Processing Techniques The proper use of classification algorithms is not enough to deliver a data mining product. In fact, there are several initiatives for an effective data mining process, the most well-known is the Cross Industry Standard Process for Data Mining (CRISP-DM), with its main process depicted in Figure 3.
6
Figure 3 - The CRISP-DM process.
One of the most important phases in CRISP-DM is the pre-processing, or data preparation. The main goal of this phase is to transform and adjust the data for the modeling phase, in accordance with the input of data understanding phase, which generated descriptive statistics through exploratory analysis.
2.2 Classification Algorithms Within the data mining context, classification is the capacity to identify objects and predict events. It is a modeling activity that uses machine learning algorithms, and it is considered a supervised learning task, because each example in a dataset must be labeled according to its features.
7
One of the first proposals of automatic classification was inspired in the capacity of live individuals to identify objects and events in their environments. This algorithm implemented a series of weighted connections that replicate a neurological system to create a network of artificial neurons (McCulloch & Pitts, 1943), and the term Artificial Neural Networks (ANN) was coined. Since then, the classification algorithms evolved and diversified, with application in all areas of human knowledge.
The classification process is divided into two phases: training and testing. For the training phase, a machine-learning algorithm is used on a dataset, entitled training set, which consists of examples. Each example consists of one or more attributes and a specific attribute, which contains the label that associates the example to a pre-defined class. The need for a pre-defined label in the training stage makes the classification a supervised learning activity.
The training algorithm will generate a predictive model based on the relationship between the attribute values and the class the instance belongs, that is, the algorithm infers that certain values are associated with certain classes. For this task, there are multiple learning techniques, and according to (Frank, et al., 2016), they are mainly categorized as Bayes, Functions (e.g., SVM, Neural Networks), Lazy Algorithms (e.g., KNN), Meta Classifiers (e.g., Bagging and Boosting), Decision Rules, and Decision Trees.
During the test phase, new examples of unknown class will be identified (labeled), using the predictive model generated in the training phase to decide which class the new example belongs, given its attribute values, thus completing the process of machine learning and classification. At this stage, it is necessary to compute some measures that assert the quality of the predictive model obtained during the training phase. These measures are known as classification measures and they will be described in section 2.3.
The training and testing process is also known as predictive model selection. Among the various model selection methods, the simplest technique consists in the separation of a portion (normally 70%) of the dataset for training, and the remaining for test.
Another model selection method is the cross-validation, which aims to improve the assessment of the predictive model by testing the classifier performance in unknown
8
instances. The operation consists in partitioning the data set in f equal parts (usually f = 10), and separate f-1 parts of the dataset for training and one part for testing. The process is repeated f times, and on each iteration a different part from the dataset is separated for testing, and the remaining for training. At the end, the average of the classification measures obtained on each iteration is taken.
Nowadays, there is a great number of classification methods and several variations of them. The objective of this section is to describe the classification methods used in this work. For further information about other methods, see (Wu, et al., 2007)
2.2.1 Support Vector Machine
The Support Vector Machine algorithm (SVM) is a supervised learning technique applicable for classification and regression tasks. With its bases initially launched by (Vapnik & Lerner, 1963) and enhanced in the ‘90s at AT&T Bell Labs, it is grounded in the theory of statistical learning and the principle of minimization of structural risk, which argues that the less complex the model, the better the ability of generalization this model will have.
Originally, the SVM was developed for linear classification problems with two classes separable by a margin, where the margin means the minimum distance of two hyperplanes separating the classes. The SVM learning algorithm searches for an optimal hyperplane separation where it maximizes the width of the margin of separation, which minimizes the structural risk, giving the model a great ability to generalize.
The solution or predictive model of SVM is only based on the data points that delimit the margins’ edge. These points are called support vectors. Another important feature is that the calculation of the structural risk does not take into account the dimensionality of the training set (2), which allows the SVM to be applied to high-dimensional problems such as image recognition and text mining. The SVM also does not take into account how the data is distributed. However, the algorithm did not solve nonlinear problems, until
9
(Boser, et al., 1992) suggested a way to make a nonlinear SVM classifier using the kernel trick (Aizerman, et al., 1964).
The vast majority of classification problems have not separable classes, which also prevented the acceptance and application of SVM, which was initially designed to deal with completely separable classes. The solution was proposed by (Cortes & Vapnik, 1995), who introduced a relaxing constraint variable (12), allowing hyperplanes with flexible margins and finally making the SVM a viable and successful algorithm.
Model Formulation
Different of other methods based on the error minimization, SVM searches for a model structure less complex as possible, in order to not trespass a pre-fixed error level, and with the aim to minimize the structural risk, represented by the functional equation:
(1) Where: •
R( f ) is the total risk;
•
Re ( f ) is the empiric risk relative to the errors and noise from the training set;
•
Rs ( f ) is the model’s structural risk, which is calculated as:
(2)
Where: •
N is the number of examples in the training set;
•
(1 ) is the statistical confidence from the result of (2), generally 5%;
•
h is an integer called Vapnik-Chervonenkis dimension, which measures the predictive capacity of a family of functions applied in one model. For example,
10
for binary classification problems, h is the number of required points to perform the separation, according to the family of functions used in the problem.
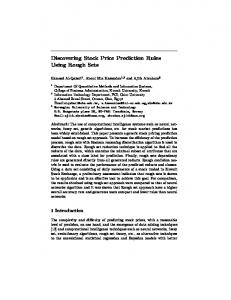
Definition of structure and model parameter Given the training set T {( x(t ), y (t )) | x(t ) , y (t ) {1,1}}tN1 , where y(t) can be 1 or -1, indicating to which class the point x(t) belongs, and each x(t) is a p-dimensional vector, the SVM searches for a hyperplane with a maximized margin among an infinity of existing hyperplanes (Figure 4), which splits the points that belong to y(t) =1 and y(t) = −1. This separation surface is defined by the hyperplane:
d ( x) w, x(t ) b 0
(3)
Where: •
x(t ) is the input vector;
•
w is the normal vector to the hyperplane, which defines the width of margin, because the bigger the angle, the bigger the margin (Figure 5), since the restrictions in (4) do not be violated
•
b is a bias
•
b is the distance from the hyperplane to the origin (Figure 5) || w ||
For the linear algorithm, the problem must be separable, considering the following constraints:
w, x(t ) b 0, if y (t ) 1
(4)
w, x(t ) b 0, if y (t ) 1
The linear decision surface is calculated as
2 , and the minimization of the || w ||
2-norm of w will make the separation margin to be maximized. The data points on the edge of separation margin are called support vectors 𝛼. The support vectors are the final product from the SVM algorithm, also known as model parameter or simply model. The
11
support vectors 𝛼 are calculated from b and w, through a quadratic optimization (Figure 6), which will be detailed in the next section.
Figure 4 - Infinite separation surfaces in a binary classification problem.
12
Figure 5 - Searching for a separation surface with a maximized margin and less structural risk. The higher w, the larger the margin.
Figure 6 - The result of ||w|| minimization are the support vectors.
13
Parameter adjusting algorithm
To obtain an optimal hyperplane || w || and b must be minimized, causing the maximization of margin w, but subject to the constraints (4). This problem is n p difficult because it is a non-convex optimization, but substituting || w || for w (5), this will not change the solution, but at least now there is a convex optimization to be solved, which is a quadratic optimization problem with constraints.
1
min J ( w) 2 || w ||
2
, subject to (4)
(5)
w
The primal form of Lagrange is obtained after applying the constraint on the equation above:
L p ( w, b, )
N 1 || w ||2 t ( y (t )( w, x(t ) b) 1) 2 t 1
(6)
To solve the problem above, the derivative of Lp relative to w and b must be equalized to zero:
(7)
Replacing w and b in the primal Lagrangean (6), the dual formulation is obtained, this time maximizing the margins:
14
(8)
Finally, the discriminatory function starts to be calculated from the support vectors
:
0, if x d ( x) t y (t ) x, x(t ) b t 1 0, if x N
(9)
Parameter adjusting for nonlinear problems
The algorithm seen so far is only applicable to linear problems. For surfaces with nonlinear separation (Figure 7), the kernel trick was proposed by (Boser, et al., 1992) to maximize the margins of hyperplanes. The resulting algorithm is formally similar, except that all inner product is replaced by a nonlinear kernel function:
(10) N 0, if x d ( x) t y (t ) K ( x(i ), x( j )) b t 1 0, if x
15
Being, K ( x(i ), x( j )) x(i ), x( j )
This allows the algorithm to adjust the hyperplane with a maximized margin in a transformed space of infinite dimensionality. Several functions can be applied to , the most common are:
•
Linear: xi T x j
•
Homogeneous Polynomial: (xi T x j ) d , 0
•
Inhomogeneous Polynomial: (xi x j 1) d , 0
•
Radial Basis: exp( || xi x j ||2 )), for 0
T
•
Gaussian Radial Basis: exp(
•
Sigmoid:
|| xi x j ||2 2 2
(11)
)
Here, and d are parameters provided by the user. The d parameter denotes the degree of a polynomial. The most common degree is d=2 (quadratic), since larger degrees tend to over fit on Natural Language Processing (NLP) problems. The parameter (Gamma) is present in most functions in (11), and it is used to control the shape of peaks where the points raise. For example, in a problem with no linear separability between the classes, as shown in the 2-dimension plot from Figure 7, if the green points raise, the 2dimension figure is transformed in a 3-dimension figure, then it is possible to separate green and red points with another plane (a hyperplane).
16
Figure 7 - A two-class dataset with non-linear separation (Ng, et al., 2010-2012)
A small gives a pointed bump, and a large gives a softer, broader bump. Therefore, a small tends to return low bias and high variance, while a large tends to return higher bias and low variance.
Flexible Margin The constraints imposed in (4) don’t allow the application of SVM in most of the existing classification problems in the real world, where classes cannot be separated completely. The solution was proposed by (Cortes & Vapnik, 1995), and it introduces a relaxing constraint variable
, and then the margin constraints
now are calculated as:
(12)
17
Being c an additional constraint to the Lagrangean multipliers to penalize the classification errors.
User Parameter Optimization
The c variable used to penalize classification errors in the flexible margin, together with from the kernel functions demonstrated in (11), are parameters to be provided by the user. For large values of c , the margin adjusting (12) tends to choose a smaller-margin hyperplane. Conversely, small values of c will cause the optimizer to look for a largermargin separating hyperplane, even if that hyperplane misclassifies more points. For very tiny values of c, the algorithm tends to return more misclassified examples, even if the training data is linearly separable. The choice of c is a vital step and a good practice in the use of SVM, as structural risk minimization is partially implemented via the tuning of c.
The right choice of these parameters is considered the weakness of SVM, as a wrong set of parameters makes the SVM to perform poorly. The solution for this problem can be an optimization procedure to find the better set of values according to the dataset under study. (Hsu, et al., 2003) provides a practical guide to SVM, and proposes the use of a grid search to find the best values of c and , but first, use the linear kernel function, and compare the results with other functions. The grid search consists of using exponentially growing sequences of ( c , ), for example c 2 5 ,2 3 ,...,215 , 215 , 213 ,..., 23 . The pair with the best Accuracy after a cross-validation will be picked.
18
2.2.2 K Nearest Neighbors The k Nearest Neighbor (KNN) is a supervised classifier algorithm, and despite its simplicity, it is considered one of the top 10 data mining algorithms (Wu, et al., 2007).
It creates a decision surface that adapts to the shape of the data distribution, making possible to obtain good Accuracy rates when the training set is large or representative. The KNN was introduced by (Fix & Hodges, 1951), and it was developed with the need to perform discriminant analysis when reliable parametric estimates of probability densities are unknown or difficult to determine.
The KNN is a nonparametric lazy learning algorithm. It is nonparametric because it does not make any assumptions on the underlying data distribution. Most of the practical data in the real world does not obey the typical theoretical assumptions made (for example, Gaussian mixtures, linear separability, etc.). Nonparametric algorithms like KNN are more suitable on these cases (Dasarathy, 1991), (Duda, et al., 2001).
It is also considered a lazy algorithm. A lazy algorithm works with a nonexistent or minimal training phase, but with a costly testing phase. For KNN this means the training phase is fast, but all the training data is needed during the testing phase, or at the least, a subset with the most representative data must be present. This contrasts with other techniques like SVM, where one can discard all nonsupport vectors.
The classification algorithm is performed according to the following steps:
1. Calculate the distance (usually Euclidean) between an xi instance and all instances of the training set T; 2. Select the k nearest neighbors; 3. The xi instance is classified (labeled) with the most frequent class among the k nearest neighbors. It is also possible to use the neighbors' distance to weigh the classification decision.
19
The value of k is training-data dependent. A small value of k means that noise will have a higher influence on the result. A large value makes it computationally expensive and defeats the basic philosophy behind KNN: points that are close might have similar densities or classes. Typically, in the literature odd values are found for k, normally with k = 5 or k = 7, and (Dasarathy, 1991) reports k=3 allowing to obtain a performance very close to the Bayesian classifier in large datasets. An approach to determine k as a function (1) from the size of data m is proposed in (Duda, et al., 2001). k odd ( m)
(13)
The algorithm may use other distance metrics besides Euclidean (Sidorov, et al., 2014), (Argentini & Blanzieri, 2010), (Boriah, et al., 2007), (Wilson & Martinez, 1997).
2.3 Evaluation Measures In supervised learning, it is necessary to use some measure to evaluate the results obtained with a classifier algorithm. The confusion matrix from Figure 8, also known as contingency table, is frequently applied for such purposes, providing not only the count of errors and hits, but also the necessary variables to calculate other measures.
The confusion matrix can represent either two class or multiclass problems. Nevertheless, the research and literature related to imbalanced datasets is concentrated in problem with two classes, also known as binary or binomial problems, where the less frequent class is named as positive, and the remaining classes are merged and named as negative. The confusion matrix must be a square matrix, and the main diagonal indicates the classifier hits, while the secondary diagonal indicates the errors.
Positive prediction
Negative Prediction
Positive class
True Positive (TP)
False Negative (FN)
Negative class
False Positive (FP)
True Negative (TN)
Figure 8 - Confusion Matrix
20
A systematic study about the evaluation measures applied to classification tasks can be found in (Sokolova & Lapalme, 2009). The classification measures presented in this section will be used to demonstrate the experiments results in Chapter 5. These results will be multiplied by 100 as this is a common approach in the state of the art.
2.3.1 Error Rate and Accuracy Some of the most known measures derived from this matrix are the Error Rate (14) and the Accuracy (15). Both are complementary to 100%, e.g., if Accuracy is 67%, the Error Rate is 33%, and vice-versa.
Error
FP FN TP FN FP TN
Accuracy
TP TN TP FN FP TN
(14)
(15)
A way to define a good classification threshold in terms of Accuracy is comparing the Accuracy results with a random classifier, e.g., flipping a coin to take decisions in a binary problem. Classifiers with Accuracy lower or close to 50% are considered lower or close to a random classifier. This evaluation assumes both classes have 50% of distribution, which normally is not possible to obtain in real world problems.
By analyzing the equations (14) and (15), it is possible to notice that these measures do not consider the number of examples distributed between the positive and negative classes, and such measures are not appropriated to evaluate imbalanced datasets (Ling, et al., 2003), (Weis, 2004), (He & Garcia, 2009) , (He. & Ma, 2013), (Ali, et al., 2013). A complete discussion about Accuracy will be conducted along the Chapter 5.
21
The measures described in the next sections use the entries values in the confusion matrix to compensate the disproportion between classes. The measures Precision, Recall, and F-Measure are adequate when the positive class is the main concern. The measures G-Mean, ROC, and AUC are appropriated when the performance of both classes is important.
2.3.2 Precision The Precision is a measure of exactitude, and it denotes the percent of hits related to all positive objects. When analyzing together the equation (16) and the confusion matrix (Figure 8), it is possible to see the ratio between the true positives and the sum of the column with positive predictions. It is also possible to notice that this measure is sensitive to class distribution, as the divisor is a sum of positive and negative instances.
Precision=
TP TP FP
(16)
2.3.3 Recall The Recall, also denominated as Sensitivity, is a completeness measure, and it denotes the percent of positive objects identified by the classifier. Analyzing the equation (17) and the confusion matrix (Figure 8) together, it is possible to notice a ratio between the true positives and the sum of the elements in the line “positive class”. Because Recall just computes positive instances in its formula, this measure is not sensitive to class distribution.
Re call
(17)
TP TP FN
22
2.3.4 F-Measure The F-Measure (18), also known as F-Score, F1-Score, or simply F1, synthetizes the information from the last two measures, Precision, and Recall, obtaining in this way a harmonic mean between them, were
is a coefficient that adjusts the relative importance
of Precision versus Recall, normally for 1 (Van Rijsbergen, 1979).
A harmonic mean tends strongly towards the smallest elements of a population, having an inclination (if compared to the arithmetic mean) to mitigate the impact of large outliers and aggravate the impact of small ones. In terms of classification results, it can be observed that the F-Measure shows lower results, when compared with other measures, denoting that F-Measure tends to be a pessimistic measure.
𝐹 − 𝑀𝑒𝑎𝑠𝑢𝑟𝑒 = (1 + 𝛽 2 ).
𝑃𝑟𝑒𝑐𝑖𝑠𝑖𝑜𝑛. 𝑅𝑒𝑐𝑎𝑙𝑙 + 𝑅𝑒𝑐𝑎𝑙𝑙
(18)
(𝛽 2 . 𝑃𝑟𝑒𝑐𝑖𝑠𝑖𝑜𝑛)
As mentioned, the F-Measure, like the Precision and Recall, assumes one class as positive. By default, to compute these measures for both (positive and negative) or more classes, most of the machine learning tools use an average weighted by the number of instances for each class. This can be used for class imbalanced problems to compensate for the disproportion of instances, but it can result in an F-Measure that is not between Precision and Recall, and in fact, during the experiments conducted in this work, the weighted average approach presented too optimistic results that were not representing the actual classifier performance in terms of F-Measure for all classes.
Throughout the experiments in all this work, the pessimistic behavior of F-Measure showed to be useful to adjust the user parameters passed to the algorithms (also known as hyperparameters), along the modeling process. To properly represent the F-Measure for more than one class, the arithmetic mean was used instead of the weighted average.
23
2.3.5 G-Mean The G-Mean (Barandela, et al., 2003) explores the performance in both classes, considering the distribution between them, by computing the geometric average between the Sensitivity (17) and Specificity (20), obtaining in this way a balance of true predictions in both classes, or zero, if one of the classes has no correct prediction (19).
𝐺 − 𝑀𝑒𝑎𝑛 = √𝑆𝑒𝑛𝑠𝑖𝑡𝑖𝑣𝑖𝑡𝑦 . 𝑆𝑝𝑒𝑐𝑖𝑓𝑖𝑐𝑖𝑡𝑦
(19)
2.3.6 ROC Curve The Receiver Operating Characteristics (ROC) chart, also denominated ROC Curve, is applied in detection and signal analysis since the Second World War, and recently in data mining and classification. It consists of a two-dimension chart, where the y-axis refers to Sensitivity or Recall (17), and the x-axis calculated as 1-Specificity (20), as depicted in Figure 9.
Specificity=
TN FP TN
(20)
According to (Fawcett, 2004), there are several points in this chart that deserve attention. In the Figure 9, the point (0,0) means none of the positive instances were classified; (1,1), means no negative instances were classified; and (0,1), also indicated by letter D, means the perfect classification. One point is better than another, if its position is more to northwest.
The closer a point is to the x-axis, the more conservative the classifiers behavior is, that is, it will only make predictions if there are strong evidences, which can lead to few true positives. On the other hand, points in the upper right side denote a classifier with a
24
liberal and/or aggressive behavior, which can lead to a higher level of false negatives. For example, in Figure 9, the point A is more conservative than the point B.
The secondary diagonal from Figure 9, where y=x denotes the classifier has a random behavior. A point at (0.5, 0.5) shows that the classifier hits 50% of positive instances and 50% of negatives, the remaining 50% were classified in a random way. The point C in the Figure 9 indicates the classifier tried to guess the positive class 70% of the time.
At last, the point E, which is in the lower triangle, indicates a classifier with performance lower than aleatory.
Figure 9 - The ROC chart and the interest points to be analyzed.
25
2.3.7 AUC This work considers both classes, positive and negative, with equal importance, therefore, the Area Under Curve (AUC) measure is more appropriate for these cases, because it is insensitive to class imbalance problems (Fawcett, 2004). The AUC synthetizes as a simple scalar the information represented by a ROC chart (21).
AUC neg pos
(21)
Where is the normal cumulative distribution, is the Euclidean distance between the class centroids of two classes, and pos , and neg are the standard deviation from the positive and negative classes. An algorithm to calculate AUC is provided in (Fawcett, 2004).
2.4 – Text Mining Text mining is considered a set of methodologies to extract useful information from text content. For this purpose, it is necessary to transform unstructured text content into a structured format readable by other algorithms. Text mining is derived from data mining research started during the ‘80s. It is considered a multidisciplinary field that involves information retrieval, natural language processing (NLP), data mining, statistics, and linguistics.
The main activities of text mining are: entity extraction, taxonomy extraction, sentiment analysis, document summarization, text categorization, text clustering, entity relationship, and visualization. Most part of these activities relies on data mining algorithms, but these algorithms are not able to deal directly with unstructured data, as they need a structured format, normally in a matrix shape (Weiss, et al., 2010). A text
26
mining system normally has the architecture depicted in Figure 10, to be explained in the following sections.
Figure 10 – Text mining system architecture.
2.4.1 - Data Acquisition The set of textual documents, also known as corpus, can be collected from internet resources using a web crawler mechanism (Dhaka, et al., 2013), or another automated mechanism to collect unstructured data from email and messaging systems, databases, or textual files existing in a file system (e.g., log files, digitized books, speech to text, etc.). The selection of good and reliable sources of textual content is fundamental to obtain a successful text mining system.
2.4.2 - Pre-Processing To transform unstructured data in features, the textual documents must be parsed into simple words, with the blank spaces and punctuation used to distinguish and separate the words. This process is also known as tokenization. A list with all existing words and the respective number of occurrences in the corpus can also be generated during this phase. After this, the words or terms are selected to form features. In this context, a feature can be understood as a value, and the feature name is the meaning of this value. Features can represent a word, a sequence of words or n-grams, which consists in a series of consecutive n words (Sidorova, et al., 2014), types of entities (e.g., company names, stock symbols), quantitative values (e.g., stock prices, date, time), syntactical structures like noun-phrases and part-of-speech, etc.
Not all the words carry information in the textual content. The stop words are terms with low importance for information retrieval (normally prepositions), and its removal is recommended. Terms with occurrence per document lower or above a specified threshold
27
are also recommended for removal, because a few number of words have no representation, and do not carry significant information in the document. The same applies to repeated and abundant words. The min/max thresholds must be adjusted according to the problem under study, but normally values lower than ~5%, or greater than ~90% are reported in the literature.
The use of stemming reduces the number of words, by replacing a word to its base or stem (Lovins, 1968), (Porter, 1980), e.g., fruit = fructify, fruity, fruitful. The use of stemming requires caution and must be adjusted according to the problem under study, as it may remove important information existing in the original words.
The most common type of feature representation is the Bag of Words (BOW), first mentioned by (Harris, 1954) and still a predominant technique nowadays (Miner, et al., 2014), (Zhai & Massung, 2016). A BOW is basically a matrix, where each document is represented as a vector row, and the features (normally words) as the columns of this matrix. The columns of this matrix must contain not only the existing terms in the document, but also all the existing terms in the corpus. Not all the documents share the same terms, then the missing terms in a document are filled with zero or null, which can result in a sparse matrix, as demonstrated in Figure 32.
The feature values can be represented as categorical, binary (i.e., existence, nonexistence of a feature in a document), and numerical values. The numerical values can contain any integer or continuous value extracted from the textual content (e.g., prices, counting, etc.), or some measurement or weighting regarding that feature. For example, the Term Occurrence (TO), is the number of times a term occurs in a document, Term Frequency (TF) is the TO divided by the total number of terms in the document (22), since every document has a different length, it is possible that a term would appear many more times in long documents than shorter ones, then the division is a way of normalization.
28
𝑇𝐹(𝑡, 𝑑) =
𝑛𝑢𝑚𝑏𝑒𝑟 𝑜𝑓 𝑜𝑐𝑐𝑢𝑟𝑟𝑒𝑛𝑐𝑒𝑠 𝑜𝑓 𝑡 𝑖𝑛 𝑑 𝑛𝑢𝑚𝑏𝑒𝑟 𝑜𝑓 𝑡𝑒𝑟𝑚𝑠 𝑖𝑛 𝑑
(22)
Where: •
t is the term;
•
d is the document.
When using TF, all terms have the same importance, however, to account for the fact that some words appear more frequently than others in all documents, the TF is inversely weighted by the frequency of the same word along the corpus (23), also known as the Term Frequency-Inverse Document Frequency (TF-IDF) (Robertson, 2004). Nowadays, TF-IDF continues being the most common approach for feature representation in text mining (Miner, et al., 2014), (Zhai & Massung, 2016).
𝑇𝐹𝐼𝐷𝐹(𝑡, 𝑑, 𝐷) = 𝑇𝐹(𝑡, 𝑑). 𝑙𝑜𝑔
|𝐷| 𝑛𝑡
(23)
Where: •
D is the corpus that contains the document d;
•
|D| is the number of documents existing in the corpus;
•
nt is the number of documents where the term t appears.
Meta-data information like source, author, document name, document type, date and time of creation/publication, time zone, and geographical origin, can also be added to the feature set.
As the result of the pre-processing phase, the corpus, and its documents are now represented by the extracted features.
2.4.3 - Mining Once the data existing in the textual documents are readable in terms of features and values, they can be processed by a sort of algorithms. Documents can be grouped and associated using unsupervised learning (document clustering, association rules) to identify, visualize, and understand communities, concepts, taxonomies, and sentiments.
29
Entities, groups of documents, taxonomies, sentiments, concepts, and meta-data can be used to assign a category (also known as label) to each document, to be used in supervised learning (document classification and regression) and recommendation systems (Weiss, et al., 2010), (Miner, et al., 2014), (Zhai & Massung, 2016).
The architecture and the most common techniques for text mining were presented in this section, and they will be referred frequently in this work. Nevertheless, text mining is an extensive and evolving area, and one section is not enough to describe all this branch of research. Other text mining techniques will be presented together with the bibliographic review in Chapter 3. The methodology of this work will be presented in Chapter 4, and new text mining techniques will be proposed.
30
Chapter 3 – Text Mining for Financial Market Prediction This chapter presents the theoretical background in financial economics that supports the forecast of price movements in this branch of research, as well as the literature review about the efforts to use text mining to predict movements in the financial market.
3.1 Financial Economics Background To predict changes in a market economy is a powerful ability, capable to create wealth and avoid losses. This kind of activity is based in some financial concepts that started to be developed centuries ago, but it had a strong development is the last six decades, with the advances in statistical techniques and computing applied to finance. Some of these concepts provide the theoretical background for this current work, while others are contradictory. These concepts can be categorized as asset valuation theories and financial behavior theories (Thomson, 2007), and a debate beyond the scope of this work is still unfinished. The correct understanding of all these concepts is essential to understand the research problem, and propose substantial solutions.
3.1.1 - Efficient Market Hypothesis In the ‘50s, the use of probability theory and statistics to model asset prices started to be actively applied by financial economists. These developments led to the invention of Capital Asset Price Model (CAPM) (Treynor, 1961), (Sharpe, 1964), (Lintner, 1965), (Mossin, 1966). Initially as a rejection to CAPM and other statistical approaches at that time, the Efficient Market Hypothesis (EMH) (Fama, 1965), (Fama, 1965b) argues that the stock prices movements are a function of rational expectations based on publicly known information from companies, and these expectations are almost immediately reflected in the stock prices, and in the price history for instance. This implies that there is no justification for modeling stock prices changes using the price history, when these changes are already accommodated in the stock prices. The EMH claims these price changes cannot be explained only by the price history, and the external factors responsible 31
by the price changes were identified as aleatory and not possible to predict, which assigns a random walk behavior to stock prices in EMH, theory also supported by (Malkiel, 1973), (Samuelson, 1972), and others.
In a review work (Fama, 1970), the author stated that there are three types of market efficiency: weak-form, semi-strong-form, and strong-form efficiency. The weak-form is considered a soft EMH, and it admites the price movements are determined entirely by information not contained in the price series, and it does not require that the prices remain in equilibrium all the time. The semi-strong form implies that the stock prices have a very quick and unbiased adjustment to public available new information. In the strongform the share prices reflect all public and private information imediatelly, no one can earn excess returns, and it is considered a hypotetical scenario, because having access to private information means to ignore the current undisclosure laws. Despite all this time, the EMH continues to be an active theory under discussion, and it is supported by empirical and theoretical research (Read, et al., 2013).
3.1.2 - Behavioral Economics In an answer to EMH, the behavioral economic (BE) theories (Camerer & Loewenstein, 2004) argue that the markets are not efficient, and the random walk element in fact can be explained by the human behaviour, as ultimately, they are responsible to take decisions within the economical agents, and as humans they commit irrational and systematic errors. These errors affect the prices and returns, and create market inefficiencies for instance. The behavioural economics theories are supported by studies in psychology, sociology, finance, and economy, and they analyse the psychological, social, cognitive, and emotional aspects of human behaviour when taking decisions, and their respective consequences on economy, financial markets, prices, and returns. It was observed that the same information can have different interpretations, as the market participants have cognitive biases, which are organized into four categories: biases that arise from too much information, not enough meaning, the need to act quickly, and limitations of memory (Haselton, et al., 2005). In order to reconcile EMH and BE, the Adaptive Market Hypothesis (AMH) (Lo, 2005) claims that the traditional models can coexist with behavioural models, and it implies that the degree of market efficiency is 32
related to environmental factors such as the number of competitors in the market, the magnitude of profit opportunities available, and the adaptability of the market participants. The recent findings in behavioural economic principles state that market conditions are products of human behaviour involved, (Tomer, 2007), (Jurevičienė, et al., 2013), (Hollingworth, et al., 2016). The recent speculative economic bubbles were used to refute EMH, and it was claimed that the bubbles and irrational exuberance are proofs of market inefficiency, and they can be explained by behavioural economics. Nevertheless, this discussion is still vibrant and ongoing, and it is beyond the scope of this work, but it seems the EMH and BE theories will continue to be opposite forces in the evolution of financial economics studies. For those who believe the markets are predictable, the efforts in this area can be organized as: technical analysis, fundamental analysis, and technological approaches.
3.1.3 - Technical Analysis The technical analysis (TA) relies on specific tools and visual patterns in a market graph and other indicators to mainly examine the supply and demand, to forecast the price movements and returns. TA is a widespread technique among the market brokers and other participants to support an investment decision. The methodology for TA varies greatly, but in general the past market data (normally price and volume) is used for study and backtesting, and the analysis of daily market data represented as visual chart elements, like head and shoulders, double top/reversal, is used to identify patterns like lines of support, resistance, and channels (Elder, 1993). The use of market indicators and moving average techniques are a common approach, but a range of tools, econometrics, and proprietary methods are also reported. Despite the wide application in the industry, and part of financial practice for decades, TA ultimately relies on human interpretation, and due to its subjective nature, frequently technicians can make opposite predictions for the same data, which can be explained by BE theory. TA is commonly a target of controversies when submitted to scientific assertion, with some studies supporting it (Aronson, 2007), (Balsara, et al., 2007), (Irwin & Park, 2007), while others pointing problems such as low predictive power
33
(Griffioen, 2003), (Browning, 2007), (Yu, et al., 2013). TA is also object of discussion from EMH supporters, but according to (Lo, et al., 2000), TA can be an effective way to extract information from market prices.
3.1.4 - Fundamental Analysis Fundamental Analysis (FA) is a technique to identify the underlying value of financial instruments, and it concentrates in examining the economic health and productive capacity of a financial entity as opposed to analyse only its price movements. FA started to be used as a trading mechanism in 1928, and the first book about it was published in 1934, now in its 6th edition (Graham, et al., 2008). To perform this valuation, FA looks for financial economic indicators, also known as “the fundaments”. When applied to stocks, FA looks for company’s health by mainly examining business statements like assets, liabilities, earnings, as well as the company’s market, competitors, management, announcement of discoveries and new products or failures. In the case of Future Markets and ForEx, it looks for macro-economic announcements and the overall state of economy, in terms of interest rates, taxes, employment, GDP, housing, wholesale/retail sales, production, manufacturing, politics, weather, etc. The predictive and profit capacity of FA relies on the events of mispriced financial instruments, for example, buy shares of stocks when a company is under valuated to its fundaments, and then sell the shares, when the market detects the inaccuracy and the prices are adjusted to a higher value, or when the company’s share prices become over valuated for its fundaments. FA tends to be related to long-term investment strategies, as companies and governments take time to change their fundaments. Another FA strategy is the “buy and hold”, where the fundaments allow to find good companies to invest, with lower risk, to keep the assets growing and earning dividends with the business development, rather than focus in immediate profit. Fundamental analysts must understand quantitative (numeric terms) and qualitative information (non-measurable characteristics like quality, sentiments, opinions, etc.), and the public announcements are a crucial moment to operate. In an era of information, the 34
use of automated tools for FA has become a mandatory practice for analysts, and these tools normally have features like stock scanners, alerts, data feed, strategy backtesting and order placement integration, but in conclusion, it continues to be a challenging and manual activity relying on human analysis, liable to errors and uncertainty (Kaltwasser, 2010), as described by BE theory. In this scenario, the automatic understanding of textual content seems to be an attractive alternative, but among the reviewed works in the section 3.2, only one is devoted to FA (Tetlock, et al., 2008).
3.1.5 - Technological Approaches The advent of computing brought the financial markets to a next level in multiple aspects, and since the beginning the related literature is populated with examples of technological approaches applied to financial market prediction, and this wide range of possibilities is always bringing new advances, and so far, there is no clear taxonomy about these approaches. As an example, recently with the refinement of internet mechanisms, (Preis, et al., 2013) used trading strategies based on the search volume of 98 financial terms, provided by Google Trends1, and demonstrated an accumulated return of 326% in eight years of backtesting simulation, and (Moat, et al., 2013) demonstrated the number of views of specific financial articles in Wikipedia are associated with stock market movements.
The advent of computing also made possible to use inferential statistics and artificial intelligence in large scale. These advances culminated with the creation of data mining as a subfield of computer science in the ‘90s. Despite the wide range of possibilities granted by technology, this section will concentrate on how data mining and automated trading systems are applied to financial market prediction.
A typical trader can only analyze, take decisions, and monitor a limited number of strategies simultaneously. In this scenario, the cognitive biases contribute for a human failure (Haselton, et al., 2005). The most pervasive problem with trading (which also includes TA and FA) is to overcome the emotions. As a branch of data mining, machine
1
https://www.google.com/trends/
35
learning algorithms are capable to take automated decisions given a training dataset as input, and it could be an alternative to mitigate or solve that problem.
The use of data mining as a decision algorithm can be combined with any kind of automation in financial market, but in this industry, there is a vagueness about the meaning of terms such as automated trading system, algorithm trading, quantitative analysis, quantitative trading, and high frequency trading. These terms share some common characteristics, and to avoid confusion, a clear definition is required before advancing: •
Automated Trading System (ATS), also known as robot traders, is a generic term for computer programs that automatically take decisions, create negotiation orders, submit, and monitor the order execution in an exchange or other types of trading platforms. The terms quantitative trading, algorithm trading and high frequency trading are considered an ATS.
•
Algorithm Trading has the intent to execute large orders and avoid costs, risks, and reduce market impacts, and it is extensively used by pension funds, hedge funds, and investment banks. For example, in the case of portfolio change in a pension fund, a huge number of shares from several stocks must be sold, and this capital must be reinvested in another stock. It normally uses time, price, and volume as input to calculate how to split the order and automatically submit the small orders over time (Kissell, 2013). Despite to be desirable, the main purpose of algorithm trading is not to make a profitable trade, but this term became commonly associated with any kind of automated trading strategy, especially the ones where the main purpose is to make profit. For these cases, according to (Johnson, 2010), the term quantitative trading sounds more appropriated.
•
High Frequency Trading (HFT) is an automated trading system that can submit negotiation orders in a high velocity rate to exchanges or other types of trading platforms. HFT relies on Direct Market Access (DMA) or Sponsored Access with high speed connections and extremely low latency infrastructure (Johnson, 2010), (Aldridge, 2013) to deliver a negotiation order in milliseconds or microseconds. Recently a hardware vendor claimed that it took 85 nanoseconds for the entire 36
messaging job to deliver an order to exchange (Sprothen, 2016). There is no clear definition of HFT in terms of order frequency, but it mainly depends on the trading strategy particularities, as trading opportunities can last from milliseconds to few hours. Nowadays, roughly 55% of trading volume in U.S. stock markets and 40% of European stock markets volumes are executed with HFT (Gerig, 2015), and about 80% of foreign exchange futures volumes are HFT (Miller & Shorter, 2016). HFT can be used by any type of ATS. •
Quantitative Analysis aims to understand the market and valuate financial instruments to predict behaviours and events using financial economics techniques, mathematical measurements, statistics, predictive modelling, and computing (Merton, 1973), (Hardie, et al., 2008).
•
Quantitative Trading are automated trading strategies based on quantitative analysis. It is also known as black box trading, because some systems make use of proprietary and undisclosed algorithms.
The use of data mining with structured data for financial market prediction is a widespread technique, but still an evolving branch of research (Trippi & Turban, 1996), (Thawornwong & Enke, 2004), (Shadbolt & Taylor, 2013), (Halls-Moore, 2015). The use of unstructured data as input for data mining, also known as text mining, has an immense potential to contribute with BE and financial market prediction, in terms of automatic extraction of concepts, entities, patterns, trends, and sentiments from textual content. The first initiative with TMFP appeared in (Wuthrich, et al., 1998), and as the object of research in this current work, the efforts and findings in this branch of research will be detailed in the next section.
Once the financial economics theories and concepts are reviewed, it is possible to say that the research problem of this branch of research is to predict the effect of textual information on the economy and respective asset prices and returns. It is also possible to say that TMFP can be considered a quantitative trading approach, and in the case of intraday prediction, a HFT quantitative trading approach. The next section presents a survey about the efforts to solve the research problem.
37
3.2 Related Works In this section, a bibliographic review about the developments and state of the art of Text Mining Applied to Financial Market Prediction (TMFP) will be conducted. The criteria used to select a research regarding this subject are: it must have some text mining or NLP methodology; it must predict economical events or changes in some financial instrument; and publications with number of items (i.e., news articles) lower than 200 were not included, as they do not carry conclusive results. An extensive survey about this branch of research was conducted by (Nassirtoussi, et al., 2014), bringing expressive contributions and insights about TMFP. The bibliographic review in this current work aims to use important aspects from that survey. It also includes some missing publications and bar charts for quick understanding and identification of trends. The aspect of sentiment analysis received more attention, and new works that came up after 2014 were added.
Table 17 from Appendix A contains 36 reviewed works, and depicts the evolution of TMFP methodology since the first reported effort in this branch of knowledge, until the main aspects of this current work at the bottom. Table 17 is chronologically ordered by year of publication, and cells marked with “-” correspond to information not mentioned in the reviewed work. The respective results from these researches will be compared and discussed along the section 5.4. The meaning of acronyms and financial terms can be found in Table 19, Appendix A.
One of the first researches published about TMFP is (Wuthrich, et al., 1998). The authors developed a prototype to predict the trend of one day of five major stock indexes (DJIA, Nikkei, FTSE, HSE, STI). The forecast was based on daily news published overnight in portals, like for example, the Financial Times, Reuters, and the Wall Street Journal. The documents were labeled according to a model of three categories: up, steady, and down. A dictionary with 423 features was defined manually by experts. The Bayesian, Nearest Neighbor, and a Neural Network classifiers were trained, and categorized overnight all newly published articles.
These predictions were used for investment simulation, with 7.5% of cumulative return after three months, what can be considered a good result, if compared with the 38
return of 5.1% from DJIA index in the same period. Nevertheless, as mentioned before, the nature of markets is complex, and they are extremely difficult to forecast using any methodology. Unfortunately, the authors also reported an average Accuracy of 43.6% over the five indexes, which does not guarantee these investment results can be reproducible in different contexts. These low results announced the challenges in the coming years, and even text mining and other ways of prediction in financial market continue to be an open problem, but since then, the design of TMFP systems follow a structure like Figure 11.
Figure 11 - General design of a TMFP process.
In the next sections, each methodological aspect represented as a column from Table 17, and its respective research efforts will be discussed and compared. The approaches in this current work will be also cited and compared when applicable, but the complete methodology will be presented in Chapter 4.
3.2.1 – Year of Publication Figure 12 represents all the reviewed works, grouped by year of publication. Despite all this time, there is no expressive number of publications about TMFP, if compared with other branches of research. The number of publications has risen before the 2008 crisis, then another increase in 2012, with a peak of six articles, most of them motivated by a sudden interest in sentiment analysis applied to behavioral finance. Since then it is observed a decreasing number of publications.
39
Figure 12 - Number of publications related to TMFP grouped by year.
The remaining sections will explain the methodological aspects in this branch of research, and point problems that could explain this decreasing number of publications in recent years.
3.2.2 - Source of News The first thing to do in a TMFP process is to gather news articles. To achieve this, several types of web crawler mechanisms were used to obtain news content, and then some source of news is necessary to feed up these mechanisms. Since the beginning, the digital version of the main communication vehicles for financial markets were used as a source of news: Bloomberg, Down Jones, German Society for Ad Hoc Publicity (DGAP), Financial Times (FT), Forbes, Reuters, Wall Street Journal (WSJ), etc. Most of these sources provide news feeding services embedded with sentiment attributes, and (Crone & Koeppel, 2014) used 14 built-in sentiment indicators from Reuters MarketPysch aiming to anticipate ForEx movements. The specialized news aggregators like Yahoo! Finance and Google Finance were also applied as source of specialized news, and they were also used in this current work. When the exchange is outside of American and European markets, using local news also demonstrated to be more appropriated in several
40
works. Recently, social media contents like blogs, forums, and Twitter started to be used (Yu, et al., 2013), while others focused solely on Twitter (Bollen & Huina, 2011), (Vu, et al., 2012), (Makrehchi, et al., 2013).
3.2.3 - Number of Items Among the reviewed works, the most common numbers of items, i.e., news articles, to be processed, are between 10k and 1M (Figure 1). According to Table 17, most of these numbers are associated with the period of time and the source of news, with volumes ranging from 216 (Zhai, et al., 2007) from Australian Financial Review to 30M of items (Makrehchi, et al., 2013) using Twitter as data source. The current work uses 128k news articles.
Figure 13 – Number of publications grouped by the number of items (news articles) collected.
Due to scalability and timing constraints, in some cases the number of items could justify the use of big data frameworks like the Hadoop Environment (White, 2009), but among the reviewed works there was no mention about this methodology.
41
3.2.4 - Market / Index / Exchange In terms of market, the great majority of the reviewed works are devoted to predict the movements of stocks and foreign exchange (ForEx), and (Groth & Muntermann, 2011) used news articles to predict the risk when investing in stock markets.
Figure 14 - Number of publications grouped by market.
The most studied indexes are DJIA and S&P 500 (10 papers), followed by the local indexes according to authors’ country. These studies focus on predicting the price movements from stocks that compose the index, and (Makrehchi, et al., 2013) focused to forecast the whole S&P 500 index movements. The same happens for exchanges, with more studies focused on NYSE and NASDAQ, and other exchanges according to the author’s country.
42
3.2.5 - Time-Frame / Alignment offset Time-Frame means the periodicity of the predictions. Most of the reviewed works aims at predicting the market movements on a daily basis (Figure 15). (Butler & Kešelj, 2009) and (Li, 2010) made it on a yearly basis; and (Vakeel & Shubhamoy, 2014) conducted a study to predict the effect of news on the stocks before and after the elections in India.
The studies with intraday time-frame aim to predict the market movements within the trading hours, and the alignment offset represents the period between the news article is published and the asset price is affected. The most common values are between 15 and 20 minutes, but predictions with larger periods of one and three hours were also studied. This current work has the lowest alignment offset, with periods of 1, 2, 3, and 5 minutes, and it relies on the technological capacity of trading in a very short period with HFT (Johnson, 2010). Recently, an analysis about the effects of macroeconomic news on the intraday ForEx prices, with an offset of 5 minutes, was conducted by (Chatrath, et al., 2014).
43
Figure 15 - Number of publications grouped by the time frame.
3.2.6 – Period of News Collection / Number of Months In terms of the number of months collecting news articles, there is a discrepancy among the reviewed works, as can be seen in Figure 16, with most of the researches with less than six months or more than 24 months of news articles gathering.
44
Figure 16 - Number of publications grouped by the number of months collecting news articles.
Another observed aspect is the gap in years, after the news articles are collected and the results are published. According to Figure 17, in most part of the cases this gap is above three years. This approach is very common in finance, and it is known as backtesting, as some problems need more time and focus to be studied, due to the nature of financial markets.
(Vu, et al., 2012) was the only research to report an online test (i.e., the predictions were made with live news). This test was conducted between 8/Sep/2012 and 26/Sep/2012.
45
Figure 17 – Number of publications grouped by the number of years between the data collected and publication.
3.2.7 - Number of Classes / Target prediction Most of the reviewed works focus on classification, and according to Figure 18, the majority of the publications use two classes to be predicted, denoting the prices will rise or fall. The studies with three classes aim to predict if the prices will rise, fall or will be stable, and studies with four or five classes represent a finer gradient of three classes. In a different approach, this current work focuses in the best moment to buy, and uses two classes that identify the rise or stability/fall of prices.
Few reviewed works are devoted to regression (Bollen & Huina, 2011), (Schumaker, et al., 2012), (Jin, et al., 2013), and in an effort to conciliate fundamental analysis with text mining, (Tetlock, et al., 2008) used linear regression to predict companies’ earnings, and they found out that negative words have more predictive power; and more recently, (Yang, et al., 2015) used regression with abnormal sentiment scores.
46
Figure 18 - Number of publications grouped by number of classes / target prediction.
As other approaches, (Das & Chen, 2007) was one of the first works that used sentiment indicators, and applied an aggregate sentiment index aiming at predicting the stock price changes. (Schumaker & Chen, 2009) used a derivation of SVM to make discrete stock price prediction, and in order to assist the investors, (Huang, et al., 2010) used association rules to obtain a significant degree assignment of each newly arrived news.
3.2.8 - Feature Selection / Representation In text mining, the way the text content will be represented is crucial. An incorrect text representation in terms of features can lead to information loss and a meaningless outcome.
Nowadays, most research with text mining relies on bag of word (BOW) (Harris, 1954), and this is also reflected among the reviewed works, as about 2/3 of them use BOW (Figure 19). In terms of feature representation, 1/4 of the reviewed works use TF-
47
IDF (23); other 1/4 use term frequency (TF), TF-CDF, or binary representation; and most of these feature representations occur together with BOW.
TF-CDF consists in TF divided by CDF. However, the CDF calculation requires to know the class of the new article in advance. For this reason, it is not possible to use such technique in real predictive scenarios, because the class is completely unknown. In spite of that, two reviewed works used TF-CDF as part of their studies (Peramunetilleke & Wong, 2002), (De Faria, et al., 2012).
In order to reduce the dimensionality and maintain the word ordering (i.e., syntax) at a certain level, the combination of BOW and n-grams (Sidorova, et al., 2014) was applied by (Das & Chen, 2007), (Butler & Kešelj, 2009), (Hagenau, et al., 2012), (Vakeel & Shubhamoy, 2014), and this current work.
48
Figure 19 – Number of publications grouped by the feature selection, and the application of TFIDF, TF-CDF, TF or Binary representation.
In terms of representing text content as sentiment and opinion features, (Bollen & Huina, 2011), (Schumaker, et al., 2012) used Opinion Finder (Wilson & Hoffmann, 2005); while (Tetlock, et al., 2008; Nassirtoussi, et al., 2015) combined BOW with positive/negative words representation; and (Li, 2010), (Lugmayr & Gossen, 2012), (Nassirtoussi, et al., 2015), (Yang, et al., 2015) combined BOW with some type of sentiment measurement. Among the reviewed works outside the “bag of words realm”, the feature selection relies on Latent Dirichlet Allocation (LDA) (Mahajan, et al., 2008), (Jin, et al., 2013); visual coordinates (Soni, et al., 2007); simultaneous terms and ordered pairs (Huang, et al., 2010). (Wong, et al., 2014) applied a Sparse Matrix Factorization + ADMM methodology that encapsulates the feature selection, dimensionality reduction and 49
machine learning phases in a single algorithm. (Yu, et al., 2013) used a daily number of positive/negative emotions, and bullish/bearish anchor words, and (Crone & Koeppel, 2014) used 14 built-in sentiment indicators from Reuters. Recently (Fehrer & Feuerriegel, 2016) used a deep learning method (Bengio, 2009) called recursive autoencoders (Liou, et al., 2014), which combines numerical vectors, n-grams, dimensionality reduction (the auto encoder optimization) and logistic regression classifier in one algorithm.
3.2.9 - Dimensionality Reduction The text mining processing generates a large number of features, but for classification purposes, most of them do not carry any meaning or association with the underlying label (Donoho, 2000), and must be removed.
According to Figure 20, the majority of reviewed works use some type of statistical measurement such as Language Models, Information Gain, Chi-Square, Minimum Occurrence Per Document to define the most valuable features given a threshold (Forman, 2003), and normally this is combined with BOW, stemming, and stop words removal.
Another common approach is the use of pre-defined dictionaries, where the nonexisting words will be removed. Most of the dictionaries were created by specialists and have some association with the related companies/market/exchange. However, (Makrehchi, et al., 2013) used a mood list, (Tetlock, et al., 2008) used the Harvard-IV-4 to define positive and negative sentiments, and (Kim, et al., 2014) created an automated sentiment dictionary algorithm.
50
Figure 20 - Number of publications grouped by the dimensionality reduction method.
The synonym and hypernym replacement using some type of Thesaurus or WordNet (Miller, 1995) is also a promising approach for dimensionality reduction, but it was only explored by (Soni, et al., 2007), (Zhai, et al., 2007), (Huang, et al., 2010), and (Nassirtoussi, et al., 2015).
3.2.10 - Learning Algorithm Once the text content is transformed into features, the choice of a learning algorithm is also important. According to Figure 21, the most common machine learning algorithm applied to TMFP is the Support Vector Machine (SVM) (Cortes & Vapnik, 1995), followed by the Naïve Bayes (Rish, 2001), or a combination of these two or more algorithms like k-NN (Fix & Hodges, 1951), Decision Trees (Kohavi & Quinlan, 2002), and others (Wu, et al., 2007) in the same study. Among the reviewed works using Artificial Neural Networks, most of them applied the classical implementation of feed forward algorithm, but (Bollen & Huina, 2011) applied Self-Organizing Fuzzy Neural Network (SOFNN) (Leng, et al., 2005), as a combinatorial optimization approach, and (Fehrer & Feuerriegel, 2016) used a new deep learning approach called Recursive
51
Autoencoders (Liou, et al., 2014), (Bengio, 2009). Among the other learning methodologies, (Wong, et al., 2014) applied a Sparse Matrix Factorization + ADMM, but it was reported an Accuracy close to a random classifier.
Figure 21 - Number of publications grouped by the machine learning algorithm.
In terms of regression, most of the reviewed works used the Linear Regression (Tetlock, et al., 2008), (Jin, et al., 2013), (Chatrath, et al., 2014), while (Schumaker, et al., 2012) applied Support Vector Regression (SVR) for discrete numeric prediction instead of classification, and (Hagenau, et al., 2012) used SVM together with SVR as a second algorithm to predict the discrete value of stock returns.
3.2.11 - Training vs. Testing Normally in predictive machine learning, for model evaluation purposes the data is split in one set for training, and another set for testing, and for time series problems like TMFP, the order of data must be kept (Hastie, et al., 2003). It is a common sense that, in
52
most of the cases, the lower the ratio between the size of test set and training set, the better the quality of predictions in the test set, and among the reviewed works, (Nassirtoussi, et al., 2015) conducted an experiment asserting this. Figure 22 depicts the number of publications, grouped by the ratios between test and training (calculated as test size / training size . 100), and also the number of publications that used cross validation or did not provide any information about this subject.
The way the dataset is split for model evaluation is crucial for predictive analytics, but according to Figure 22, unfortunately almost 1/3 of the reviewed works did not provide this information, and specifically for (Yang, et al., 2015), the results of their works are not applicable for prediction, because the model evaluation was applied in the training set. Another concern is the use of cross validation in 14% of the reviewed works, as this procedure disrupts the natural order of a time series, giving to classifier model an unfair advantage, as information from the future is used to predict events in the past, making the resulting models unreliable for prediction. A complete discussion about the use of cross validation for TMFP will be conducted in section 5.4.
The data splitting between 20% and 50% is the second most frequent group, and ratios between this range are a common practice in machine learning. Recently (Wong, et al., 2014) used an additional validation set to evaluate the model, before it is applied to the test set, which is becoming a common practice with the advent of data mining competitions at Kaggle 2.
2
http://www.kaggle.com
53
Figure 22 - Number of publications grouped by the percentage of test size/training size, cross validation and not informed.
In order to maximize the performance of predictive models, there is a group of reviewed works (this current work included) with splitting rations lower than 5%. On the other hand, there is another group with proportions of training and test above 50% and values of 71%, 80%, 100% and 1650% (Mittermayer, 2004).
3.2.12 - Sliding Window As mentioned in the previous section, in most cases, the lower the ratio between the size of test set and training set, the better the quality of predictions in the test set. In the case of time series, one of the techniques to maximize the size and quality of the training set is known in the literature as sliding window (Dietterich, 2002).
The concept of sliding window can be explained by, a dataset is split in 10 blocks, where seven blocks are designated for training, and three blocks for testing. But instead of performing the test along the three blocks together, the evaluation is performed in the first test block, then after the first block from the training set is discarded and the first test
54
block is added to the training test, the classifier is rebuilt, then the evaluation is performed to the second test block, and then the process repeats until all the test blocks are evaluated, as exemplified in Figure 31. The experiments demonstrated in Chapter 5 show that the sliding window is a suitable approach for time series, as it adjusts the classifier model to the new reality occurring at the edge of the problem (the new market conditions), and it discards old concepts and events occurred at the beginning of the training set. Despite these advantages, only 22% of the reviewed works applied this technique: (Wuthrich, et al., 1998), (Peramunetilleke & Wong, 2002), (Tetlock, et al., 2008), (Butler & Kešelj, 2009), (Vu, et al., 2012), (Jin, et al., 2013), (Vakeel & Shubhamoy, 2014), (Nassirtoussi, et al., 2015), and this current work.
3.2.13 – Sentiment Analysis The purpose of the Sentiment and Emotional analysis is to extract and measure the sentiments preserved in the text content, and it is widely used in product evaluation and consumer feedback (Pang, et al., 2002), (Cambria, et al., 2013).
According to Figure 23, among the reviewed works, the use of sentiment analysis for TMFP started in 2007, by (Das & Chen, 2007) in a work initiated before 2004, which applied an assembly of different classifiers to extract the investor sentiment from message boards, in order to predict a similar behaviour of stock price changes, presented as a chart visualization and a correlation table of sentiments and stock returns. Unfortunately, it was not possible to extract any classification measurements because the published confusion matrix was not square. In an attempt to predict companies’ earnings in a long-term period, (Tetlock, et al., 2008) used the Harvard-IV-4 psychological dictionary to define positive and negative sentiments, and they have found that negative words have more predictive power for fundamental analysis. After a pause of three years (after the 2008 crisis), this technique just started to be applied again in 2011, achieving a peak in number of publications in 2012, motivated by a sudden interest in sentiment analysis applied to behavioral finance, and being a predominant subject in the reviewed works of 2013.
55
Figure 23 - Number of publications grouped by application of sentiment analysis.
Restarting from 2011, (Bollen & Huina, 2011), and (Schumaker, et al., 2012) used Opinion Finder (Wilson & Hoffmann, 2005) to measure the emotional polarity (positive and negative) of the sentences, in an effort to predict the price movements in the stock market. (Vu, et al., 2012) used Twitter Sentiment Tool (Go, et al., 2009) to determine the polarity of sentiments from Twitter posts, and define the level of confidence the consumers have in a company, to predict the daily outcome of NASDAQ stocks. For this task, a Part-of-speech (POS) tagger proposed by (Gimpel, et al., 2011) was applied to extract adjective, noun, adverb and verb words and associate them as anchor words to “bullish” and “bearish” sentiments. .
In 2013, (Jin, et al., 2013) applied topic clustering methods and used customized sentiment dictionaries to uncover sentiment trends by analysing relevant sentences, and (Makrehchi, et al., 2013) used a pre-defined mood word list, obtaining a gain of 20% above the S&P 500 in three months of investment simulation. To analyse the effect of social and conventional media, their relative importance, and their interrelatedness on short term firm stock market performances, (Yu, et al., 2013) used a Naïve Bayes
56
algorithm and the Cornell Movie Review dataset3 to identify positive and negative words, to explore the document-level polarity and generate 20 sentiment scores for 862 companies. These sentiment scores were applied with an econometric coefficient, and compared with their respective market performances (e.g., return and risk). They found out that blog sentiment has a positive impact while forum sentiment has a negative impact on return, and both blog and Twitter sentiment have a positive effect on risk. Further, they found out the interaction effect between Twitter and news sentiment has a significant negative effect on returns, but not a significant effect on risk.
In 2014, (Kim, et al., 2014) developed an algorithm for automatic discovery of sentiments to form a dictionary. Nowadays, several vendors are specialized in providing news feeding services embedded with sentiment attributes, and (Crone & Koeppel, 2014) used 14 built-in sentiment indicators from Reuters MarketPysch to predict ForEx movements.
Recently, (Nassirtoussi, et al., 2015) developed a muti layer architecture, with one of the layers devoted to sentiment integration using SumScore Features and SentiWordNet dictionary, and (Fehrer & Feuerriegel, 2016) used a variant of recursive autoencoders (Liou, et al., 2014), which includes an additional layer in each autoencoder, to extract and predict sentiment values.
3.2.14 - Semantics Semantics deals with the meaning of the words, and according to Table 17, more than half of the reviewed works used some semantics approach, but in general it was only applied to discover word relationships like synonyms and hypernyms, aiming at the word weighting and dimensionality reduction, by weighing or replacing related words using a thesaurus or WordNet (Miller, 1995).
3
Polarity dataset v2.0 URL: http://www.cs.cornell.edu/people/pabo/movie-reviewdata/.
57
3.2.15 - Syntax Syntax deals with the sequence and grouping of words, but according to Table 17, less than 1/3 of the reviewed works used some syntax methodology, and in general, the use of n-grams was a common practice. (Das & Chen, 2007) applied triplets, i.e., a sequence of an adjective or adverb, followed or preceded by two words; (Schumaker & Chen, 2009), (Hagenau, et al., 2012) applied noun-phrases, i.e., a phrase composed of a noun (substantive) and the modifiers (articles, possessive nouns, possessive pronouns, adjectives, and participles); and (Vu, et al., 2012) applied part-of-speech (POS) tagger to extract adjective, noun, adverb, and verb words and fixed them to “bullish” and “bearish” as anchor words.
3.2.16 – Data Balancing Normally in financial market prediction, the opportunities to obtain profit are rare events, and this is reflected in the underlying data, with a majority number of examples representing no changes, and a minority of examples representing the best moment to buy or sell shares and other securities. This condition denotes an imbalanced dataset (Weiss & Provost, 2001), and it brings some problems for supervised learning. A detailed study about data balancing will be conducted in section 4.3, but one of its undesirable effects is the inappropriate use of classification measures, and especially in the case of Accuracy, it does not consider the number of examples distributed between the majority and minority classes.
Despite the importance of data balancing for TMFP, among the reviewed works, only six studies paid attention to this subject (Peramunetilleke & Wong, 2002), (Mittermayer, 2004), (Soni, et al., 2007), (De Faria, et al., 2012), (Makrehchi, et al., 2013), and this current work. The remaining works barely cited the existence of this problem in their studies, but as depicted in Table 16, about 50% of the results were published only as Accuracy, which made most of these results questionable, and raises serious concerns in this branch of research, as it undermines the investor’s confidence.
A hypothesis to explain why there are few publications in this branch of research, and why this number continues decreasing in the last years, is the lack of confidence from 58
investors on the application of TMFP in a real investment scenario, mostly caused by the problems identified above and in section 3.2.11, which for instance, is reflected in the academic interests and activities.
In order to contribute to revert this lack of confidence scenario, the next chapter will present the methodology proposed in this work.
59
60
Chapter 4 – Methodology With the purpose of build models to predict the price changes with text mining, a long and automated process is necessary, from the collection of news and stock prices, the treatment of this textual data into a bag of words vector, training, test, and simulation. All the TMFP process was developed with the RapidMiner platform and its respective extensions (Mierswa, et al., 2006), and the innovation proposed in this work was developed in a new extension called TradeMiner (Figure 24), following the instructions in (Land, 2010).
Figure 24 - Screenshot of RapidMiner desktop with a workflow using TradeMiner operators.
The main processing flow can be seen in Figure 25, and it was repeated for each company listed in the Dow Jones Index (DJIA) during the time the data was gathered, with each company owning a predictive model. As mentioned, only data mining and text mining techniques will be used, no econometric techniques will be applied during this process. Each sub-process from Figure 25 will be explained in the next sections.
61
Figure 25 – The text mining modelling process applied to price change prediction in financial market.
4.1 – Data Gathering The first step in the TMFP process is to obtain data. For this purpose, the news articles and stock prices will be collected from the internet to form the experiment’s dataset, commonly known in finance as backtesting.
4.1.1 – Obtain news The process starts with the gathering of news articles, also known as documents, from the internet. To make this possible, a web crawler (Dhaka, et al., 2013) was developed using the RapidMiner´s Web Mining extension. This web crawler acted as a client for Rich Site Summary (RSS) feeds, and it started under test from April/2012, and stayed in full operation from January/2013 until September/2013, collecting 128,195 news articles related to the 30 companies listed in DJIA, with the total size of three gigabytes of data.
62
The source of news came from Yahoo Finance4, and Google Finance5. Both engines use an entity identifier algorithm similar to (Carpenter, 2007), which makes possible to retrieve news articles associated with the company´s stock symbol.
Each news article record is composed of the news content in English, the stock symbol, and the published date and time in the time zone where the stock is traded, in the case of DJIA, the Eastern Standard Time (EST). Later, the published date and time are converted from EST to UTC. For the news articles released when the markets are closed, the publication date and time to be considered are the exchange opening time in the next available trade date. For example: the news published Tuesday night will only be considered on Wednesday 14:30 UTC, news published during the weekend will only be considered on Monday 14:30 UTC. The news articles records are strictly stored and processed in their chronological order.
4.1.2 – Obtain market data To obtain the stock prices (also known as market data) associated with the companies under study, a web service client was developed in Java language. The source of market data was supplied by a free web service6, which provides minute by minute stock prices and other quantitative values from the companies negotiated at NYSE and NASDAQ exchanges. Some complementary market data was also retrieved from EODData7
This web service client also started under test from April/2012, and stayed in full operation from January/2013 until September/2013, collecting 1,929,522 market data records related to the 30 companies listed in Dow Jones Index (DJIA), with the total size of 700 megabytes of data.
Each market data record consists of the stock symbol, the close price from the day before, the open price, the last price traded at that minute, and the respective date and
4
http://finance.yahoo.com http://finance.google.com 6 http://www.restfulwebservices.net 7 http://eoddata.com 5
63
time, in the Eastern Standard Time (EST), and the same date and time in UTC. The market data records are strictly stored and processed in their chronological order.
4.1.3 - Text Cleaning This step removes the existing HTML tags in the textual content, and deletes news articles records where the remote text content is inexistent or decommissioned, i.e., the text content has messages related to page not found or broken links.
4.1.4 - Stock Price Labeling Once the market data is available, it's necessary to identify the higher and the lower prices, and assign a label, also known as class value, to each record. In this work, the market data records were labeled as SURGE, and PLUNGE, and the rest of records were labeled as NOT RECOMMENDED. These labels are respectively identified as 2, -2, and 0 in the database. Table 1 summarizes these labels and their respective creation rules and usage.
Table 1 - Summary of labels used in this work.
Label
Description
Label in Investment Database recommendation
SURGE
Prices with rise >= 75% of the 2 maximum
ascent
Buy
observed
during the day. PLUNGE
Prices with fall