Engineering Management Journal Vol. 5 No, 3 September 1993
24
A TUTORIAL ON QUALITY FUNCTION DEPLOYMENT A. Terry Bahill, University of Arizona, and William L, Chapman, Hughes Aircraft Co.
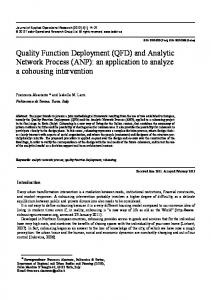
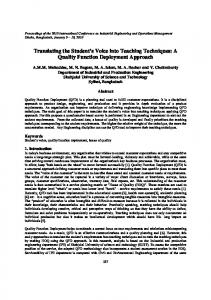
ABSTRACT Quality function deployment (QFD) helps to introduce the idea of quality in early phases of the design cycle and to reevaluate quality considerations throughout the system's entire life cycle. This article presents a tutorial example of using QFD to design a product. It shows which quality controls in the manufacturing process are most important to ensure customer satisfaction, Introduction Over the past 40 years, the Japanese have developed many techniques for improving quality in manufacturing processes. One of these, quality function deployment (QFD), is becoming very popular in both Japan and the United States. QFD started in Japan in the late 1960s and is now used by over half of Japan's major companies. It was introduced in American automobile manufacturing companies in the early 1980s; now many of our major corporations are using it, including John Deere, Ford, Chrysler, General Motors, Hughes Aircraft, Boeing, McDonnell Douglas, Martin Marietta, Texas Instruments, Hewlett Packard, Westinghouse, and 3M, QFD is the jewel of the collection of tools now being called total quality management (TQM). QFD strives to get the idea of quality introduced in early phases of the design cycle and to reevaluate quality issues throughout the product's entire life cycle. In most implementations, QFD uses many matrices to discover interrelationships between customer demands, product characteristics, and manufacturing processes, as shown in Exhibit 1. For example, the first QFD chart compares the customer's demands to quality characteristics. The second chart then investigates the relationships between these quality characteristics and characteristics of the product. The third chart subsequently examines the relationships between these product characteristics and manufacturing processes. Finally, the manufacturing processes are compared to the quality controls that will be monitored during manufacturing. An example will now be given for each of these charts. QFD presents the data in a user-friendly format. The Japanese philosophy is that everyone participates in
This refereed tutorial was accepted by Ha! Rumsey, Associate Editor, May 1993.
improving the product. Therefore, all system design tools should be usable by the chief scientist with a doctor of philosophy degree and the janitor with a high school diploma. As a result, QFD tools are mathematically simple. ToothBrite Inc.: A Heuristic Case Study
At this point, we are going to branch away from the generic and focus on a specific example to illustrate the QFD process. Assume that you are the chief executive officer of ToothBrite Inc,, a major toothpaste manufacturer, About the Authors A. Terry Bahill has been a professor of systems engineering at the University of Arizona in Tucson since 1984. He received his Ph.D. in electrical engineering and computer science from the University of California, Berkeley, in 1975. His research interests are in the fields of modeling physiological systems, eye-hand-head coordination, validation of expert systems, concurrent engineering, total quality management, and systems design theory. He has tried to make the public appreciate engineering research by applying his scientific findings to the sport of baseball. He is the author of Bioengineering: Biomedical, Medical, and Clinical Engineering (Prentice-Hall, 1981), Keep Your Eye on the Ball: The Science and Folklore of Baseball (with R. G. Watts; W. H. Freeman, 1990), Verifying and Validating Personal Computer-Based Expert Systems (Prentice-Hall, 1991), Linear Systems Theory (with F. Szidarovszky; CRC Press, 1992), and Engineering Modeling and Design (with W. L. Chapman and A. W, Wymore; CRC Press, 1992). He is a registered professional engineer, the editor of the CRC Press Series on Systems Engineering, and a fellow of the Institute of Electrical and Electronics Engineers (IEEE). William L. Chapman is a scientist/engineer with Hughes Aircraft Company in Tucson, Arizona. He has worked for Hughes Aircraft since 1979 in a variety of areas, including PWB manufacturing, CAD/CAM, engineering, and electronic data systems. He is currently on staff to the development division promoting total quality management tools such as QFD, DOE, and SPC. He received his master's degree in systems engineering from the University of Arizona and is currently a Hughes Fellow and a Ph.D. candidate in systems and industrial engineering, He is the author of Engineering Modeling and Design (with A. T. Bahill and A. W, Wymore; CRC Press, 1992). Contact: Dr. A. Terry Bahill, Systems and Industrial Engineering, University of Arizona, Tucson, AZ 85721, phone: (602) 621-6561, e-mail:
[email protected].
25
Engineering Management Journal VoL 5 No. 3 September 1993
Quality characteristics
g-8 §§ •
Product characteristics
Manufacturing processes
o o =3 O
11 a. o =f 0> «S
Exhibit 1. The QFD waterfall chart.
and your market share has suddenly dropped. You suspect this is the result of your competitor's new innovation. Crest® has developed a new toothpaste container called the Neat Squeeze dispenser and has endowed it with a substantial advertising budget. (To understand this example better, you might want to cut open a Crest Neat Squeeze dispenser and see what is inside.) The function of Colgate®'s new Stand-Up Tube is similar. To recapture your market share, you decide to redesign your product. Therefore, you plan a QFD analysis of your product. To begin with, you must find out what your customers want. Our Marketing Department asked all people who should provide input for the system design what they thought was important. In the QFD literature, the aspects deemed important by the customer are variously called demands, wants, expectations, requirements, and needs. We will use only the term customer demands. Based on customer surveys, we derived the following customer demands:
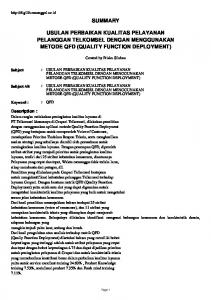
No Waste—Almost all the toothpaste comes out but not all over the bathroom. Small Footprint—Container takes up little counter space. Reasonable Cost—It should cost about the same as present containers. Attractive Container—The Sales Department says it must look good. By attractive container we mean that is must look good on the shelf in the store and also on the counter in the bathroom. Quality Perhaps we should have divided this up controls into two customer demands, but we did not. It is easy to continually second guess the categories. We advise that you review them once and move on. You can always go back and change things later. After listing the demands, the customer assigns a weight indicating the relative importance of each demand. Usually the weights are between 1 and 10, with 10 being the most important. Exhibit 2 shows the customer demands and the associated weights for the ToothBrite Project. Sometimes these weights are pulled out of the air by the customer's expert. Sometimes they result from group discussions. And sometimes they are derived using quantitative decision-aiding tools such as the analytic hierarchy process (Saaty, 1980; Bahill, 1991). In this chart, it seems that our customer is the person that brushes his or her teeth with the toothpaste. However, the term customer includes all people who should provide input for the system design: buyers, store managers, mothers, stockholders, employees, company management, and the company's Manufacturing and Marketing departments. (Chapter 5 of Chapman, Bahill, and Wymore [1992] explains this more fully.) To suggest the possibility of including these other facets of the customer on this or parallel QFD charts, we now include two demands that are appropriate for the company: Company Demands:
Customer Demands: Neatness Tidy Tip—The tip stays clean and neat. Retains Shape—The container retains its original shape. Stays Put—The container does not roll off the counter. Hygienic—Toothpaste that touched the brush cannot be drawn back into container. Squeezable—People want to squeeze the container, they do not want a pump. Easy Open—The cap opens and closes easily.
Time to Market—the amount of time needed before the product can be sold Return on Investment—profit divided by money and value of facilities provided. Next, we asked our Systems Engineering Department to derive measures to assure that these customer and company demands are satisfied. In the QFD literature, such measures are called quality characteristics; generally in systems theory, they are called figures of merit. Quality character-
26
Engineering Management Journal Vol. 5 No. 3 September 1993
0 0
CD
o c 0 Q_
E Customer Neatness Tidy Tip Retains Shape Stays Put Hygienic Squeezable Easy Open No Waste Small Footprint Reasonable Cost Attractive Container Company Time to Market Return on Investment
10 4 4 7 4 6 6 5 9 8 5 9
Exhibit 2, Customer demands with their associated weights,
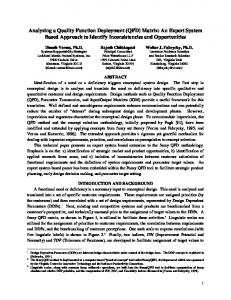
isties should be quantitative and measurable. These are the quality characteristics for the ToothBrite Project: Quality Characteristics: Mess—amount of toothpaste scraped off tip when half empty Pull-Back—amount of toothpaste pulled back when done dispensing Pressure—pressure needed to get the toothpaste out Effort—number of turns or time or effort needed to remove cap Waste—amount of toothpaste left in container at end of life cycle Counter Space—amount of counter space occupied by container Deformation—amount of change in shape of container when half empty Pleasing Appearance—based on customer survey results Cost to Produce—cost to manufacture the product Selling Price—sales price for one item Time to Develop—time needed to develop the product.
In general, QFD charts have something listed on the left and something listed along the top, as shown in Exhibit 3. The things listed on the left are called the Whats and the things listed along the top are called the Hows. To help determine the Hows we ask, "This is what the customer wants, now how can we measure it?" The next step in a QFD analysis is determining the strength of the relationships (or the degree of correlation) between the Whats and the Hows. This is done by filling in the central matrix as shown in Exhibit 3. Each element of the Whats is compared to each element of the Hows. Four classifications are given. If they are strongly related, a value of 9, or a black disk with a white dot inside, is recorded in the appropriate cell. Moderate relationships are given a 3, or a circle. Weak relationships are given a 1, or a triangle. No relationship is given a 0, or the cell is left blank. The logarithmic 9-3-1 weighting was created by the Japanese and has been adopted by most QFD users. These correlations are sometimes represented with symbols and sometimes with numbers. In fact, sometimes we use both in the same chart, as in Exhibit 3. You should use whatever will make your customers most comfortable. Different symbols may even be used, because the foremost principle of QFD is "copy the spirit, not the form" (Akao, 1990), Each relationship can be either positive or negative. We want to know whether each customer demand can be measured by a quality characteristic, not whether it shows a positive or a negative relationship. If any row of this matrix is blank, then we cannot assure satisfaction of that customer demand; that demand, therefore, should either be eliminated or another quality characteristic should be added. Usually numerous customer demands are generated initially. And then, to save work, the least important ones are deleted. However, the deleted items should be recorded to assure future designers that these customer demands were indeed considered. The next step is multiplying each cell's value by the weight of the customer demand and totaling the column for each quality characteristic. This is shown in the row labeled "Score" in Exhibit 4. The total score for each column indicates the importance of that characteristic in measuring the customer's satisfaction. Typically measures with low scores receive little consideration. However, this does not necessarily mean that they will not be used in the product design: They may still be necessary for contractual or other reasons. To satisfy the customer, we must pay strict attention to the measures with the highest scores. This attention to the customer is the main purpose of the QFD chart. The chart and its results are not as important as the process of concentrating on the "voice of the customer" rather than the "voice of the manufacturer." For the ToothBrite Project, the cost to produce (with a score of 256) and the selling price (with a score of 249) were the most important measures.
Engineering Management Journal Vol. 5 No. 3 September 1993
Customer Neatness Tidy Tip Retains Shape Stays Put Hygienic Squeezable Easy Open No Waste Small Footprint Reasonable Cost Attractive Container Company Time to Market Return on Investment
LU
0
0
0
0
c
Z5 0


![[PDF] QFD: Quality Function Deployment - Google Sites](https://m.moam.info/img/260x300/pdf-qfd-quality-function-deployment-google-sites_6477c7f9097c4744708c185c.jpg)