A TV Program Recommendation System Based on Big Data Mengyi Zhang, Minyong shi, Zhiguo Hong, Songtao Shang and Menghan Yan Department of Computer, Communication University of China, Beijing, China Correspondence should be addressed to Mengyi Zhang;
[email protected] Abstract—With the development of science and technology, more people especially young teenagers do not want to pay more attention to traditional TV programs. Nowadays the challenge of traditional TV station is how to attract the audience’s attention, so as to improve the audience rating of tradition TV programs. This paper proposes a recommendation system, which can improve audience rating. This system mainly contains three modules. Data gathering module is responsible for collecting audience rating data about TV programs on the Internet. Data mining module is responsible for analyzing the audience ration data, and finding interesting programs that the audiences want to watch. This program recommendation system is designed to improve audience rating, and catch the attention of audiences. The system is based on massive user data, and data mining algorithms to analyze the user’s interests. Compared with traditional recommendation system, it is capable for Big Data and easier for TV station to recommend TV programs in which audiences are interested, as a way to adds vitality to the television industry. Keywords—Big Data; program recommendation system; data mining
recommendation;
I. INTRODUCTION With the development of mobile Internet, the traditional TV industry is facing threats and challenges. This is because Big Data is changing the traditional industry. The primary task of traditional TV industry is how to take the advantage of Big Data technology. For traditional TV programs, audience rating is the metrics whether the program is good or not. Therefore, how to improve the audience rating is an urgent issue for traditional TV programs. This paper proposes a TV program recommendation system. The system is based on Big Data technology, which can automatically push programs to audience according to their hobbies. It can be widely applied to the program of selecting hot topic, content production, broadcasting, publicity, and so on [1]. The recommendation system of traditional television is mainly based on audience rating, which reflects the audience’s attitude towards the program. In China, the audience rating is tested through STB (Set-Top-Box) which is a device installed
978-1-5090-0806-3/16/$31.00 copyright 2016 IEEE ICIS 2016, June 26-29, 2016, Okayama, Japan
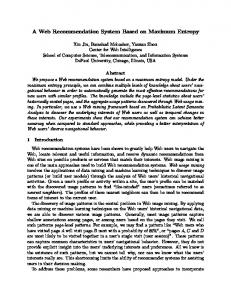
in user’s home. If the user watch a particular program, and the watching time reaches a certain length of time, STB will record the data. All the data, including every watching program, watching length of time, watching the time, etc., will upload to the server [2]. By analyzing the data, the TV station can calculate each program’s audience rating. However, there is a very big shortage in this method, for example, the smallsample data are selected randomly, and cannot fully reflect the overall audience rating among audience groups [3][4][5]. Due to the data shortage, the recommended programs are often not satisfactory as expected. In general, the TV producers can draw up a TV schedule according to their work experience [6]. However, the TV schedule may not be interested by the audience, and cannot bring real benefits to TV station. Especially in the era of big data, the traditional method of making the TV schedule is not reliable. Facing with the impact of new media and the Internet, people are no longer acquiring information through watching TV. They prefer to watch TV from the Internet, and the online videos. In great development of the Internet era, we need more professional methods to analyze the TV rating. This system is based on the Hadoop framework, which can analyze the massive text data from the network and the STB. The data from the Internet, such as Baidu billboard, Sohu news, Sina Weibo, WeChat, and so on. Then, through the method of relevance analysis [7][8], we can assess the attention and viewership situation of television programs accurately, and make the TV producers know the hot topics. II. TV PROGRAM RECOMMENDATION ANALYSIS To apply Big Data technology into TV programs recommendation, the core work is to use data mining analysis algorithms on the massive database. One of the important things is that the diversity of television programs makes recommendation algorithms different. For example, for news, current affairs and drama series we need to analyze the audience’s watching characteristic respectively. Hence, we can analyze the program’s features as follows: 1). program ratings, 2).television ratings, 3).program type, 4).program broadcast time. The four aspects are shown in Fig. 1.
Recommended data analysis program
TV program ratings
Television ratings
Program Type
Program broadcast time
Fig. 1. Recommended data analysis program
A. TV Program Ratings Analysis The preparation work of TV program ratings analysis is to download the TV program’s lists data. In this paper, we use web crawler to download the data automatically. The program’s lists data contains 55 channel TV programs. The past three month’s data is effective for the recommendation system. There are many professional data analysis software that can help us to analyze the TV program’s data, and we can obtain the results easily, such as the highest ratings, the user’s play time and different program types. However, the main purpose of analyzing the programs data is to dig out the hidden value of these data. Furthermore, the potential or existed excellent types of programs will be recommended to audiences. Meanwhile, the program is converted from the concept of a product to a commodity, so as to better meet the demands of the market and maximize the value. Comparing average ratings of CCTV-1 from August to September in 2015, we find out significant difference between the two months. Ratings are more undulate in August than those of in September. Through calculation and analysis, we get a result about the ratings. The result presents that average ratings of August is 0.0005760359, and average ratings is 0.002009892 in September. In addition, the data chart of August shows that there are high ratings on August 2, August 21 and August 29. By accident, these days are weekend. Then, we do the same analysis of ratings in recent months. On the other hand, through viewing the play list of program that we found that there is no obvious difference on the list in a month. Therefore, we draw the conclusions that the weekend is the cause of make ratings increasing. For the all data of ratings, we calculated an average. The CCTV-1 ratings of August are shown in Fig.2, and that of September are shown in Fig.3.
Fig. 2. The CCTV-1 ratings in August
Fig. 3. The CCTV-1 ratings in September
B. Program Broadcast Time Analysis Whether the program’s ratings is high or low, the data of database is very meaningful for mining valuable information. Analyzing ratings of television programs is very valuable. Program ratings are the lowest at midnight of a day, which is affected by audience’s living habits. People generally sleep at midnight. Thus, analyzing the time of program broadcast by data mining can maximize interest for TV station. Therefore, the TV station can obtain the maximum benefit by planning. To study the effect of broadcast time on ratings (broadcast time is independent variable, ratings is dependent variable), firstly, we need to put other variables constant, and conduct a regression analysis. At the beginning, we choose a sample from database. We get a rule from the sample, and verify the other samples have this rule through using the data-mining algorithm. As shown in Table 1 is the programming list of Oriental TV on August 8, 2015, it is clear to see that the time of highest rating is in the period from 19:32~23:42, the rating of which is more than 1ă. In order to ensure its regularity, we verify the same type of database for all TV stations. We can draw the conclusion that daily peak of television ratings will appear in this period of time. So the period of time is the best time for various companies using ads to obtain maximal benefits. However, for non-satellite TV type of television stations, the time period of highest rating may not be the same. Take CCTV-2 television station for example, it is in the period from 18:00~20:00.
TABLE I.
AUGUST 8, 2015 ORIENTAL TV RATINGS
date
start_endTime
2015-08-08
00:00:00~00:24:00
name ᡁԜ 15 њ
0.000248059
2015-08-08
00:25:00~01:27:00
ᶱ䲀ᡈ(䟽)
0.000227852
2015-08-08
01:28:00~01:47:00
ᶱ㠤
0.000118762
2015-08-08
01:48:00~01:56:00
ᰦቊ≷
0.000063690
2015-08-08
01:57:00~02:59:00
ᶱ䲀ᡈ(䟽)
0.000067189
2015-08-08
03:00:00~04:29:00
ᶱ䲀ᡈ(䟽)
0.000048890
2015-08-08
04:30:00~05:57:00
ᶱ䲀ᡈ(䟽)
0.000046765
2015-08-08
05:58:00~06:17:00
ѫ䀂傮ࡠ-⅒ҀௌӪ
0.000063435
2015-08-08
06:18:00~06:59:00
ᆀॸ㓯
0.000101612
2015-08-08
07:00:00~08:12:00
ⴻьᯩ
0.000221593
2015-08-08
08:13:00~08:52:00
ৼ䇠
0.000228744
2015-08-08
08:53:00~09:39:00
⧟⨳Ӕ৹⛩
0.000286421
2015-08-08
09:40:00~10:30:00
2015 ᒤབྷ࡙㊣ޠцঊՊѝഭഭᇦ侶ᰕ
0.000345782
2015-08-08
10:31:00~11:02:00
ሿ⡨ྸ 29
0.000425124
2015-08-08
11:03:00~11:29:00
ሿ⡨ྸ 30
0.000506295
2015-08-08
11:30:00~11:59:00
▞ㄕཙл
0.000472487
2015-08-08
12:00:00~12:27:00
ьᯩབྷཤᶑ
0.000467052
2015-08-08
12:28:00~12:36:00
ьᯩᯠ≄䊑
0.000399959
2015-08-08
12:37:00~13:10:00
ሿ⡨⡨ 27
0.000486537
2015-08-08
13:11:00~13:46:00
ሿ⡨⡨ 28
0.000485320
2015-08-08
13:47:00~14:16:00
ሿ⡨⡨ 29
0.000533923
2015-08-08
14:17:00~14:44:00
ሿ⡨⡨ 30
0.000670536
2015-08-08
14:45:00~16:36:00
ᶱ䲀ᡈ(䟽)
0.000764297
2015-08-08
16:37:00~17:02:00
䖖ц⭼
0.000491351
2015-08-08
17:03:00~17:29:00
ᶱ㠤
0.000391502
2015-08-08
17:30:00~17:59:00
ၡҀᱏཙൠ
0.000785534
2015-08-08
18:00:00~18:59:00
ьᯩᯠ䰫
0.000845389
2015-08-08
19:00:00~19:31:00
䖜ѝཞਠᯠ䰫㚄
0.000724839
2015-08-08
19:32:00~20:24:00
ሿ⡨ྸ 31
0.001407560
2015-08-08
20:25:00~21:09:00
ሿ⡨ྸ 32
0.001852710
2015-08-08
21:10:00~22:55:00
ྣ⾎ᯠ㻵
0.001639750
2015-08-08
22:56:00~23:42:00
Ӻ 80 ਾ㝡ਓ⿰
0.001029650
2015-08-08
23:43:00~01:20:00
ྣ⾎ᯠ㻵(䟽)
0.000463199
C. TV Ratings Analysis For TV ratings analysis, it is essential to operate horizontal comparison analysis of multiple television ratings. If we only analyze one TV station, the content of program is single. Instead, comparing with other TV station makes it possible to pluralist. Thus, grasping user’s fascinations and requirements towards various kinds of programs, excavating further valuable personalized features of users, and finally achieving the goal of providing a more targeted service, all of these will be actualized through the way of comparing the distinctions between different TV stations. A number of variables should be fixed before analyzing program ratings on varieties of television stations. This is multiple regression analysis method. Select four hottest satellite TV stations (Dragon TV, Hunan Satellite TV, Jiangxi
attention
Satellite TV and Zhejiang Satellite TV) from the database, and analyze ratings on prime time (19: 00-00: 00). Among the mass data, only the high ratings on Saturday are analyzed. And sampling on time period with high ratings makes it more conducive to find the gap between TV stations. It can be visually seen from Histogram in Fig. 4 that four TV ratings vary in prime time period. Obviously, Dragon TV ratings are higher than those of TV stations, and ratings of Jiangxi satellite TV is the lowest among four TV stations listed above. Based on similar methods, we further analyze data of satellite TV station on the quarter and the annual average rating. After data processing, data of average viewership for four satellite TV on prime time in August, are shown in Table 2.
TABLE II.
AVERAGE RATINGS OF FOUR TV PRIME TIME
Dragon TV
Hunan Satellite TV
Jiangxi Satellite TV
Zhejiang Satellite TV
8/1/2015
0.000586190
0.002875958
0.000180948
0.001666647
8/8/2015
0.000512479
0.002479722
0.000111584
0.001365663
8/15/2015
0.000262287
0.002612161
0.000100976
0.001518474
8/22/2015
0.000419213
0.002593164
0.000106860
0.001431537
Fig. 4. Television program ratings compare
D. Program Type Analysis The effective way to get a high rating is depend on the program, and that whether it is well-made or whether the content is interesting enough to attract the audience. We collect the data that may affect the content of the program. Television program recommendation system needs to crawl the network data corresponding to program, such as program’s type, name, presenters, actors, directors, and so on, and then analyze them in a systematic way. To analyze the impact of program types on the ratings, we have to reduce the impact of other factors on the ratings. To exclude effects of other external factors, we focus on analyzing the different types of programs on a channel at same time, such as in weekend. By analyzing the data from July to October, we extract ratings data of Hunan Satellite TV from the database. Additionally, the program ratings data on prime time period of Saturday is analyzed. Within three months, every day from 19:20 to 20:20, dramas are broadcast. From 20:20 to 22: 00, the variety show, Happy Camp, is played. The system analysis shows that the average rating was 0.004811832 from 19:35 to 20:20, and that from 20: 20 to 22:00 was 0.009975113. As apparent from the numeric value, different types of programs make different effects on ratings. Method of data mining can obtain the audience’s favorite types of programs by massive amounts of data. The method also applies to the program of hot news. For example, through Baidu Billboard and some other data websites, we capture the hot news published in the intraday top 50 of the ranking list. The system can screen out the sensitive words and invalid entries, and analyze searching heat of the data. Eventually it will display keywords of hot news by data visualization.
After data filtering, Baidu index’s data on October 18, 2015 are shown in Fig. 3. Some of the data are in Table 3 for the top 50 hot news on Baidu livelihood columns. TABLE III.
BAIDU INDEX
id
keyword
hits
1
㘱Ӫ䮯唁ਁᦒᯠ⢉
206076
2
8 ⭧ᆙᲪ୶ 146
88397
3
⢋㚹ᒢᰐ⢋㚹ᡀ࠶
88397
4
⭧ᆀᛓ⯵ྲ⋉Ӫ
77464
5
䓢䊚䖖ᫎᰲ䍥অ䖖
70215
...
...
...
The number of clicks is used to calculate the word font size. Its conversion formula is: fontsize =
(heat − min(heat )) × (max( font ) − min( font )) +8 max(heat ) − min(heat )
(1)
Where, the fontsize is the Word Cloud’s font size. The heat is the current term of clicks. The min(heat) and the max(heat) are respectively minimum and maximum clicks in 50 entries. The min(font) and the max(font) are the minimum, maximum font size settings respectively. The Word Cloud is shown in Fig. 5:
Fig. 5. Word cloud
REFERENCES [1]
III. CONCLUSION In summary, there are errors of program ratings in traditional recommendation system, and the TV program list is affected by human emotion as well. Our TV Program Recommended system based on Big Data reasonably gives solution to those drawbacks. According to the mass data collected and multi-dimensional analysis, we can find the most beneficial television broadcast playbill, and discover the hot topics. On the basis of this paper, further work on detailed data of audience’s behavior can be carried on.
[2]
[3] [4]
[5]
ACKNOWLEDGMENT This paper is partly supported by “the Excellent Young Teachers Training Project (the second level, Project number: YXJS201508)”, “Key Cultivation Engineering Project of Communication University of China (Project number: 3132016XNG1606 and 3132016XNG1608)”, “Cultural technological innovation project of Ministry of Culture of P.R.China (Project number: 2014-12)”, and partly supported by “The comprehensive reform project of computer science and technology, department of science and Engineering”. The research work was also supported by “Chaoyang District Science and Technology Project (CYXC1504)”.
[6]
[7]
[8]
Oh J, Sung Y, Kim J, et al. Time-Dependent User Profiling for TV Recommendation[C]//Cloud and Green Computing (CGC), 2012 Second International Conference on. IEEE, 2012: 783-787. Verma J P, Patel B, Patel A. Big Data Analysis: Recommendation System with Hadoop Framework[C]//Computational Intelligence & Communication Technology (CICT), 2015 IEEE International Conference on. IEEE, 2015: 92-97. Pyo S, Kim E H, Kim M G. LDA-Based Unified Topic Modeling for Similar TV User Grouping and TV Program Recommendation[J]. 2014. Çataltepe Z, Uluya÷mur M, Tayfur E. TV program recommendation using implicit feedback with adaptive regularization[C]//Signal Processing and Communications Applications Conference (SIU), 2012 20th. IEEE, 2012: 1-4. Clippingdale S, Okuda M, Takahashi M, et al. Level-of-interest estimation for personalized TV program recommendation[C]//Consumer Electronics (ICCE), 2013 IEEE International Conference on. IEEE, 2013: 671-672. Lee S, Lee D, Lee S. Personalized DTV program recommendation system under a cloud computing environment[J]. Consumer Electronics, IEEE Transactions on, 2010, 56(2): 1034-1042. Song Z, Wei Z, Jia D. The Algorithms of Intelligent TV Programs Recommendation Based on Data Mining[C]//Computer Science & Service System (CSSS), 2012 International Conference on. IEEE, 2012: 1611-1614. Jiang H, Xu W. How to find your appropriate doctor: An integrated recommendation framework in big data context[C]//Computational Intelligence in Healthcare and e-health (CICARE), 2014 IEEE Symposium on. IEEE, 2014: 154-158.