âFiltroâ allows the filtered data to be seen. Figure 1: Interface to interact .... http://www.info-ab.uclm.es/fmc/publications/2006/graphics220.pdf. 5 Conclusions and ...
Computers in Railways X
817
A user interface for the representation of the dynamic results on the pantograph-catenary interactions D. Cebrián1, T. Rojo2, A. Alberto1, E. Arias2, F. Cuartero2 & J. Benet2 1
Albacete Research Institute of Informatics, University of Castilla-La Mancha, Spain 2 Escuela Politécnica Superior de Albacete, University of Castilla-La Mancha, Spain
Abstract In this paper a user-friendly environment for the representation of the dynamic results on the pantograph-catenary interactions is presented. This environment consists of an interactive interface for the representation of graphics and another for the representation of video. By means of the first interface for the representation of graphics, the user can interact with the different graphic representations obtained starting from the data generated by the dynamic calculation of catenaries. The objective of the second interface is to generate a video containing the simulation of the interaction between the pantograph and the catenary. The video sequence, generated by the user through its interactions, can be recorded in AVI format. These two interfaces have been integrated in a user-friendly, interactive and graphically oriented tool software called CALPE. This tool is used for the static and dynamic analysis of a catenaries system, which is shown by menas of a real case study. Keywords: pantograph-catenary interaction, user-friendly interface, graphical representation, video generation.
1
Introduction
Nowadays we are living in a period of growing economic globalization, a progressive removal of the frontiers of countries and a greater communication WIT Transactions on The Built Environment, Vol 88, © 2006 WIT Press www.witpress.com, ISSN 1743-3509 (on-line) doi:10.2495/CR060801
818 Computers in Railways X between them. All these factors influence the means of transport that, for some time, have had to improve and adapt to the new situation, being quicker, resistant and efficient besides knowing how to respond in each moment to the necessities of society. The railway transportation does not want to lag behind; therefore achieving quicker and more efficient trains has become one of the most important goals at the present time. For this reason an exhaustive study should be made on the operation of the railroad, seeing where the limitations of this means arise, and where we can obtain the most important enhancements. One of the most important elements that it is necessary to keep in mind in the rail development is the electrical system, which provides to the locomotive with the driving force for their operation. The transmission of the electricity is carried out from the system formed by the group of wires placed throughout the railroad, named catenary, until the pantograph of the train. This transference of electrical energy provides the necessary force to the train to go throughout the railroad system. Therefore, the contact among those two elements should be as constant as possible, avoiding any take off that impedes the transmission of the electricity with the consequential loss of speed of the train and other associate problems. In this scenario, the system pantograph/catenary, with its dynamic behaviour, is a crucial component (see [1–6]) because at high speeds it is very difficult to guarantee the permanent contact of the head of the pantograph and the contact wire. To obtain relevant benefits in the circulation of railway, the contact force among the pantograph and the catenary has to be maintained as even as it is possible, avoiding the lost of contact. This part is the most critical in the transmission of the electrical energy in modern high-speed trains [4], and therefore, many studies have been made in this field; regarding the design of new models of pantographs and catenaries, or about the simulation of this interaction [6], obtaining results used in the new installations with the objective of obtaining a permanent contact between the pantograph and the contact wire. To work directly with these data and to understand them can be a very difficult and, sometimes, impossible work because of the great quantity of data. For this reason, two user-friendly graphic interfaces has been developed in which the data are represented in different ways and by means of which we can interact with the different data representations obtaining a better understanding of the data. The first interface will take charge of the representation of graphics, starting from the data generated by the dynamic calculation of catenaries, being able to select the graph type to view, to vary the range of the study, to select the element (wire or pantograph) to study, etc. By means of the second interface, the user will be able to interact in the reproduction of the video, to modify the reproduction speed, to change the scale of the wires, to change the way of the reproduction, to control the take off, etc. The paper is strucutred as follows, in sections 2 and 3, both interfaces will be presented, in section 4, we show the integration in the software tool CALPE, which is currently used by the company Renfe in Spain, and we present the
WIT Transactions on The Built Environment, Vol 88, © 2006 WIT Press www.witpress.com, ISSN 1743-3509 (on-line)
Computers in Railways X
819
application of this tool to a real case study. Finally, the conclusions and the future work will be commented in the last section.
2
Interface for the representation of graphical results
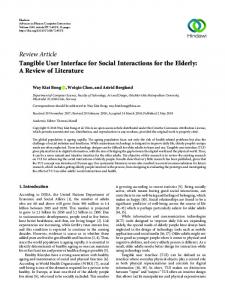
This interface generates a group of interactive graphics obtained from the data generated by means of the study of the interaction of the pantograph in movement and the catenaries system. This study is named dynamic calculation of catenaries [5]. To carry out this study, the pantograph/catenary system described in the previous section has been used. By means of this interface we can interact with five types of graphics, being able to select in each moment the one in which we are interested. These types of graphics are explained in the following subsections. 2.1 Efforts in front of distance This picture represents the force that makes the pantograph on the contact wire/s in each point of the journey. By means of the interface created to interact with this picture we can select the range to study. We can also select the pantograph that will be studied and to see the force that it makes on each contact wire or on several at the same time. By means of the button “Restaurar gráfica” the maximum studio range allowed by the data is selected. Lastly, the option “Filtro” allows the filtered data to be seen.
Figure 1:
Interface to interact with efforts in front of distance picture.
2.2 Elevation in front of distance In this picture the elevation of the contact wire in each point of the journey is represented. This elevation is produced by the force that exercises the pantograph WIT Transactions on The Built Environment, Vol 88, © 2006 WIT Press www.witpress.com, ISSN 1743-3509 (on-line)
820 Computers in Railways X on the wire. Through the interface shown in figure 2, you can select the wire to study, besides adjusting the studio range like in the previous case.
Figure 2:
Interface to interact with elevation in front of distance picture.
2.3 Dispersion of efforts: This picture shows the percentage of times that a certain force on the contact wire/s is repeated. Each reading will rarely be repeated so the forces are grouped in ranges that go from 0.1 to 0.9 N. This range can be modified by means of the slider “Tolerancia”. Also, like in the previous cases, you can also select the pantograph and the wires to study. In this case, the studio range cannot be modified because it is fixed by the previous graphics, but a zoom on the image can be realized.
Figure 3:
Interface to interact with dispersion of efforts picture.
WIT Transactions on The Built Environment, Vol 88, © 2006 WIT Press www.witpress.com, ISSN 1743-3509 (on-line)
Computers in Railways X
821
2.4 Efforts/elevation in front of distance: The first two graphics are superimposed using two vertical scales. The interface is also a mixture of the first two, allowing the height of a wire to be displayed, and several wires to see the efforts that are carried out on them. Here, the study range can be modified.
Figure 4: Interface to interact with efforts/elevation in front of distance picture. 2.5 Position in front of time This shows the position (vertical) of a fixed point (g or q) throughout the time that the journey lasts. By means of the interface you can select the point to be observed. As in the dispersion of efforts graph the study range can not be modified and a zoom on the image can be realized.
Figure 5:
Interface to interact with position in front of time picture.
WIT Transactions on The Built Environment, Vol 88, © 2006 WIT Press www.witpress.com, ISSN 1743-3509 (on-line)
822 Computers in Railways X These graphics will be saved in jpeg format. As the component is interactive, the graphics will be able to be modified during the run of the component; therefore, two versions of the graph will be saved: the initial (unmodified) and the modified one. This component generates quite a lot of output files. Besides the jpeg files that contain the graphics, it also generates a .inf file for each jpeg file that contains information about the graph. The .inf files contain information about the appropriate graph. Bearing in mind that there is a graph of each type for each pantograph and that for each graph there are two jpeg files (one for the original graph and another for the modified one) so the quantity of files that are generated is considerable. Another file generated is an .act file that indicates the name of the jpeg file that contains the graph that is currently showing.
3
Interface for the video generation
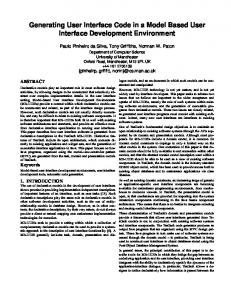
In the previous section, a great variety of graphics have been represented. In these graphics one could observe the force that carries out the pantograph to the contact wire according to their speed or of their position, the elevation of the contact wire, etc. By means of this interface the obtained data with the dynamic calculation of catenaries [5] (using the pantograph/catenary system described in the introduction section has been used) will be used even more, because in this interface, a video will be generated and in this video, the forces carried out by the pantograph on the catenaries system will be able to be appreciated. In this video a catenaries system will be shown in two dimensions, formed by one span that will be covered by one or several pantographs, this will depend on the number of pantographs that the train had. While the pantographs cover the span, one will be able to observe the movement of the contact wire (in the event of that there are two contact wires one will be able to choose which is wanted to see), of the holder wire and of the droppers, and also the take off that take place between the contact wire and the pantograph will be able to be seen. In figure 6 a catenaries system is shown; this system is being covered by a pantograph. One can observe while the pantograph goes covering the span, some blue arrows appear, some up and others down. When an up arrow appears it means that the contact force between the pantograph and the contact wire is smaller than the showed in the text box “Fuerza de despegue”, and this force can be modified by the user. When the force is bigger than this value a blue down arrow appears. During the time that the contact force is smaller than the value indicated in the text box “Fuerza de despegue” the pantograph is blue. When the contact force is negative, this means that a real take off takes place between the contact wire and the pantograph, the arrows become red and the pantograph too. The number that appears under the pantograph indicates the value of this contact force. Besides being able to see this sequence of images so that all the data obtained in the calculation and the graphics generated can be understood, the user will be WIT Transactions on The Built Environment, Vol 88, © 2006 WIT Press www.witpress.com, ISSN 1743-3509 (on-line)
Computers in Railways X
823
able to interact with the video shown. By means of the slider placed to the left of the sequence the user will be able to vary the scales in run-time to see with more clarity the contact wire and the holder wire movement. Also the user will be able to vary the speed of the video playback by means of the slider placed in the inferior right part and, by means of the controls located under the sequence, the user will be able to carry out the typical actions of starting the playback forward, back, pause the playback and stop it. Another option that will allow this component is to record, in avi format, the video generated and to choose the compression method for the recording. The compression methods that the application will allow will vary in function of the video compression codes that the system has installed.
Figure 6:
Interface for the video representation.
4 Integration in the CALPE application, and application to a case study The interfaces presented in the previous sections have been implemented as part of a user-friendly, interactive and graphically oriented software tool, called CALPE. The software package has been developed on an object-oriented database system with a visual interface under Windows. This framework is supported in the Visual FoxPro environment, and it is currently used by RENFE, the Spanish company of railways, in the development of its electrical catenary systems. In order to be able to be integrated in the application, these interfaces have been encapsulated in two ActiveX components. In figure 8 an image of this application is shown. By means of this tool, we can realize studies about dynamic calculation of catenaries or about static ones [7, 8]. This tool shows the
WIT Transactions on The Built Environment, Vol 88, © 2006 WIT Press www.witpress.com, ISSN 1743-3509 (on-line)
824 Computers in Railways X majority of features presented in [9]. In [10] another friendly tool for pantograph design and testing is showed. To show the graphics and the video generated by these interfaces we present a real study done with this tool. The inputa data is a pantograph/catenary system with the following features: • • • • • • • • • • • • • • • •
Type of catenary system: Number of spans: Number of pantographs: Type of pantographs: Velocity of train: Span length: Catenary system height: Contact wire height: Section of holder wire: Mechanics tension of holder wire: Section of contact wire: Mechanics tension of contact wire: Number of contact wires: Section of dropper wires: Number of droppers: Initial curvature:
cr220 CIMYESCLE 1 1 SHUNK 200 200 km/h 60 m 1400 mm 5300 mm 184 mm2 2550 kg 150 mm2 1875 kg 1 25 mm2 16 30 mm
With this characteristics, we obtain a very complete report suitable for industrial application. It ontains 55 pictures in 59 pages, and can be seen at the address http://www.info-ab.uclm.es/fmc/publications/2006/graphics220.pdf.
5
Conclusions and future work
In this paper two user-friendly interfaces for the representation of the dynamic results on the pantograph-catenary interactions have been presented. The first one generates a group of interactive graphics starting from the data generated by means of the studio of the interaction of the pantograph in movement and the catenaries system and the second one generates a video which shows a catenaries system and the forces carried out by the pantograph on the catenaries system. Finally, how these interfaces have been integrated in the CALPE application has been explained. Starting from the work presented in this paper, new necessities and new ideas appear in order to take advantage of the data obtained by means of the dynamic calculation of catenaries. Some of these ideas and necessities include the following. •
To expand the studio of the interaction pantograph-catenary to new kind of spans, what involves the generation of new graphics and videos for spans of different typology. WIT Transactions on The Built Environment, Vol 88, © 2006 WIT Press www.witpress.com, ISSN 1743-3509 (on-line)
Computers in Railways X
• • • •
825
To provide a bigger interactivity to the graphics and the video so that the user has a bigger freedom of work. To represent graphics in 3-dimensions to be able to observe the vertical oscillations of wires like the horizontal ones. In the representation of the video, to allow the simulation of more than a span so that, one can observes the behaviour of the spans in those which the pantograph is not. Finally, to carry out a simulation in 3-dimensions of the whole catenaries system and be able to see the behaviour that will have in the reality each one of the elements.
References [1] [2] [3] [4] [5]
[6] [7] [8] [9] [10]
Poetsch G., Evans J., Meisinger R., Kortum W., Baldauf M., Veitl A., Wallaschek J. “Pantograph/catenary dynamics and control”, Vehicle System Dynamics, 28:159-195, 1997. Poetsch G. and Wallaschek J. “Symulating the dynamic behaviour of electrical lines for high-speed trains on parallel computers”, International Symposium on Cable Dynamics, Lige, 1993. Simeon B. and Arnold M. “The simulation of pantograph and catenary: a PDAE approach”, Technical Report 1990, Fachbereich Mathematik Technische Universitat Darmstadt, 1998. Simeon B. and Arnold M. “Coupling DAEs and PDEs for Simulating the interaction of pantograph and catenary”, Mathematical and Computer Modelling of Dynamical Systems, 6-2:129-144, 2000. Arias, E., Benet, J., Bruis, P., Cuartero, F., Rojo, T. “Solution of the Dynamical Problem of Pantograph-Catenary Interaction: A High Performance Approach”. Proc. of the 7th International Conference on Computational Structures Technology. Lisboa, Septiembre, 2004. Larsson, T., Drugge, L., “Dynamic Behaviour of Pantographs due to different Wear Situations”. Computers in Railways VI, WIT Press, Southampton, UK, pp. 869-880. ISBN 1-85312-598-9, (1998). Benet, J., Cuartero, F., Rojo, T. “A Tool to calculate catenaries in railways”. Computer in Railways VII. WIT Press, Southampton, UK. pp. 535-544, 2000. Benet, J., Montesinos, J., Cuartero, F., Rojo, T., Arias, E. “Advanced algorithm to calculate mechanical forces on a catenary”. Computer in Railways IX. WIT Press, Southampton, UK. pp. 857-866. Mayo, 2004. Drugge, L., Larsson, T., Stensson, A. “Modelling and simulation of catenary-pantograph interaction”. Vehicle System Dynamics, 33. pp. 490501. 1999. Balestrino, A., Bruno, O., Landi, A., Sani, L. “PANDA: a friendly CAD tool for Pantograph design and testing”. Computer in Railways IX. WIT Press, Southampton, UK. pp. 817-826. Mayo, 2004.
WIT Transactions on The Built Environment, Vol 88, © 2006 WIT Press www.witpress.com, ISSN 1743-3509 (on-line)