A user interface to build interactive visualizations for the semantic web Miguel Ceriani, Paolo Bottoni, and Simona Valentini Sapienza, University of Rome, Italy
[email protected],
[email protected],
[email protected]
Abstract. While the web of linked data gets increasingly richer in size and complexity, its use is still constrained by the lack of applications consuming this data. We propose a Web-based tool to build and execute complex applications to transform, integrate and visualize Semantic Web data. Applications are composed as pipelines of a few basic components and completely based on Semantic Web standards, including SPARQL Construct for data transformation and SPARQL Update for state transition. The main novelty of the approach lays in the support to interaction, through the availability of user interface event streams as pipeline inputs.
1
Introduction
A number of tools, libraries and frameworks exist for manipulating and visualizing Semantic Web data. The RDF applications built with these tools are usually written in a host (imperative) programming language, possibly using (declarative) Semantic Web languages (SPARQL, OWL, rule languages) at specific steps of the process. The combination of different approaches, though effective from a programming point of view, makes it difficult to a user to grasp the overall process, at the same time making the reuse of parts of the process harder. We propose an entirely functional approach in which an application is designed building a pipeline composed of a set of operators on RDF graphs. A Web-based application supports the developer in visually building the pipelines, which can then be used as components of other pipelines to achieve complex applications through a modular approach, under complete user control. The application generated from a pipeline is also Web-based and is responsive to relevant user interface events, thanks to automatically generated event management and AJAX 1 client/server interaction. After discussing related work in Sect. 2, Sect. 3 describes the pipeline editor, while Sect. 4 presents the software architecture and Sect. 5 outlines the presented demo Finally, Sect. 6 discusses conclusions and future work.
2
Related Work
During the last few years, two pipeline languages, DERI Pipes [1] and SPARQLMotion [2], have emerged as the state of the art for defining RDF trans1
Asynchronous JavaScript And XML
formations, offering a high level interface to execute operations on linked data, providing a set of basic operators on RDF graphs to build the pipelines, which are then typically executed in the context of a batch or Web application, in the latter case in response to GET or POST requests. Similarly, networked graphs [3] propose a view-based approach, where an RDF-based syntax is used to define new graphs in terms of queries on existing graphs, possibly using recursion. The Visualbox [4] and Callimachus [5] systems have been proposed explicitly for linked data visualization. In their two-step model/view approach, SPARQL queries select data and a template language generates the (XML) visualization. We leverage these approaches to give developers the possibility of specifying event-based interactive applications through pipelines composing query-based operators on graphs. As the User Interface state and events can be used as inputs of the queries, programmers can build complex visualization scenarios.
3
Dataflow Editor
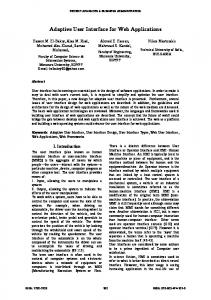
The editor is contained in a Web page (see Fig. 1) providing tools to create and modify dataflows saved as RDF graphs on a Graph Store [6] and composed of:
Fig. 1. A screenshot of the web-based editor
– a component panel (left), where components represent language operators; – the data sources tab (left), allowing reference to RDF data sources already known to the system or the creation of new ones; – the pipelines tab (left), allowing developers to use, view or modify other pipelines created by the user or any pipeline available online (in which case it would not be modifiable);
– the editor area (center), where the pipeline is built by dragging, linking and configuring the desired components; – the command panel (upper right), contains some buttons for operations related to the whole pipeline, e.g. saving it or executing it; – the helper area (bottom-left corner), for contextual help on components; – the source code area (bottom), showing the RDF graph for the dataflow. 3.1
Components
A pipeline is a side-effect-free dataflow programming module, taking as input an RDF Dataset and returning another RDF Dataset. Each component is identified by a Name (visualized in the interface) and an ID (used as fragment identifier to programmatically identify the component). The available components are: – – – –
the default input graph and the (named) input graphs the default output graph and the (named) output graphs the union graphs generated by merging the RDF triples of a set of graphs; the construct graphs generated by executing a SPARQL 1.1 Construct [7] query against a set of graphs; – the updatable graphs, whose content is incrementally modified during an execution of the pipeline by executing a SPARQL 1.1 Update [8] request against a set of graphs each time one of these graphs changes; – existing pipelines which can be used as components in the current pipeline.
A pipeline can be designed just for reuse by other pipelines. If a pipeline has to be executed (i.e. it is a top level pipeline), its default output graph must comply with an XML DOM Ontology 2 describing the XML DOM in RDF. It will represent a HTML or SVG document, to be rendered by the user interface. Its default input graph will receive the DOM Events generated in the user interface, described with a DOM Events Ontology 3 .
4
Software Architecture
The main blocks of the application are the editor, the pipeline repository and the dataflow engine. The editor is a rich Web application with its client side logic coded in HTML+CSS+JavaScript. The pipeline repository is an instance of Graph Store that must be located in the same host of the editor. The dataflow engine is a Java based (using Apache Jena [9]) web application that maintains the state of each running pipeline instance; when a new instance is launched (e.g., from the editor) the engine initializes the pipeline and returns to the client its output along with a piece of JavaScript logic to report the handled events back to the server; each time an event is fired on the client, the dataflow engine is notified and answers with the changes that have to be executed on client content. 2 3
http://www.swows.org/2013/07/xml-dom http://www.swows.org/2013/07/xml-dom-events
On the client side, any modern browser with JavaScript support is sufficient to use both the editor and the generated application. The software is free and available on line4 .
5
Demonstration
We will demonstrate how to build a data visualization through the creation of a pipeline. Static content (e.g., an SVG world map) will be referenced as Datasource and composed with dynamic content built from RDF Datasources (e.g., the FAO Geopolitical Ontology) using some chained Construct queries (e.g., to color the map based on some statistic); to add interaction the Default Input of the pipeline (user interface events) will be connected to an Updatable Graph storing the application state (e.g., the selected statistic)5 .
6
Conclusions and Future Work
We have presented a user interface to build pipelines which specify transformations of RDF graphs in order to build data visualization applications. The RDF pipeline language is based on existing standards (such as SPARQL) and is unique in having been designed for interactive applications and thus able to react to graph modification events. We are a proposing this system as a proof-of-concept and as a test bed for experimentation in RDF programming with a dataflow approach. We want to leverage this experimentation to build higher level interfaces, designed also for usage by non-expert users, as a way to flexibly interact with linked data.
References 1. Le-Phuoc, D., Polleres, A., Hauswirth, M., Tummarello, G., Morbidoni, C.: Rapid prototyping of semantic mash-ups through semantic web pipes. In: Proc. WWW ’09, ACM (2009) 581–590 2. Knublauch, H., et al.: SPARQLMotion Specifications (2010) sparqlmotion.org. 3. Schenk, S., Staab, S.: Networked graphs: a declarative mechanism for SPARQL rules, SPARQL views and RDF data integration on the web. In: Proc. WWW ’08, ACM (2008) 585–594 4. Graves, A.: Creation of visualizations based on linked data. In: Proceedings of the 3rd International Conference on Web Intelligence, Mining and Semantics, ACM (2013) 41 5. Battle, S., Wood, D., Leigh, J., Ruth, L.: The Callimachus Project: RDFa as a Web Template Language. In: COLD. (2012) 6. Ogbuji, C.: Sparql 1.1 Graph Store HTTP Protocol. W3C REC 21 March 2013 7. Harris, S., et al.: SPARQL 1.1 Query Language. W3C REC 21 March 2013 8. Schenk, S., Gearon, P., et al.: SPARQL 1.1 Update. W3C REC 21 March 2013 9. McBride, B.: Jena: a semantic Web toolkit. Internet Computing, IEEE 6(6) (Nov/Dec 2002) 55–59 4 5
http://www.swows.org/ A clip of this example is available at http://www.swows.org/?q=ISWC2013.