Joshua Wade1(â), Dayi Bian1, Jing Fan1, Lian Zhang1, Amy Swanson2, Medha Sarkar5, ..... Lewis, M.H., Bodfish, J.W.: Repetitive behavior disorders in autism.
A Virtual Reality Driving Environment for Training Safe Gaze Patterns: Application in Individuals with ASD Joshua Wade1 ✉ , Dayi Bian1, Jing Fan1, Lian Zhang1, Amy Swanson2, Medha Sarkar5, Amy Weitlauf2,3, Zachary Warren2,3, and Nilanjan Sarkar1,4 (
)
1
2
Electrical Engineering and Computer Science, Nashville, USA {joshua.w.wade,nilanjan.sarkar}@vanderbilt.edu Treatment and Research Institute for Autism Spectrum Disorders (TRIAD), Nashville, USA 3 Pediatrics, Psychiatry and Special Education, Nashville, USA 4 Mechanical Engineering, Vanderbilt University, Nashville, TN 37212, USA 5 Computer Science, Middle Tennessee State University, Murfreesboro, TN 37132, USA
Abstract. It has been well established that adolescents with Autism Spectrum Disorders (ASD) present social and behavioral characteristics that differ signifi‐ cantly from those of their peers without ASD. A growing number of recent studies have begun to look closely at automobile operation characteristics in individuals diagnosed with ASD. Some of this work has suggested that certain driving behav‐ iors demonstrated by those with ASD may pose significant safety concerns to both themselves and other drivers. Expanding on previous work, we designed and tested a gaze-contingent driving intervention system in which drivers were required to not only perform well, but also to look at key regions of interest in the environment such as traffic lights, stop signs, pedestrians and side-view mirrors. We present preliminary results from a study comparing performance outcomes and eye gaze patterns in a group using the gaze-contingent system and a group using a gaze-insensitive, performance-based system. Keywords: Virtual reality · Eye gaze · Autism intervention
1
Introduction
The steady increase in the rate of diagnosis of Autism Spectrum Disorders (ASD) in the United States continues to persist. The Centers for Disease Control and Prevention released figures in 2014 suggesting this rate is now 1 in 68 children [1]. It has been well established that adolescents with ASD present social and behavioral characteristics that differ significantly from those of their peers without ASD. To note just a few of the more widely known examples, individuals with ASD may have trouble with motor coordi‐ nation tasks [2], perform repetitive motions like rocking back and forth [3], and avoid eye contact during communication with others [4]. A growing number of recent studies have begun to look closely at automobile oper‐ ation characteristics in individuals diagnosed with ASD [5–11]. Some of this work has suggested that certain driving behaviors demonstrated by those with ASD may pose significant safety concerns to both themselves and other drivers [5, 6, 9]. Two studies © Springer International Publishing Switzerland 2015 M. Antona and C. Stephanidis (Eds.): UAHCI 2015, Part III, LNCS 9177, pp. 689–697, 2015. DOI: 10.1007/978-3-319-20684-4_66
690
J. Wade et al.
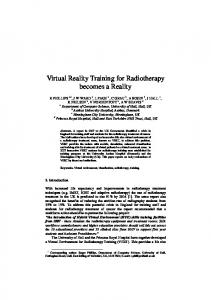
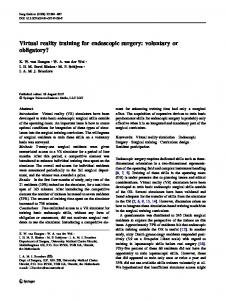
reported finding gaze patterns among individuals with ASD that differed significantly from TD controls that may be problematic for optimally safe driving [7, 10]. Specifically, the average gaze positions of individuals with ASD, compared to controls, tended towards the top of the driving viewing area as well as further to the right. Reimer et al. [7] offered potential explanations for these patterns: (1) the vertical difference in gaze may be the result of relocating one’s gaze from areas of higher complexity (e.g., the roadway with cars coming and going) to areas of lower complexity (e.g., the sky), and (2) the horizontal difference may result from the driver being distracted by objects such as buildings and parked cars, since they are nearer to the driver than those on the left side of the road. Our previous research [10] comparing driving performance and gazepatterns of people with ASD to TD controls, found this same pattern of gaze in the ASD sample. In addition, our previous work showed that ASD participants performed signif‐ icantly higher numbers of driving errors than their TD peers, warranting the investigation of a possible link between driving performance and eye gaze patterns. We tried to answer this question by creating a task-based, driving simulation system in which users cannot progress through tasks without looking at objects identified as key regions of interest (ROI) in addition to driving without performance errors. We expanded on our previous driving simulation platform (Fig. 1) to create such a system. In this paper, we present the design of the proposed system as well as preliminary results from a user study comparing two groups: one where task-progression depended on both performance and proper eye gaze, and another group in which task-progression depended only on performance. The rest of this paper is organized as follows. Section 2 discusses the process of expanding our previous system to produce the new gaze-contingent system. Section 3 describes the experimental procedure of the comparison study and Sect. 4 assesses the preliminary results of this study. Section 5 concludes the paper with a review of both the contributions and limitations of this work as well as future directions for this research.
Fig. 1. A typical example of the driving interface
A Virtual Reality Driving Environment
2
691
System Design
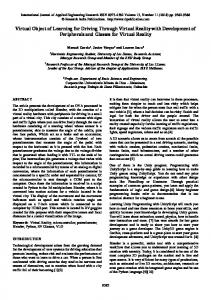
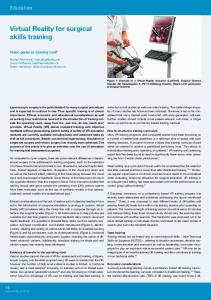
The system presented in this paper is an extension of our previous work [10, 11] with two major updates. The current system now includes a gaze-contingent operating mode in which the user must not only perform driving tasks without error, but he/she must also look at key regions of the environment while driving. Failing to look at these regions will result in a failure of that particular trial. The second update to this system is the integration of an electroencephalography (EEG) data acquisition module that logs brain activity information from the user during driving sessions. We focus our discussion in this section on these new developments. 2.1 System Components There were five major components of the system that we developed. We refer to these as the VR driving module (VDM), gaze data acquisition module (GDM), physiological data acquisition module (PDM), EEG data acquisition module (EDM), and observationbased assessment module (OAM). The overall architecture is shown in Fig. 2. The VDM ran the driving simulation program and managed networking with all of the other modules. The GDM, PDM, and EDM each logged relevant participant data at 120 Hz, 1000 Hz, and 128 Hz, respectively. The OAM managed a program for logging an observer’s subjective assessment regarding a driver’s affective state in real time.
Fig. 2. Overall architecture of the driving platform
692
J. Wade et al.
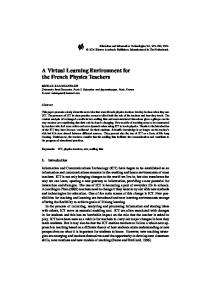
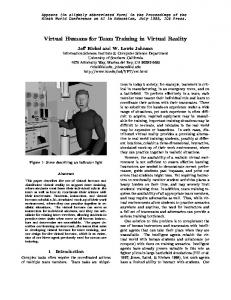
2.2 Online Gaze-Monitoring Eye gaze information was collected using a Tobii X120 remote eye tracker. The GDM queried this information from the device and streamed the data to the VDM via TCP sockets. With this data, the VDM computed the amount of time that users spent looking at the key ROIs in the virtual environment. Henceforth, we refer to this gaze duration time as fixation duration (FD). For each driving trial (e.g., stopping at a stop sign or decreasing speed in a road work area), a predefined set of ROIs were chosen by the researchers based on what were deemed to be the most important elements of the envi‐ ronment. For example, when arriving at a four-way stop, it is obvious that the driver must notice the stop sign, therefore the stop sign was chosen as an ROI for that task. As another example, when a driver enters an area of road work, he/she must be aware of the change in speed (i.e., they must look at the speed limit signs and the vehicle’s speed‐ ometer), as well as the presence of any road work signs. In this manner, ROIs were carefully selected for each of the more than 100 trials defined in the system. For each type of ROI, a bounding cube was defined that would completely envelope the ROI. This bounding cube was used during gameplay to find the extents of the ROI, which allowed us to project the 3D object onto the 2D screen space in order to compute and extent of a particular gaze intersections (Fig. 3). Given the position ROI and a world-to-screen space transformation function (provided by the game engine Unity3D), we calculated a screen space radius r as shown in Eq. 1 (1)
Fig. 3. Bounding boxes shown for 2 ROIs (i.e., a traffic light and a truck) in a trial involving a left turn. The bounding box is shown in black and the extents are shown as white circles.
Where k is a constant indicating the minimum allowable radius and is the furthest extent in the set of extents E from in the screen space (see Eq. 2). We chose a value of k equivalent to 1 cm because we found that smaller values of k reduced the accuracy of intersection detection below 80 %.
A Virtual Reality Driving Environment
693
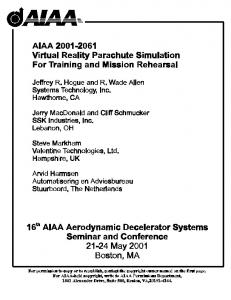
(2) A hashtable data structure was used to monitor FDs for each ROI in a given trial, where the key was the identifier of the ROI (e.g., “traffic light”) and the value was the current FD for that ROI in seconds. To compute FD, the driver’s current gaze was compared against the position of each ROI relevant to the position current trial. If the inequality shown in (Eq. 3) evaluated to true, then the FD for that particular ROI was incremented by the time elapsed between the current and previous frames as reported by the game engine. (3) When a trial began, each ROI was loaded into the hashtable, and all of the FD values were initialized to 0. If the trial was failed, then all of FD values were reset to 0. If the participant successfully completed the trial, then the hashtable was cleared and the next set of ROI were loaded. 2.3 Gaze-Contingent Operating Mode For the purposes of this study, the system operated in one of two distinct modes. Performance-based mode behaved exactly the same as described in Wade et al. [10] where progression through tasks depended only on driving performance. A new oper‐ ating mode—gaze-contingent mode—has been introduced in which participants are required to perform without error, while also looking at key ROIs. Regardless of operating mode, drivers progressed through the driving game by completing assignments or missions, which are comprised of eight different driving trials. At the beginning of an assignment, the first trial was presented to the driver whose goal was to complete as many trials as possible without accruing too many drivingrelated errors or failures. Under performance-based mode, the driver was permitted three failures and any number of failures more than three would result in the termination of the assignment without the possibility of a reattempt. In gaze-contingent mode, on the other hand, the driver was permitted three performance-related failures and three gazerelated failures. If the driver experienced more than three failures in either category, then the assignment was deemed a failure. Following a failure of any kind, drivers were presented with feedback, in the form of both text and audio, instructing them about the reason for the failure and how to avoid errors of that kind moving forward. When drivers successfully completed all eight trials of an assignment, then a congratulatory audio message was presented. In gaze-contingent mode, when drivers failed to look at all of the relevant ROIs for a particular trial, the trial would restart and all of the relevant ROIs were highlighted with a fluorescent green light to draw the driver’s attention to that specific region (Fig. 4). Upon the second attempt of the trial, the highlighting effect would be removed once the partic‐ ipant looked at the associated ROI.
694
J. Wade et al.
Fig. 4. Scenes from the gaze-contingent system: feedback is presented for a gaze-related failure (left) and ROIs are highlighted to draw the attention of the driver during gameplay (right).
2.4 Integration of EEG Data Acquisition Module (EDM) The EDM was defined by an Emotiv EEG headset and accompanying data acquisition program. The device sampled from 14 channels at 128 Hz and the data was streamed wirelessly to a custom application for logging. Additionally, this program received event messages from the VDM, which it used to label epochs of data based on the type of event (e.g., “trial started,” “trial failure,” and “trial success”). This information was logged and kept for offline analysis.
3
Experimental Procedure
3.1 Participants Twelve individuals diagnosed with ASD were recruited to participate in this study, with ages ranging from 13 to 18 years, all of whom were male. Two of the participants had a learner’s permit to drive within the state of Tennessee and only one participant had a driver’s license. Each participant visited the lab facilities for a total of six sessions on different days, except for one participant who completed two sessions at each visit due to long distance traveling. Participants were reimbursed at each visit for their time spent. This study was approved by Vanderbilt’s Institutional Review Board. 3.2 Experiment Participants were randomly assigned to either a gaze-contingent group or a performancebased group in order to compare the effects on driving performance and gaze pattern of the different systems. Participants in the gaze-contingent group had a mean age of 14.65 years (SD 1.38) with one participant holding a driver’s license, while participants in the performance-based group had a mean of 15.93 years (SD 1.26) with two participants
A Virtual Reality Driving Environment
695
holding learner’s permits. Each participant attempted a total of three driving assignments (24 trials) at each visit for a total of 18 assignments (144 trials) for all six visits. On the first visit, participants completed a pre-test session that consisted of a variety of difficulty levels. During the next four visits, participants completed sets of three assignments in which the difficulty increased from one visit to the next. On the sixth and final visit, participants completed a post-test session identical to that of the first visit’s pre-test. We hypothesized that we would see improvement in terms of performance in both groups as well as a reduction in gaze-related failures from pre- to post-test in the gaze-contingent group.
4
Preliminary Results and Discussion
4.1 Results Statistical significance was evaluated using a standard two-tailed t-test. We compared the gaze position patterns of participants in both groups considering only the valid data collected by the GDM (i.e., not including blinks or off-screen gaze). The average gaze position was computed for both horizontal and vertical (x and y, respectively) compo‐ nents of gaze for the two groups. Participants in the performance-based group showed an average vertical component of gaze that was significantly higher (p < 0.01) than that of the gaze-contingent group by 0.81 cm. Similarly, the performance-based group also showed a pattern of gaze significantly further to the right side of the screen (p < 0.01) than that of the gaze-contingent group by 1.44 cm. In the performance-based group, every participant showed a decrease in trial failures from the pre-test to the post-test (see Table 1). As a group, this change was statistically significant (p < 0.01). In the gaze-contingent group, however, this pattern did not arise for performance-related trial failures. For three of the gaze-contingent group partici‐ pants, the number of performance-related trial failures decreased, but for the other three participants, this value either remained the same, or, in one case, actually increased. In terms of gaze-related trial failures, all but one participant experienced either fewer, or the same number of gaze-related failures from pre-test to post-test. 4.2 Discussion Reimer et al. [7] and Wade et al. [10] showed that drivers with ASD demonstrated patterns of gaze that were both higher vertically and further to the right horizontally compared to TD controls. The result of lowered and left-shifted average gaze position in the gaze-contingent group may indicate a shift in gaze pattern towards one more representative of the TD population. While this is not itself a mark of improved driving performance, it is a very interesting result that justifies further inspection. In terms of failure-related results, it is difficult to draw major conclusions from this small sample. Two of the participants in the gaze-contingent group (i.e., participants G2 and G6) demonstrated some unwillingness to participate in the study and often inten‐ tionally crashed the virtual vehicle, resulting in unrealistic failure data. None of the participants in the performance-based group demonstrated this kind of behavior. It seems
696
J. Wade et al.
reasonable to assume, then, that given a larger and more evenly distributed sample, both groups would have seen some kind of decrease in performance-related failures. Table 1. Comparison of results between the performance-based and gaze-contingent groups Visit #
Visit 1 (Pre-test) Visit 2
Visit 3
Visit 4
Visit 5
Visit 6 (Post-test)
5
Fail Type
Performance Group
Gaze-contingent Group
P1
P2
P3
P4
P5
P6
G1
G2
G3
G4
G5 G6
Perf.
6
9
10
7
7
10
6
12
7
3
5
12
Gaze
–
–
–
–
–
–
2
0
3
10
9
1
Perf.
5
0
4
3
2
8
1
12
3
2
5
12
Gaze
–
–
–
–
–
–
4
4
4
6
3
3
Perf.
3
2
7
7
4
8
7
12
7
10
2
11
Gaze
–
–
–
–
–
–
0
2
3
2
6
5
Perf.
4
2
3
5
1
10
0
9
6
2
2
8
Gaze
–
–
–
–
–
–
3
4
6
7
2
4
Perf.
6
4
6
5
5
14
10
12
6
7
1
11
Gaze
–
–
–
–
–
–
2
2
5
4
4
2
Perf.
2
0
1
3
2
6
2
12
4
6
1
12
Gaze
–
–
–
–
–
–
1
0
4
0
5
1
Conclusion
The work presented in this paper expands on previous work to understand and improve the driving performance of individuals diagnosed with ASD. We extended our previous driving simulation system to include an EEG data acquisition module in order to gain additional insight into the state of the drivers using our system. More importantly, we designed, implemented, and tested a new operating mode of the system in which drivers are required to not only perform well, but also look at regions of the environment deemed to be essential for optimal driving. We evaluated this system in a small comparison study and found encouraging, preliminary results. A major limitation of this work is the size of the sample studied. The number of participants evaluated is quite small and therefore these results may not be entirely representative of the general ASD population. We plan to address this issue by continuing the study discussed in this paper until a more substantial sample is obtained. Additionally, a more in-depth analysis of the data collected is required. The results of this work will also be used to improve the current system in order to develop a more targeted and effective intervention system in the future.
A Virtual Reality Driving Environment
697
Acknowledgment. This work was supported in part by the National Institute of Health Grant 1R01MH091102-01A1, National Science Foundation Grant 0967170 and the Hobbs Society Grant from the Vanderbilt Kennedy Center.
References 1. Wingate, M., Kirby, R.S., Pettygrove, S., Cunniff, C., Schulz, E., Ghosh, T., Robinson, C., Lee, L.C., Landa, R., Constantino, J., Fitzgerald, R., Zahorodny, W., Daniels, J., Nicholas, J., Charles, J., McMahon, W., Bilder, D., Durkin, M., Baio, J., Christensen, D., Van, K., Braun, N., Clayton, H., Goodman, A., Doernberg, N., Yeargin-Allsopp, M., A. D. D.: Monitoring, Prevalence of Autism Spectrum Disorder Among Children Aged 8 Years - Autism and Developmental Disabilities Monitoring Network, 11 Sites, United States (2010) Mmwr Surveillance Summaries, vol. 63, March 28 (2014) 2. Weimer, A.K., Schatz, A.M., Lincoln, A., Ballantyne, A.O., Trauner, D.A.: Motor impairment in Asperger syndrome: evidence for a deficit in proprioception. J. Dev. Behav. Pediatr. 22, 92–101 (2001) 3. Lewis, M.H., Bodfish, J.W.: Repetitive behavior disorders in autism. Ment. Retard. Dev. Disabil. Res. Rev. 4, 80–89 (1998) 4. Klin, A., Jones, W., Schultz, R., Volkmar, F., Cohen, D.: Visual fixation patterns during viewing of naturalistic social situations as predictors of social competence in individuals with autism. Arch. Gen. Psychiatry 59, 809–816 (2002) 5. Sheppard, E., Ropar, D., Underwood, G., van Loon, E.: Brief report: driving hazard perception in autism. J. Autism Dev. Disord. 40, 504–508 (2010) 6. Cox, N.B., Reeve, R.E., Cox, S.M., Cox, D.J.: Brief Report: Driving and young adults with ASD: Parents experiences. J. Autism Dev. Disord. 42, 2257–2262 (2012) 7. Reimer, B., Fried, R., Mehler, B., Joshi, G., Bolfek, A., Godfrey, K.M., Zhao, N., Goldin, R., Biederman, J.: Brief report: examining driving behavior in young adults with high functioning autism spectrum disorders: a pilot study using a driving simulation paradigm. J. Autism Dev. Disord. 43, 2211–2217 (2013) 8. Classen, S., Monahan, M.: Evidence-based review on interventions and determinants of driving performance in teens with attention deficit hyperactivity disorder or autism spectrum disorder. Traffic Inj. Prev. 14, 188–193 (2013) 9. Daly, B.P., Nicholls, E.G., Patrick, K.E., Brinckman, D.D., Schultheis, M.T.: Driving behaviors in adults with autism spectrum disorders. J. Autism Dev. Disord. 44, 3119–3128 (2014) 10. Wade, J., Bian, D., Zhang, L., Swanson, A., Sarkar, M., Warren, Z., Sarkar, N.: Design of a virtual reality driving environment to assess performance of teenagers with ASD. In: Stephanidis, C., Antona, M. (eds.) UAHCI 2014, Part II. LNCS, vol. 8514, pp. 466–474. Springer, Heidelberg (2014) 11. Bian, D., Wade, J.W., Zhang, L., Bekele, E., Swanson, A., Crittendon, J.A., Sarkar, M., Warren, Z., Sarkar, N.: A novel virtual reality driving environment for autism intervention. In: Stephanidis, C., Antona, M. (eds.) UAHCI 2013, Part II. LNCS, vol. 8010, pp. 474–483. Springer, Heidelberg (2013)