Mar 23, 2017 - [30] Megan Bayly, Michael Regan, and Simon Hosking. Intelligent Transport ..... [96] Sarah J. White, Masako Hirotani, and Simon P. Liversedge.
Design in Immersive Virtual Reality Environment for Information Presentation of Motorcycle Head-Up Display by
Kenichiro Ito
Submitted to the Graduate School of System Design and Management in partial fulfillment of the requirements for the degree of Ph.D. in System Engineering at the KEIO UNIVERSITY March 2017 c Kenichiro Ito, 2017. All rights reserved. ⃝ The author hereby grants to Keio University permission to reproduce and to distribute publicly paper and electronic copies of this thesis document in whole or in part in any medium now known or hereafter created.
Design in Immersive Virtual Reality Environment for Information Presentation of Motorcycle Head-Up Display by Kenichiro Ito Submitted to the Graduate School of System Design and Management on March, 23 2017, in partial fulfillment of the requirements for the degree of Ph.D. in System Engineering
Abstract This dissertation introduces design for information presentation of motorcycle headup display. The research adopted a human-centered design approach to consider the characterful viewpoint movement of motorcycle rider. The approach utilized the immersive virtual reality environment for the Human-in-the-Loop simulation. Conducting experiments using the prototype of the head-up display in the simulation determined the design parameters for the information presentation system. More particularly, this dissertation shows the determination procedure for three design parameters that are the information presentation position, information presentation quantity, and information presentation timing. Earlier studies indicate that motorcycle rider observes the road surface carefully in a characterful way compared to an automobile driver. Hence, it is important to consider this behavior to design an information presentation system dedicated for motorcycle. In addition, previous studies for motorcycle reports that liquid crystal display placed near the speedometer is notoriously difficult to look while riding. The extent to which viewpoint movement of motorcycle rider determines the effectiveness of the information presentation system remains unclear and poorly understood. The design approach for this research adopted the human-centered design to consider the viewpoint movement of motorcycle rider. More specifically, the design adopted the systems engineering approach considering the Human Systems Integration.Ideally, measuring the actual motorcycle rider’s viewpoint movement on public roads is the most accurate approach; however, this approach has major safety issues. Thus, this research utilized a simulation environment to guarantee safety for the motorcycle rider during the design for information presentation system. To take consideration on motorcycle rider’s viewpoint movements, the visual configuration of the simulation environment is important. Therefore, this research utilized an immersive virtual reality environment that provides a wide range stereoscopic field of view to the rider. In addition, the immersive virtual reality environment implemented a scooter-type motorcycle simulator developed in real-scale. This immersive motorcycle simulator observed motorcycle rider’s characterful viewpoint movement
similar to the real world environment. Consequently, procedure of design for information presentation utilized this immersive motorcycle simulator. Regarding the viewpoint movement of motorcycle rider, this dissertation proposes a head-up display for motorcycle as the information presentation system. The head-up display, virtually presented information on or near the road surface has the potential to bring down the difficulty for the motorcycle rider to obtain information. Therefore, we constructed and utilized a head-up display prototype to design the information presentation system. Three design parameters were determined for information presentation. The parameters are the information presentation position, information presentation quantity, and the information presentation timing. Experiments conducted using riders in the immersive motorcycle simulator served the determination procedure for the three design parameters. The experimental results determined the values of the design parameters. The value of design parameter for information presentation position was determined to be positions the lower left and lower right positions relative to the vanishing point of the road. For the information presentation quantity, the determined value was 5 letters in case of using Japanese Hiragana. The determined value of design parameter for information presentation timing was at the timing of 55 meters prior to the target intersection when riding in an urban area road with 30 km/h speed limit. In conclusion, this dissertation summarizes the design in immersive virtual reality environment for information presentation of motorcycle head-up display. Thesis Supervisor: Tetsuro Ogi Title: Professor, Department of System Design and Management
Acknowledgments First and foremost, I would like to express my sincere gratitude to my advisor Prof. Tetsuro Ogi. I appreciate all Prof. Ogi’s contributions to make my Ph.D. experience very productive. I am also thankful for opportunities to experience research fields other than my topic, which gave me great image and motivation to be as an researcher. I would also like to thank to Prof. Hidekazu Nishimura for giving me many comments throughout my Ph.D. Not only for being a member in the thesis committee, Prof. Nishimura has been looking after my research topic from the start of my master course. Especially for fields in automobile, motorcycle, and systems engineering helped me gain a lot of knowledge and work progress for my whole research to complete this dissertation. Next, I would like to thank Prof. Shinichiro Haruyama, Prof. Koichi Hirota, and Dr. Haruhiko Okumura for being a member for the thesis committee. From the start of review for my dissertation, I would like to thank for pointing out about information presentation quantity different from adapting information theory, virtual reality insights, and head-up display insights. Also I would like to give thanks the JKA Foundation for their fundings related to my research. From their funding project “RING!RING!Project”, first, under fundings to Prof. Nishimura, Project No.23–153 and next, under fundings to Prof. Ogi, Project No.27–159. Without the fundings, I would never had the opportunity to use the motorcycle simulator or update the motorcycle HUD prototype. Without these supports, this dissertation’s experiments would not been have been able to be conducted. I would also like to specially thank to R.A. Yoshisuke Tateyama and Dr. Keiichi Yamamoto for supporting me in enabling the immersive virtual reality environment for motorcycle simulator, R.A. Sunkil Yun for helping me with the SysML diagrams. Lastly, I would like to thank my parents and my relatives for their faithful support.
This doctoral thesis has been examined by a Committee of the Graduate School of System Design and Management as follows:
Professor Tetsuro Ogi . . . . . . . . . . . . . . . . . . . . . . . . . . . . . . . . . . . . . . . . . . . . . . . . . . Chairman, Thesis Supervisor Professor of System Design and Management
Professor Hidekazu Nishimura . . . . . . . . . . . . . . . . . . . . . . . . . . . . . . . . . . . . . . . . . Member, Thesis Committee Professor of System Design and Management
Professor Shinichiro Haruyama. . . . . . . . . . . . . . . . . . . . . . . . . . . . . . . . . . . . . . . . . Member, Thesis Committee Professor of System Design and Management
Professor Koichi Hirota . . . . . . . . . . . . . . . . . . . . . . . . . . . . . . . . . . . . . . . . . . . . . . . . Member, Thesis Committee Professor of Information Systems at the University of Electro-Communications
Doctor Haruhiko Okumura. . . . . . . . . . . . . . . . . . . . . . . . . . . . . . . . . . . . . . . . . . . . . Member, Thesis Committee Doctor of Engineering, Toshiba Corportaion
Contents Abstract
iii
Acknowledgments
v
1 Introduction
1
1.1
Background . . . . . . . . . . . . . . . . . . . . . . . . . . . . . . . .
1
1.1.1
Current Situation of Information Presentation for Motorcycle
2
1.1.2
Motorcycle Rider’s Characterful Viewpoint Movement . . . . .
4
1.1.3
Issues of Current Information Presentation for Motorcycle . .
6
1.1.4
Head-up Display (HUD) for Motorcycle . . . . . . . . . . . . .
9
1.2
Research Purpose . . . . . . . . . . . . . . . . . . . . . . . . . . . . .
17
1.3
Research Outline . . . . . . . . . . . . . . . . . . . . . . . . . . . . .
19
2 Information Presentation Design for Motorcycle HUD 2.1
Concern in Design of Information Presentation for Motorcycle HUD . 2.1.1
Boundary of the Information Presentation System for Motor22
Enabling Virtual Reality Environment . . . . . . . . . . . . .
33
Design Parameters of Information Presentation . . . . . . . . . . . .
37
3 Experimental Environment 3.1
21
cycle HUD . . . . . . . . . . . . . . . . . . . . . . . . . . . . . 2.1.2 2.2
21
41
Immersive Virtual Reality Environment . . . . . . . . . . . . . . . . .
42
3.1.1
Immersive CAVE . . . . . . . . . . . . . . . . . . . . . . . . .
43
3.1.2
Development for Immersive CAVE Motorcycle Simulator . . .
47
ix
3.1.3
3.2
Evaluation of Immersive CAVE Motorcycle Simulator . . . . .
53
3.1.3.1
Eye-tracking device to measure viewpoint movement
53
3.1.3.2
Real World Environment for Comparison . . . . . . .
57
3.1.3.3
Non-Immersive Environment for Comparison . . . .
58
3.1.3.4
Evaluation Result and Discussion . . . . . . . . . . .
60
Prototyping the Motorcycle HUD . . . . . . . . . . . . . . . . . . . .
66
3.2.1
Structure of the Motorcycle HUD prototype . . . . . . . . . .
66
3.2.2
Software of the Information Presentation Prototype . . . . . .
69
4 Information Presentation Position
75
4.1
Information Presentation Position Experiment . . . . . . . . . . . . .
76
4.2
Experimental Results of Information Presentation Position . . . . . .
80
4.3
Discussions of Information Presentation Position . . . . . . . . . . . .
91
5 Information Presentation Quantity 5.1
5.2
93
Information Presentation Character Kind . . . . . . . . . . . . . . . .
94
5.1.1
Information Presentation Character Kind Experiment . . . . .
95
5.1.2
Experimental Results of Information Presentation Character Kind100
5.1.3
Discussions of Information Presentation Character Kind . . . 103
Information Presentation Quantity Experiment using Hiragana . . . . 104 5.2.1
Experimental Results of Information Presentation Quantity . . 108
5.2.2
Discussions of Information Presentation Quantity . . . . . . . 114
6 Information Presentation Timing
119
6.1
Information Presentation Timing Experiment . . . . . . . . . . . . . 120
6.2
Experimental Results of Information Presentation Timing . . . . . . . 122
6.3
Discussions of Information Presentation Timing . . . . . . . . . . . . 128
7 Conclusion
131
7.1
Overall Discussion . . . . . . . . . . . . . . . . . . . . . . . . . . . . 131
7.2
Concluding Remarks . . . . . . . . . . . . . . . . . . . . . . . . . . . 134 x
A Appendix Tables
135
B Appendix Figures
145
C Appendix Codes
149
Glossary
155
Acronyms
157
List of symbols
159
List of References
161
List of Publications
171
xi
List of Figures 1-1 Demands against navigation information in metropolitan area. . . . .
2
1-2 Motorcycle rider’s viewpoint movement example.
. . . . . . . . . . .
5
1-3 Car driver’s viewpoint movement example. . . . . . . . . . . . . . . .
5
1-4 The basic structure of the HUD. . . . . . . . . . . . . . . . . . . . . .
10
1-5 Illustration of HUD equipped motorcycle. . . . . . . . . . . . . . . . .
12
1-6 Illustrated view of seeing the virtual image through the combiner from motorcycle rider’s point of view. . . . . . . . . . . . . . . . . . . . . .
13
1-7 Illustration of information presentation design for motorcycle considering rider’s viewpoint movement. . . . . . . . . . . . . . . . . . . . .
18
1-8 Illustration of VR environment Human-in-the-Loop Simulation. . . .
18
1-9 Dissertation outline. . . . . . . . . . . . . . . . . . . . . . . . . . . .
20
2-1 System life cycle stages and possible iteration/recursion,with the research scope indicated in highlighted background. . . . . . . . . . . .
23
2-2 Context diagram of motorcycle generic use. . . . . . . . . . . . . . . .
23
2-3 Context diagram of navigation information for motorcycle . . . . . .
24
2-4 Interaction between the motorcycle rider and the navigation information for motorcycle. . . . . . . . . . . . . . . . . . . . . . . . . . . . .
25
2-5 SysML Diagram Taxonomy . . . . . . . . . . . . . . . . . . . . . . .
27
2-6 Block definition diagram of the Motorcycle Navigation Domain. . . .
28
2-7 The use case diagram of the rider operating the Motorcycle with Navigation System. . . . . . . . . . . . . . . . . . . . . . . . . . . . . . .
30
2-8 Use case diagram of Information Presentation System. . . . . . . . .
31
xiii
2-9 Activity diagram of Present Navigation Information. . . . . . . . . .
32
2-10 Block definition diagram of the immersive CAVE motorcycle simulator. 34 2-11 Activity diagram of immersive CAVE motorcycle simulator enabled for Present Navigation Information. . . . . . . . . . . . . . . . . . . . . .
35
2-12 Activity diagram showing prototyping the Motorcycle HUD for Information Presentation System. . . . . . . . . . . . . . . . . . . . . . . .
40
3-1 Structure of K-CAVE Immersive CAVE. . . . . . . . . . . . . . . . .
45
3-2 Block diagram of physical architecture of K-CAVE using Ethernet for PC communication. . . . . . . . . . . . . . . . . . . . . . . . . . . . .
46
3-3 Picture of the motorcycle simulator placed inside the K-CAVE. . . . .
47
3-4 Structure of the immersive CAVE motorcycle simulator.
48
. . . . . . .
3-5 Picture of the motorcycle simulator with indications of the operational interfaces. . . . . . . . . . . . . . . . . . . . . . . . . . . . . . . . . .
49
3-6 Block diagram of the simulation model for immersive CAVE motorcycle simulator. . . . . . . . . . . . . . . . . . . . . . . . . . . . . . . . . .
50
3-7 Virtual town modeling for the immersive CAVE simulator. . . . . . .
52
3-8 Comparison of the real world picture and the constructed virtual world. 52 3-9 Rider riding the motorcycle inside the immersive CAVE simulator. . .
52
3-10 The eye-tracking device. . . . . . . . . . . . . . . . . . . . . . . . . .
54
3-11 The sensors on the cap-type head unit. . . . . . . . . . . . . . . . . .
54
3-12 Sample frame from the eye-tracking device’s recorded movie. . . . . .
55
3-13 Immersive CAVE’s electromagnetic sensor. . . . . . . . . . . . . . . .
56
3-14 The subject riding the motorcycle prepared to start the experiment. .
59
3-15 Recorded scene from the eye-tracking device showing the marker bar and the marker. . . . . . . . . . . . . . . . . . . . . . . . . . . . . . .
60
3-16 The overview of the non-immersive motorcycle simulator. . . . . . . .
61
3-17 Non-immersive motorcycle simulator experiment scenery. . . . . . . .
62
3-18 Markers for non-immsersive experiment. . . . . . . . . . . . . . . . .
62
3-19 Comparison between simulation environment (Subject A). . . . . . .
63
xiv
3-20 Comparison between simulation environment (Subject B). . . . . . .
63
3-21 Picture of the first HUD prototype. . . . . . . . . . . . . . . . . . . .
67
3-22 Virtual image focal distance configuration. . . . . . . . . . . . . . . .
68
3-23 The display device, lens, and the combiner configuration for the first prototype. . . . . . . . . . . . . . . . . . . . . . . . . . . . . . . . . .
69
3-24 The display device, lens, and the combiner configuration for the second prototype. . . . . . . . . . . . . . . . . . . . . . . . . . . . . . . . . .
70
3-25 Sample of arrow used for information presentation position experiment. 71 3-26 Sample of information presentation used for information presentation quantity experiment. . . . . . . . . . . . . . . . . . . . . . . . . . . .
72
3-27 Updated system configuration diagram to perform experiments for information presentation timing . . . . . . . . . . . . . . . . . . . . . .
73
4-1 Scenery of the experiment to investigate the information presentation position. . . . . . . . . . . . . . . . . . . . . . . . . . . . . . . . . . .
75
4-2 The defined durations for analysis of the position experiment. . . . .
76
4-3 The test course used for the information presentation position experiment. . . . . . . . . . . . . . . . . . . . . . . . . . . . . . . . . . . . .
77
4-4 The HUD positions divided into nine positions. . . . . . . . . . . . .
78
4-5 Nine positions labeled with names. . . . . . . . . . . . . . . . . . . .
78
4-6 The four types of information presented for information presentation position experiment. . . . . . . . . . . . . . . . . . . . . . . . . . . .
79
4-7 Detection time means and statistical differences from Tukey HSD test on nine positions. . . . . . . . . . . . . . . . . . . . . . . . . . . . . .
82
4-8 3D graph plot of means Detection time for nine positions. . . . . . . .
82
4-9 Observation time means and statistical differences from Tukey HSD test on nine positions. . . . . . . . . . . . . . . . . . . . . . . . . . .
84
4-10 3D graph plot of means Observation time for nine positions. . . . . .
84
4-11 Impartation time means and statistical differences from Tukey HSD test on nine positions. . . . . . . . . . . . . . . . . . . . . . . . . . . xv
85
4-12 3D graph plot of means Impartation time for nine positions. . . . . .
85
4-13 Detection time means and statistical differences from Tukey HSD test on Horizontal and Vertical divisions . . . . . . . . . . . . . . . . . . .
88
4-14 Observation time means and statistical differences from Tukey HSD test on Horizontal and Vertical divisions . . . . . . . . . . . . . . . .
89
4-15 Impartation time means and statistical differences from Tukey HSD test on Horizontal and Vertical divisions . . . . . . . . . . . . . . . .
90
5-1 Scenery of the experiment to investigate the position to present. . . .
93
5-2 Example of different character kind representing the same meaning. .
95
5-3 Engineering psychology model while riding the motorcycle . . . . . .
96
5-4 Experiment course for information presentation quantity by character kind experiment. . . . . . . . . . . . . . . . . . . . . . . . . . . . . .
98
5-5 The defined durations for analysis of the character kind experiment. .
99
5-6 Detection time means on Character Kind. . . . . . . . . . . . . . . . 102 5-7 Observation time means and statistical differences from Tukey HSD test on Character Kind. . . . . . . . . . . . . . . . . . . . . . . . . . 102 5-8 Experiment course for information presentation quantity by number of letters experiment. . . . . . . . . . . . . . . . . . . . . . . . . . . . . 106 5-9 Randomly generated text string example for the number of letters experiment. . . . . . . . . . . . . . . . . . . . . . . . . . . . . . . . . . 107 5-10 Experimental results of means duration based on text length. . . . . . 110 5-11 Experiment result of observation time per letter. . . . . . . . . . . . . 112 6-1 Scenery of the experiment to investigate the timing to present. . . . . 119 6-2 Configured five different distances. . . . . . . . . . . . . . . . . . . . . 120 6-3 The defined durations for analysis of the timing experiment. . . . . . 121 6-4 The five subjective scale to measure for the timing experiment. . . . . 122 6-5 Timing experiment result bar graph of observation time. . . . . . . . 124 6-6 Timing Experimental result of five scale opinion answer . . . . . . . . 126 xvi
7-1 Overview picture of the updated prototype . . . . . . . . . . . . . . . 132 B-1 A zoomed-in overview of the modeled test course. . . . . . . . . . . . 145 B-2 Geographical location information of the real town modeled in the immersive CAVE motorcycle simulator. . . . . . . . . . . . . . . . . . 146 B-3 Illustratd road width configuration between the real world town and virtual world town. . . . . . . . . . . . . . . . . . . . . . . . . . . . . 147 B-4 Illustrated road width configuration for the non-immersive riding environment. . . . . . . . . . . . . . . . . . . . . . . . . . . . . . . . . . 147
xvii
List of Tables 3.1
Movie file format of the eye-tracking device. . . . . . . . . . . . . . .
55
3.2
The eye-tracking device’s CSV file column explanations.
. . . . . . .
56
3.3
Environment comparison experiment’s subject attributes. . . . . . . .
57
3.4
Data of viewpoint movement field size and total amount for each environment. . . . . . . . . . . . . . . . . . . . . . . . . . . . . . . . . .
64
3.5
Minimum and maximum viewpoint angle measured. . . . . . . . . . .
65
3.6
The miniature PC to run the software for HUD. . . . . . . . . . . . .
72
4.1
Two-way ANOVA of Detection Time by Position and Type.
. . . . .
81
4.2
Two-way ANOVA of Observation time by Position and Type. . . . . .
81
4.3
Two-way ANOVA of Impartation time by Position and Type. . . . . .
81
4.4
Three-way ANOVA of Detection time by Horizontal division, Vertical division, and Type. . . . . . . . . . . . . . . . . . . . . . . . . . . . .
4.5
Three-way ANOVA of Observation time by Horizontal division, Vertical division, and Type. . . . . . . . . . . . . . . . . . . . . . . . . . .
4.6
86
Three-way ANOVA of Impartation time by Horizontal division, Vertical division, and Type. . . . . . . . . . . . . . . . . . . . . . . . . . .
5.1
86
87
Number of data per condition for information presentation character kind experiment . . . . . . . . . . . . . . . . . . . . . . . . . . . . . . 100
5.2
Two-way ANOVA of Detection time by Character Kind and Position.
5.3
Two-way ANOVA of Observation time by Character Kind and Position.101
5.4
Means of letters presented and observation time. . . . . . . . . . . . . 103 xix
101
5.5
Number of trial conducted for each subject for the number of letters experiment. . . . . . . . . . . . . . . . . . . . . . . . . . . . . . . . . 106
5.6
Three-way ANOVA of Detection time by Text length, Meaning, and Position. . . . . . . . . . . . . . . . . . . . . . . . . . . . . . . . . . . 108
5.7
Three-way ANOVA of Observation time by Text length, Meaning, and Position. . . . . . . . . . . . . . . . . . . . . . . . . . . . . . . . . . . 109
5.8
Observation time per letter ANOVA result. . . . . . . . . . . . . . . . 111
5.9
Observation time per letter multiple comparison result . . . . . . . . 113
5.10 Observed speed of information processing. . . . . . . . . . . . . . . . 115 5.11 Comparison of observation time between text and sign. . . . . . . . . 116 6.1
Number of data used for the timing experiment analysis. . . . . . . . 123
6.2
Timing experiment ANOVA result for observation time. . . . . . . . . 124
6.3
Timing experiment multiple comparison result of observation time. . 125
6.4
Timing experiment ANOVA result for questionnaire answers. . . . . . 125
6.5
Timing experiment multiple comparison result of questionnaire answers.127
6.6
Mean values of Subjective ranking by Timing . . . . . . . . . . . . . 128
6.7
Mean values of Observation time for Timing . . . . . . . . . . . . . . 128
A.1 K-CAVE components. . . . . . . . . . . . . . . . . . . . . . . . . . . 135 A.2 Motorcycle simulator specifications. . . . . . . . . . . . . . . . . . . . 135 A.3 Matlab/Simulink and ControlDesk computer specifications. . . . . . . 136 A.4 Prescan computer specifications . . . . . . . . . . . . . . . . . . . . . 137 A.5 Specification of the projector utilized for the first prototype. . . . . . 137 A.6 Specification of the utilized lens for HUD. . . . . . . . . . . . . . . . 137 A.7 Specification of the projector utilized the second prototype. . . . . . . 138 A.8 Notebook type computer specifications . . . . . . . . . . . . . . . . . 138 A.9 List of symbols used for experiment of information presentation amount139 A.10 Means and standard deviations on the measure of defined durations in Position and Type. . . . . . . . . . . . . . . . . . . . . . . . . . . . . 140 xx
A.11 Means and standard deviations on the measure of defined durations in Horizontal division and Vertical division. . . . . . . . . . . . . . . . . 141 A.12 Means and standard deviations on the measure of Detection time and Observation time in Position and Character Type. . . . . . . . . . . . 142 A.13 Means and standard deviations on the measure of Detection time and Observation time in Text length, Meaning, and Position. . . . . . . . 143 A.14 Specification of the real scooter type motorcycle . . . . . . . . . . . . 144
xxi
Chapter 1 Introduction This dissertation describes about the design of information presentation using the Head-Up Display (HUD) for motorcycle, approached with Human-in-the-Loop Simulation in the immersive Virtual Reality (VR) environment. In this introduction, Section 1.1 describes about the research background of information presentation for motorcycle with literature reviews. Section 1.2 describes about the research purpose of design of HUD for motorcycle, and Section 1.3 will show the outline and the structure of this dissertation.
1.1
Background
Navigation system for cars has been released on the market as a useful information presentation system for more than twenty years. On the other hand, navigation system for motorcycles is still not popularity due to lack of successful information presentation systems. Currently, some motorcycle riders tend to mount a small Liquid Crystal-Display (LCD) to their motorcycle to use it as a display device to obtain navigation information. Although, usability of the small LCD is considered not as high to be as a navigation system. Also, some research reports that the use of mounted LCD has issues with safety. This section introduces the background of information presentation system for motorcycle. It describes the current situation of information presentation for motor1
cycle, explain about the motorcycle rider’s characterful viewpoint movement, describe about issues of current information presentation for motorcycle, and then introduce about recent approaches in using HUD.
1.1.1
Current Situation of Information Presentation for Mocycle, explain about the motorcycle rider’s characterful viewpoint movement, describe
torcycle about issues of current information presentation for motorcycle, and then introduce about recent approaches of using HUD.
Nowadays cars have navigation systems equipped and has been widely used. Regarding the1.1.1 fact that it is used for carsofwith great usability to support for the Modriver, it is Current Situation Information Presentation necessary thattorcycle navigation systems for motorcycles shall be equipped as well. The demand for navigation system can also be observed from a survey done to Japanese Nowadays cars have navigation system equipped and has been widely used. Regarding
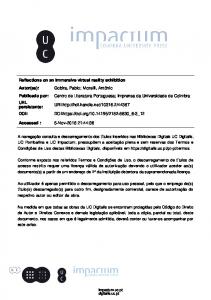
metropolitan riders. Survey results[1] shown Figure indicates that the fact motorcycle that it is used with great usability to support theindriver, it 1-1 is necessary thathigh navigation systems for motorcycles shall be as well. The demand for there are demands of navigation system forequipped motorcycle. navigation can the also be observed from are a survey to Japanese metropolitan Despite the system fact that survey results fromdone 2006, there still has not been a motorcycle riders. Survey results[1] shown in Figure 1-1 indicates that there are high
breakthrough to develop a useful navigation system for motorcycles at the moment demands of navigation system for motorcycle. Despite the fact that the survey results
in 2016. There could be several reasons why but the sensitiveness of riding the are from 2006, there still has not been a breakthrough to develop a useful navigation
motorcycle one of the reasons affecting the issues. systemisfor motorcycles at the moment in 2016. There could be several reasons why, but the sensitiveness riding themotorcycles motorcycle is one the reasons affecting which this issue. While cars have fourofwheels, onlyof have two wheels make the While cars has four wheels, motorcycles only has two wheels which makes the vehicle unstable compared to cars especially under parking state or being rode under vehicle unstable compared to cars especially under parking state or being rode under
10 2 38
51
Strongly demand Demand Do not demand Do not demand at all Figure 1-1 Demands against navigation information in metropolitan area.
Figure 1-1: Demands navigation information in metropolitan area.(Survey by (Survey done byagainst Japan Safe Driving Center[1],translated to English by author.) Japan Safe Driving Center[1], translated to English by author.) 2
2
slow velocity. Though it is known to have stability while riding in some velocity given from trail, mass distributions and gyroscopic effects, it can easily become in an unstable state with inappropriate maneuvers or outer force like rocks on the road surface. Not only rocks or garbage on the road, but any slight thing on the road surface conditions gives significant attention to the motorcycle riders. For example, it is known that riders tend to avoid manhole covers placed in the roadway traffic lanes especially if the road condition is wet or if there is enough road width or traffic lanes[2]. The behavior to avoid manhole occurs because the manhole covers can be slippery especially when wet, leading to compromise riders’ safety. Even if it is not in a wet condition, there are possibilities that there can be heigh difference between the manhole and the surrounding asphalt because of incorrect installation of manholes or from the surrounding asphalt being damaged due to lack of maintenance from but not limited to aged deterioration. Other reasons can be described from the characteristics of the motorcycle riding environment being completely exposed to weather conditions, or the size of the vehicle being smaller than cars.General car has a big front glass and a roof to protect the driver and the equipments from the outside of the vehicle. On the other hand, general motorcycle has only two wheels, a small windshield with no roof where there is almost nothing to protect the rider nor the equipments on the motorcycle or the rider. Since the devices are exposed completely to the environmental conditions, first of all, equipped devices need to be water and dust proof to prevent malfunctions. Also, considering that a display shall indicate informations to the rider, the display shall be legible under various sunlight conditions. Navigation device necessary to equip confront to these severe environmental issues, which to overcome will need technological breakthroughs or all kinds of efforts using current technologies. Motorcycle riders, like other vehicle driver, considers about their safety while riding. Despite the fact that in case of an accident, motorcycle accident severities are high compared to cars due to the riding environment having their body not surrounded by the vehicle. Compared to cars, one slight bump with other vehicle can be fatal, or even a little miss-maneuver can also lead to very dangerous accident. 3
Hence, navigation system needs to care not to compromise the rider’s safety more than the currently provided navigation systems for cars. The stability of the motorcycle, characteristic of the riding environment, and rider’s safety concern different from car drivers, makes the rider’s riding behavior different compared to the car driver. For example, one well known difference is that motorcycle riders are known to look at the road surface more carefully than car drivers since the road condition affects the vehicle a lot more compared to cars[3, 4].
1.1.2
Motorcycle Rider’s Characterful Viewpoint Movement
Since motorcycle riders are known to look at the road surface more carefully than car drivers, motorcycle rider’s viewpoint movement is known to move in a vertical way compared to the car drivers[3, 4, 5]. Regarding the fact, introducing an information presentation system to the motorcycle rider needs to carefully understand the rider’s viewpoint movements. Figure 1-2 and Figure 1-3 shows an example of the viewpoint movement of motorcycle rider and car driver. Figure shown here was obtained using an eye-tracking device used throughout this dissertation. Information about the eye-tracking device and the eye-tracking device’s specifications are described in Section 3.1.3.1. The origin of Figure 1-2 and Figure 1-3 is configured as the vanishing point of the road. The viewpoints are plotted at the sampling rate of 6 data per second, shows the viewpoint movement of riding/driving a straight road for approximately 40 m. The figures shows the characteristic difference of car driver’s viewpoint movements move horizontally and motorcycle rider’s viewpoint movements move vertically. Though it is known from previous research that the viewpoint movement has individual differences[6, 7], the general characteristic of motorcycle rider’s viewpoint moving in a vertical way compared to the car is considered distinguishable[3]. From previous researches, relationship between viewpoint movement and accidents for cars[6] and motorcycles[8] are both suggested. Hence, since the characteristic of viewpoint movement is different between cars and motorcycle and viewpoint movements has relationship with accidents, car’s information presentation can not be simply imported for motorcycle while ensuring rider’s safety. 4
Vertical angle [deg]
20
Motorcycle Rider
15 10 5 0 -5 -10 -15 -20 -20 -15 -10 -5
0
5
10 15 20
Horizontal angle [deg] Figure 1-2: Motorcycle rider’s viewpoint movement example.
Vertical angle [deg]
20
Car Driver
15 10 5 0 -5 -10 -15 -20 -20 -15 -10 -5
0
5
10 15 20
Horizontal angle [deg] Figure 1-3: Car driver’s viewpoint movement example.
5
1.1.3
Issues of Current Information Presentation for Motorcycle
Introduced in Section 1.1.1, the vehicle difference between cars and motorcycles affects the environment for equipping devices to a motorcycle. Motorcycle has very little space for adding a device, which needs to be water and dust proof, and useful under different sunlight conditions1 . These condition are some of the points which is making the car navigation system difficult to be transferred to motorcycle navigation system. On the other hand, recent technological development introduced an advanced type of mobile phone, formally named smartphone, which are nowadays usually pocket-sized with colorful touchscreen interface that covers most of the front surface. Smartphone has a perfect size for being mounted to the handle bar or the body of the motorcycle2 , therefore gained popularity which nowadays have dedicated smartphone mounting products on the motorcycle market. At the same time, many smartphone applications for navigation are currently on the smartphone application market. Smartphone applications are often called “apps”, available through distribution platforms called app stores (e.g. Google Play for Android devices, App Store for iOS devices). Anyone can easily download and utilize a smartphone application distributed through the app stores. Using the smartphone still has problems with LCD legibility under sunlight, and moreover risks of breaking the smartphone is not so small due to weather conditions or by dropping the smartphone to the road surface when mounting or dismounting for operation. Still, since there are plenty of cheap smartphones on the market, and of course smartphone can be used very useful in daily life, many riders choose to utilize smartphone rather than having nothing to obtain navigation information. Not limited in the purpose of obtaining navigation information, recently, usage of smartphone while driving a vehicle is becoming common. However, it has controversial aspects and has been an issue even before the appearance of smartphones. When 1
Such devices are few but on the market, for example, Gathers M G3 by Honda: http://www.honda.co.jp/bike-accessories/gathers_m/navigation_g3/performance04/ 2 For example, “Smartphone holder” by Daytona: http://www.daytona.co.jp/products/ series-S00635-genre
6
mobile phone was first introduced, currently known to be called as “feature phone”, talking on the phone, texting, or other operations on the mobile phone became a wide concern due to distracted driving. Being distracted to the mobile phone is now widely known that it increases risks of accidents because the driver attention gets distracted to the task they are performing[9, 10]. Most of the discussions of distraction focus on cars, however, does not exclude motorcycles in terms of operating the motor vehicle. It also has been studied for cycling which also states about threat to traffic safety[11]. Under current circumstances, many jurisdictions throughout the world have prohibited the use of mobile phones during riding in their countries either in usage of handheld, hands-free or both. Nevertheless, many countries do not fully prohibit the usage of navigation system, which makes the situation complex since smartphones can be utilized and considered as a dedicated navigation system or as a incorporated control system for the vehicle. On the motorcycle market, there are few motorcycle dedicated navigation devices with the concept of mounting a display. The devices can provide anti-glare LCD, waterproof casing, and secure mount which solves most of the issues compared to mounting a smartphone. However, the riders still face problems obtaining information while driving. The LCD is typically mounted to the handle bar or near the speedometer, which is at a very low position of the visual field while driving. Since motorcycle riders keeps high attention to the road surface, the duration capable to obtain information from the LCD is considered very short. Obviously, the motorcycle riders will be capable to look at the LCD while the vehicle is stopped, but obtaining the navigation information only when the vehicle is not moving is very inefficient. The situation is also reported by the Japan Safe Driving Center[1], from questionnaire to riders, found that riders are feeling to have a hard time to look at the LCD while driving. Regarding the rider’s visual behavior, the report[1] concludes with remarks that mounting the LCD is insufficient as a navigation system for motorcycle. Hence, in order to provide useful information presentation, rider’s visual behavior needs to be considered carefully, using different perception needs to be considered. For example, one alternative perception commonly used is through auditorial perception which is 7
currently realized for cars and motorcycle. Formally known as intercommunication system, the development of intercom and wireless earphone realized the navigation system to provide audio information to the rider. Since the rider basically wears a helmet while driving, usage of earphone to provide audio information have good compatibility with motorcycle rider. Some helmets have wireless earphone equipped, reflecting the ease of equipping earphones since the rider is already wearing something on a head covering their ears. Although, audio information is known to have some disadvantages in providing the information accurately to the rider. In order for the rider to understand audio information accurately, the rider needs to take some time and listen until the end of the message. The rider needs to take some time because the auditorial information can only be provided in a steady stream. Also when the rider is not confident about what they think they heard, immediate confirmation is difficult which causes confusion. However, the disadvantages does not mean that audio information is useless. To overcome the disadvantages, additional interface for the rider can be provided to communicate with navigation system. For example, pressing a replay button or speaking a voice command to replay the auditorial information can be utilized for immediate confirmation. Another solution can be to combine with visual perception. Combination of auditorial information and visual information can be seen in recent navigation systems for cars. Car navigation system has been well developed with guidelines[12, 13] including detailed with various concerns including visual information[14]. Visual information is well considered since it is known that drivers rely a high proportion on their visual perception to obtain informations to drive. However, it should be noted that there is room for discussion on how high drivers actually rely on their visual perception and how much proportion can be diverted for navigation information. There has been many arguments regarding that the proportion is about 90 %, but from a legitimate question of “How much of the sensory input used in driving is visual and how much is nonvisual?”, Sivak[15] summarises that 90 % is a prematurely and falsely quantitative number. Sivak’s evaluation results indicated the proportion varies from 83 % to 96 % and concludes that the actual proportion 8
should be considered simply “80 % or more”. As the actual proportion of how much drivers rely on visual information seems high as 80 % or more, the actual quantity is still unclear. Hence, while following the guidelines, using the visual perception for information presentation will still need to be well studied for safety. Providing information visually has the benefit of capable to be obtained whenever the driver thinks they want to obtain. Auditorial information has benefits of not consuming visual perception, disadvantages of where the driver has difficulties to control when to obtain. Two perceptions each has both pros and cons in providing the information, recent navigation system uses both together to complement the shortcomings. Although, there are other concerns about what information to provide, since providing too much information can distract the driver and lead to safety issues. Providing information through whatever perception, it is known that there are limits of amount of information which human can process in a certain time for physiological reasons[16]. Therefore, providing navigation information to drivers are concerned as distraction since it consumes the limited resource of processable information. To ensure driving safety and provide informations, regulations and guidelines[12, 13] has documented the amount of information for certain display positions where it is capable to place a LCD. However, recent technology development using a concept of see-through display has realized to provide informations at positions where LCD not placable. The see-through display is recently known as HUD, can provide information close to where drivers keep visual attention while driving. Utilizing the concept, it is expected to be capable of providing information more efficient and useful compared to placing LCD.
1.1.4
Head-up Display (HUD) for Motorcycle
The emerging technology field named as Augmented Reality (AR) and VR, has realized the ability to actually show see-through virtual informations near to where the driver looks while driving. The AR and VR technologies of providing see-through displays, is usually called as a HUD. Commonly, HUD can be realized by using three components which are, the display device, the optical element, and the combiner[17]. 9
Figure 1-4 illustrates the basic structure of the HUD with indication of the three components and how it can be observed by human. The display device is the component actually showing the information. The display could be an LCD or a projector with a screen to diffuse the light source. The optical element controls the focus of the information to control the focal distance of the virtual information from calculation using the lens formula. The lens formula and the usage is described in Section 3.2.1 with an example of controlling the focal distance for prototyping. The combiner is the component where human eye looks through, which combines the virtual image and what the human eye can see through the combiner. The combiner is generally called as half-mirror since it has the functionality of looking through and reflecting at the same time. Typical glass or acrylic board have few percent of reflectance which can be utilized as a half-mirror by itself, or by sometimes with extra coating to increase reflectance. Although the mechanism seems simple, utilize the HUD with effective usability on the vehicle has been very challenging. Historically, HUD was first proposed for combat aircraft in 1946 by Paul Fitts[18]. Slowly developed through military research, it has gained popularity and manufacture for combat aircraft started in around the 1960s to the 1970s. After then, HUD was first imported for commercial airplanes starting in the 1970s, and gained popularity
Human eye
Combiner (Half-mirror) Virtual image
Optical element (Lens)
Display device Figure 1-4: The basic structure of the HUD. 10
in the 1990s to 2000s. Equipment of the HUD to automotive vehicles has been considered since from around 1985[19], and the first manufactured car with HUD came out in 1988[20] showing a digital speedometer. The HUD development has being researched by car manufactures[21, 22], and the equipment on cars has started to grow in the following years. For example, Nissan 240SX in 1989 and Toyota Crown Majesta in 1991 has been manufactured with the HUD equipped. With using the HUD, early studies[23] indicated the HUD capability of providing information in a shorter time compared to the traditional LCD placed at the middle of the vehicle’s control panel, above or under, the air conditioner and stereo controllers. Although, car HUD did not gain immediate public interest. It did not gain immediate public interest since early HUD could not present various informations, most presenting only display digital speedometers in one color at a high price, which drivers did not think reasonable for purchase. Hence, it needed to wait for technological development for miniaturization of the size with various functionality like colorful projection, and also the cost reduction capable with presenting various types of information for drivers to feel as a reasonable product. Car HUD has started to gain popularities from around the 2000s to the 2010s. Though in the year 2016, car HUD is still in the middle of popularization. With many research and development, improved products are released gradually with new technologies realizing miniaturization of the size and cost reduction of the HUD[24]. One of the newly introduced technology for HUD is the usage of Micro Electro Mechanical Systems (MEMS)-based projector[25, 26, 27]. Utilizing the MEMS-based projector for HUD has realized to manufacture very small display device. With the introduction of MEMS-based projector, the HUD equipment for motorcycle has started to earn real consideration. With recent development using the MEMS-based projector, the HUD became small enough not only as to be equipped on the motorcycle, but small enough to be as a wearable HUD. Some examples of wearable HUD released or considered to be released are Google Glass, Microsoft Hololens, Sony SmartEyeglass, Epson Moverio, Meta Meta2. For motorcycle HUD, regarding the fact to provide information close to where rider’s keep attention, placing the com11
biner regarding the rider’s Field of View (FOV) is necessary. Figure 1-5 illustrates the concept of the motorcycle HUD design considering the motorcycle rider’s FOV. The figure also describes three example of placing the combiner regarding rider’s FOV. The first example ((1) in Figure 1-5) indicates the combiner is equipped to the helmet, or is equipped as a wearable HUD. In this example, the combiner moves according to the movement of the head, therefore, the combiner is always in front of the rider’s eye capable for the rider to see the virtual image. Since the distance between rider’s eye and the combiner is short, a small combiner can cover a wide range of rider’s FOV. The second example ((2) in Figure 1-5) indicates the combiner is equipped to the motorcycle body. In this example, the combiner is fixed to the motorcycle body, therefore, the rider will not be able to see the virtual image when they move their head. Since the distance between rider’s eye and the combiner is longer than the first example, the combiner will need to be bigger in order to cover the same range of rider’s FOV.
Rider’s field of view HUD combiner Virtual image (1) (2)
(3)
Figure 1-5: Illustration of HUD equipped motorcycle, with three example indicating the combiner equipped within the rider’s FOV. 12
The third example ((3) in Figure 1-5) indicates the combiner is equipped to where it is under influence of the front wheel steering angle. In Figure 1-5, it is equipped on the cover of the font wheel, though it has the same meaning to be equipped on the fairing or the handle bar. Fairing is a form of a screen or baffle plate attached in the front part of a motorcycle which used to be called as cowling. Generally, windshields are included in the definition of fairing as a “transparent portion of a fairing”[28]. In this example, since the combiner is equipped under the influence of the front wheel steering angle, the rider will not be able to see the virtual image when they move their head or when they steer the front wheels. Since the distance between rider’s eye and the combiner is longer than the other two example, the size of the combiner needs to be large to cover the same range of rider’s FOV. Figure 1-6 illustrates how the virtual image looks like through the combiner from motorcycle rider’s point of view. While Figure 1-5 indicated three examples, technically, each example is capable to show the same virtual image like Figure 1-6 by configuration of the display device and optical element. Hence, the most important fact is not where the combiner is equipped, but the combiner needs to be equipped capable to show the virtual image considering rider’s visual behavior. For example, a close location where the rider moves their viewpoints while riding. Considering the rider’s FOV is important because if the combiner is placed outside of rider’s FOV, it will have the issues described in Section 1.1.3. In the year 2016, currently there are
Virtual image
HUD combiner
Figure 1-6: Illustrated view of seeing the virtual image through the combiner from motorcycle rider’s point of view. 13
no commercialized motorcycle HUD available for practical use. Although, research study about using the HUD is steadily increasing, and some companies announcing about motorcycle HUD as a near-future product. Recent approach for motorcycle HUD adopts the strategy to equip the combiner on the helmet HUD[29]. The promoted approach typically has the whole HUD equipped on to the helmet. The approach is also known to be called as Head-Mount Display (HMD), especially known as a optical see-through HMD. Though in 2016, the work HMD is recently referred to video see-through HMD which is a type of HMD having a non see-through solid display covering the whole FOV. Hence, to distinguish the difference between a see-through HMD and video see-through HMD, this dissertation uses “HUD equipped helmet” for optical see-through HMD since optical see-through HMD is literally HUD equipped on to the helmet. Despite the fact that the helmet’s primary goal is for safety, or about the usability of the HUD, or both, some HUD equipped helmet has been announced or under develop by various startup companies through successful funding of crowd-fundings. Some notable examples are Livemap3 , NUVIZ4 , and SKULLY5 . Although, providing a useful and accurate navigation information through HUD equipped helmet using current technology still has difficulties, and the affects to the motorcycle rider still remains unclear[30]. Hence, even with successful funding, many startup companies has failed to deliver a product and shutdown the company. NUVIZ and SKULLY has officially shutdown their company and failed to deliver products at a level of production, leaving Livemap to be the only active company at the moment in the end of 2016, which still doing research and development. One of the example of difficulties with the HUD equipped helmet is that there are difficulties for the HUD to consider which direction the rider is facing. When a navigation system wants to inform the rider navigation information, the information displayed on the HUD needs to consider both directions of rider’s head direction and the direction of the traveling vehicle . In case of navigating directions at a crossroads or junctions, navigation system using the HUD equipped helmet will 3
https://livemap.info/ http://www.ridenuviz.com/ 5 http://www.skully.com/ 4
14
need to simultaneously correct the direction in order to navigate the rider to the correct direction. If there are errors or delays for the real time correction, it can cause confusion to the rider or can provide false direction based on false sensing of the rider’s head direction. In order to obtain enough head direction accuracy in real time, integration of expensive large complex sensing system is unavoidable, which will be very difficult not only to equip everything on the motorcycle, but also for the riders to afford the system. Last but not least, information presentation that does not matter rider’s head directions, like digital speedometer, or informations that does not need complex sensing, can exclude some technical difficulties for practical use of HUD equipped helmets. Although, it will still need to consider the rider’s visual behavior for effective use. Recently, not a startup companies on crowd-funding but big companies well known in the automobile industry have also announced about conceptual motorcycle HUD. For example, BMW announced a conceptual motorcycle HUD at CES2016. Therefore, situation of research and development in the motorcycle HUD field is recently changing rapidly. With many companies challenging to realize the motorcycle HUD, it can described as some proof of indication that there are high demands of motorcycle rider wanting an information presentation system capable to look while riding. Though many proposed concepts, reported research progress, or released information from companies, the interest is mainly focused on to the structure of the motorcycle HUD equipped on the helmet. While it is important to address the concept of hardware design for an attractive product promotion, the conceptual design of the software should also be focused since rider’s visual behavior is important. Otherwise, there are possibilities of developing a product with insufficient efficiency continue having the issues described in Section 1.1.3. Described in Figure 1-5, the important fact is not where or how the combiner is equipped, but it is important that to show the correct information considering rider’s FOV and rider’s visual behavior. If there is a purpose of the information to present, for example navigation information, the motorcycle rider’s visual behavior shall be considered first or at the same time when designing the hardware, and determine what kind of information presentation 15
is efficient. Information presentation for motorcycle HUD shall be understandable to the correspondent, designed regarding the correspondent’s capabilities in mind. In terms of “information presentation”, it refers to a relationship between something presenting some kind of information to the receiver human. However, if the information presented is man-made, the information presentation can be described as a method of communication or approach of communication between humans. Historically, communication has evolved to overcome the imperfection of speaking and hearing between humans. For example, hearing using auditorial perception requires the correspondent to receive the information when the information is presented. If the receiver human failed to hear a part of information, it becomes very hard for the receiver to understand the full meaning of the information. The case with the issue within information presentation for motorcycle is described in Section 1.1.3. Moreover, communication only using speaking and hearing requires the information presentor and receiver to understand the same language, and requires the receiver to be in the same place and time. The basic information exchange using auditory has limitation that the information can only exist at the moment when the information presentor is speaking the information. To insure a longer existence of the information, methods of using symbols or drawing paintings has been developed in the prehistoric times, which can still be observed as cave paintings or parietal arts. While the drawings were first not well standardized, it developed symbolic written language to improve the accuracy to pass information from the provider to the receiver visually. After several years, writing has evolved to preserve permanency of what is written down, and also alphabets invented for effective communications. Instead of direct auditorial conversation between humans, passing written or dawned information visually has introduced consideration of interaction between the information presentor and human receiver, regarding the presentor being an object (paper or walls) where the information is presented or the information presentation language (symbols, alphabets). Hence, within the case of information presentation for motorcycle HUD, considering the interaction between the information and human needs to 16
be focused. A short summary for Section 1.1 are described as follows. This section first described the current situation of information presentation for motorcycle in Section 1.1.1. Section 1.1.2 explained about the motorcycle rider’s visual behavior having a characterful viewpoint movement. Regarding the rider’s visual behavior, Section 1.1.3 described issues of current information presentation for motorcycle. Section 1.1.4 introduced the HUD for motorcycle as a solution to present information within the motorcycle rider’s FOV. Furthermore, information presentation design considering the rider’s visual behavior is needed to be well understood for motorcycle HUD.
1.2
Research Purpose
This section will first describe the main purpose, and briefly describe about the research approach. Subsequently, the second key claim point is described, which is the research approach. Details of the research approach is described in Chapter 2. In Section 1.1, the current situation and the issues of information presentation for motorcycle has been reviewed. From the literature review, the underlining issue can be understood that considering the rider’s viewpoint movement is necessary for motorcycle information presentation. Recent approach propose the use of HUD which are already used on other types of vehicles. Recent technology development has realized to miniature the size of the HUD, capable to be equipped on the HUD Some conceptual proposal has been released from several manufacture companies though it is not yet practical. Therefore, as illustrated in Figure 1-7, the main research purpose in this dissertation is to propose and design information presentation for motorcycle by considering motorcycle rider’s viewpoint movement. While the main purpose of this research is to design information presentation for motorcycle, furthermore, the research approach is another key claim point. The research approach explained in Chapter 2, is an approach of enabling the VR environment to perform Human-in-the-Loop Simulation in the early stage of design pro17
cess. Typically, the use of Human-in-the-Loop Simulation with VR environment can been seen from many research using the Human-in-the-Loop Simulation to perform simulations for evaluating the target system (For example, car steer-by-wire system evaluation[31], study on rollover prevention for sport utility vehicles[32], control of a wheel loader[33]). Though in this research, the Human-in-the-Loop Simulation is only enabled as an enabling system to design a different target system, simulated through the Human-in-the-Loop Simulation. Described in Section 3.2, the target system’s design is driven by hardware prototyping and evaluated by observing physiological responses. Figure 1-8 shows the illustrated enabled system. Section 2.1.2 describes in details about how the VR environment Human-in-the-Loop Simulation enabled for design of information presentation for motorcycle, and the configuration of the enabling system is described in Section 3.1.
Rider’s field of view Information
Viewpoint movement Figure 1-7: Illustration of information presentation design for motorcycle considering rider’s viewpoint movement.
Human-in-the-Loop Simulation VR Environment
Rider
Riding Scenery Motorcycle Simulator
Figure 1-8: Illustration of VR environment Human-in-the-Loop Simulation. 18
To design an information presentation system for motorcycle, this dissertation propose an motorcycle HUD. To realize the information presentation system, the Systems Engineering (SE) approach was adopted based on ISO:15288:2015 [34]. Detailed reference from the Systems Engineering Handbook, the design approach adopted in this dissertation describes the System-of-Interest (SOI) and the enabling systems. The adopted research approach utilized the methods of Modeling and Simulation[35, Section 9.1], in a fairly early stage, the concept stage, in the process of system life cycle process. Usage of live operators, the rider for this dissertation, in simulation is typically called as Human-in-the-Loop Simulation, and with implementing the human as an element to highly considered into the SE process is named as Human Systems Integration (HSI)[35, Section 10.13]. In this research, since it is critical to violate motorcycle rider’s safety, the human consideration has been used as to conduct Human-in-the-Loop Simulation to determine the information presentation design parameters for motorcycle HUD in the early stage of design.
1.3
Research Outline
The remainder of this dissertation is organized as follows. Chapter 2 focus on how the design of motorcycle HUD, defining the research approach and defining the scope of this dissertation based on SE process. It briefly describes the design parameters for the motorcycle HUD. Chapter 3 describes about the experimental environment to conduct Human-inthe-Loop Simulation experiments to clarify and define the effective use for the HUD. It will describe about the immersive VR environment, and about the prototype of the motorcycle HUD used in the experiments to determine the values of the motorcycle HUD design parameters. Chapter 4, Chapter 5 and Chapter 6 discuss about conducted experiments to determine the design parameter values of the motorcycle HUD. Chapter 7 concludes this dissertation, about how Human-in-the-Loop Simulation was effectively used utilizing the VR environment to determine the design parameters of motorcycle HUD.Finally, 19
limitations of this research and possible research foresights will be briefly explained. Figure 1-9 illustrates the outline of this dissertation.
Chapter 1. Introduction Chapter 2. Information Presentation Design of Motorcycle HUD Chapter 3. Experimental Environment Chapter 4. Information Presentation Position
Chapter 5. Information Presentation Quantity
Chapter 7. Conclusion Figure 1-9: Dissertation outline. 20
Chapter 6. Information Presentation Timing
Chapter 2 Information Presentation Design for Motorcycle HUD The purpose of information presentation design for motorcycle HUD is to realize information presentation considering rider’s viewpoint movement. As a future prospect of the information presentation, it aims to realize an information presentation capable of providing navigation information. This chapter shows firstly the information presentation conceptual design, and then specify the information presentation system based on the Systems Modeling Language (SysML)[36]. Next, the Virtual Reality (VR) environment is introduced as an enabling system for the design of information presentation system. Finally, the SysML model of test environment is described to carry out prototyping in the test environment to determine the design parameters for the information presentation system.
2.1
Concern in Design of Information Presentation for Motorcycle HUD
The design performed in this dissertation is a design process inside the concept stage and development stage described in the system life cycle[37]. Described in Section 1.1.3, the current issue of information presentation for motorcycle is that to 21
realize an useful information presentation, the rider’s viewpoint movement needs to be considered. Hence, the Systems Engineering (SE) approach was adopted for the design of information presentation to consider rider’s viewpoint movement from the early stage of design. The SE approach was adopted to • explore, define, refine feasible concepts. • propose, define, refine viable solutions. • describe the architecture and the design of the system.
2.1.1
Boundary of the Information Presentation System for Motorcycle HUD
In this dissertation, the preliminary concept is to provide the navigation information legible while driving in a safe way. From the understandings of riders behaviors, the information presentation needs to be concerned to realize such system. Adopting the SE approach, rider’s viewpoint movement can be considered from the early stage of design. The term “early stage of design” can be described withing the stages of generic life cycle stages[37] which defines a framework of life cycle stages that helps ensure that the system meets its required functionality throughout its life from the concept stage to the retirement stage. Although the standardized stages are described independently from concept stage, development stage, production stage, utilization stage, support stage, and retirement stage, the activities constituting these stages can be in practice interdependently. Figure 2-1 illustrates the generic life cycle stages with example of iteration and recursion of the stages indicating the interdependency between the stages. Inside the figure, the research scope of this dissertation is indicated with a highlighted background, which are the concept stage and the development stage. Hence, while this dissertation adopts the SE approach and is within the concept stage and the development stage of system life cycle it will not discuss about stages later than the development stage. Note that in case of developing a product, adopting the SE approach shall consider all life cycle stages for 22
a successful product. To start the concept of the information presentation, first, Figure 2-2 shows a context diagram of motorcycle generic use. Context level for use of motorcycle can be described briefly with the motorcycle rider, the motorcycle, the road, and the path to destination. Generally, when the motorcycle rider rides the motorcycle they head to a specific destination by riding on the roads. The path to destination is the path or route of which roads to take to arrive at the destination. In case if the rider can not obtain the information of path to destination, the motorcycle rider needs to be
Utilization Concept
Development
Retirement
Production Support
Figure 2-1: System life cycle stages and possible iteration/recursion,with the research scope indicated in highlighted background.
Motorcycle Rider
Motorcycle
Path to Destination
Road
Figure 2-2: Context diagram of motorcycle generic use. 23
aware of the paths to the destination. Fairly, it is possible for the rider to memorize or be aware of the paths if the route is not complicated or if the path to take is part of a daily routine. Although, usage of navigation information can be beneficial when the rider’s destination is an unfamiliar location or when the information can provide a faster paths to avoid traffic even for memorized paths. As described in Section 1.1.1, there are high demands for motorcycle riders in the metropolitan area, where the area has many crossroads. Therefore, navigation information to inform the motorcycle rider the path to direction is necessary. Figure 23 describes the context of navigation information for motorcycle. In Figure 2-3, the center is the Navigation Information for Motorcycle which implies the future prospect of the research scope shown with interactions with the surrounding elements to consider. One and the most important functional requirement for Navigation Information for Motorcycle can be described whether the navigation information can actually navigate the motorcycle rider to the presented direction leading to the destination. Figure 2-4 illustrates the context of the interaction between the Motorcycle Rider and the Navigation Information for Motorcycle. As illustrated in the figure, the Motorcycle Rider receives the Direction to go at the intersection which is the output of the Navigation Information for Motorcycle processed through the Information Presentation. To understand whether the Motorcycle Rider understood the correct
Motorcycle Rider
Navigation Information for Motorcycle
Path to Destination
Figure 2-3: Context diagram of navigation information for motorcycle 24
direction or not, usability analysis within the Human Systems Integration (HSI) can be used[35, 38]. HSI is known the possibility to improve the overall system design by implementing to the SE practice for integrating human considerations. Especially implementing at an early stage of the design, it is known to have the ability to ensure the HSI domain of Safety[35, Section 10.13.2.1, p. 240]. For this research, the Safety promotes to minimize the motorcycle rider’s risk of accident, cause of death, or serious injury. Using Figure 2-4 as an example, the factors that threaten the safety of the rider can be described on both on the input and the output. For example on the output, it can be describes like “Encounter danger because of looking at the information presentation”, “Misunderstanding the information presentation”. In this dissertation, Output of the system was mainly focused since the Output is generally done while riding, which regarding HSI Safety, the severity against the driver is critical. Though it does not mean that Input is not important, but in normal case when the rider wants to input destinations is before the rider starts riding. The concept of separating the Input and the Output is common when considering navigation information systems for automobile. According to Dingus[39], human factors design for automobile navigation systems has a design principle to first consider whether the represented functionality is demanding a task to the driver when the vehicle is “pre-drive” or “in-transit”. “Pre-drive” the planning and attention demanding tasks(e.g. The rider to input the destination coordinate), and the “in-transit” consists
Output Direction to go at the intersection
Input Coordinate of destination
Information Presentation
Route Calculation
Motorcycle Rider
Navigation information
Calculated information
Navigation Information for motorcycle
Figure 2-4: Interaction between the motorcycle rider and the navigation information for motorcycle. 25
tasks that are necessary for efficient system usage while the vehicle is in motion[40]. Consideration of where the demanding tasks is “Pre-drive” or “in-transit” is important since the required attentions and tasks while driving differs from before the driver actually starts driving. Note that “Pre-drive” does not include when the vehicle is stopped or parked since the vehicle has already started to drive and is “in-transit”. When the vehicle is stopped or parked is considered as “zero speed” category within the “in-transit”[41]. For example, the “zero speed” in “in-transit” can be seen in modern car navigation system as providing functions of reconfiguration of destination information or choosing alternative paths to destination only when the car is stopped or driving under very low speed. Since “in-transit” functions should be limited to necessity and convenience[39], the Information Presentation should be the only functionality described in Figure 2-4 to be used regarding the Safety within the HSI domain. Focusing on the Information Presentation, to proceed with the design based on SE approach, it is important to identify what is internal or what is external to the system to design which has the functionality of Information Presentation. Work on the SE process at a high level of abstraction can be established using the SysML[36] considering Information Presentation as a Information Presentation System. According to Friendenthal[42], SysML is a specification defining a graphical language for constructing and documenting visually the system architecture to support the specification, design, analysis, and verification of systems that may include hardware and equipment, software, data, personnel, procedures, and facilities. As an extension of the Unified Modeling Language (UML) version 2, SysML can represent requirements, behavior, structure, and properties of the system and its components. It is widely accepted from a broad range of industry domains such as aerospace, automotive, health cares and others. Figure 2-5 shows the nine basic diagram in SysML divided into three general sets[43]. The general sets are the “Structure Diagram”, the “Behavior Diagram”, and the “Requirement Diagram”. Also the “Parametric Diagram” is to be noted as a key diagram in SysML, which is considered in the general sets of “Structure Diagram” to describe the constraints among the properties associated with blocks used in the diagrams. SysML is intended to be only a help to specify and 26
architect systems, therefore, it does not mean it needs to use all nine diagrams to represent the system in the SE process. Using the SysML as an enabler to describe the SE process, it is necessary to draw the diagrams by selecting the necessary diagram and drawing diagrams as many as necessary at the necessary stage of system life cycle. In this section, “Block Definition Diagram” from the “Structure Diagram” set, “Use Case Diagram” and “Activity Diagram” from the “Behavior Diagram” set have been created to describe the Information Presentation System. Although the diagrams are SysML diagrams, the diagrams used in this dissertation will be understandable from knowledge of UML 2.x. “Activity Diagram” in SysML is an extended diagram of UML’s “Activity Diagram”, “Block Definition Diagram” is an extended diagram of UML’s “Class Diagram”, and the “Use Case Diagram” in SysML is basically the same with UML’s “Use Case Diagram”. Though in case for details of specification of SysML diagrams, see the official pdf[43] or Friendenthal’s “A Practical Guide to SysML The Systems Modeling Language”[42]. Figure 2-6 shows the block definition diagram for the Motorcycle Navigation Domain. A block definition diagram is a diagram often used to describe the hierarchy of a system which the blocks are used to define a system or component at any level of the system hierarchy. The Information Presentation System is defined in the figure as the System-of-Interest (SOI) and the external systems, users, and other entities SysML Diagram
Requirement Diagram
Behavior Diagram
Activity Diagram
Sequence Diagram
State Machine Diagram
Block Definition Diagram
Use Case Diagram
Structure Diagram
Internal Block Diagram
Parametric Diagram
Figure 2-5: SysML Diagram Taxonomy 27
Package Diagram
which the Information Presentation System may interact. It is to be noticed that the Motorcycle with Navigation System is composed of the Motorcycle, Information Presentation System, and the Navigation System, indicating that the Information Presentation System is a part of the Motorcycle with Navigation System, since it is defined to present navigation information in this research. The Physical Environment is composed of the Road and the External Entity. The External Entity can represent any physical object such as a traffic light or other vehicles to describe traffic or weather which the Rider interacts. The interaction between the Rider and the External Entity can impact influences to how the Rider interacts with the Motorcycle and the Information Presentation System. For example, when the Rider sees a traffic light changing from green to yellow, the Rider needs to apply brakes to stop the vehicle instead of following the navigation information presented through Information Presentation System. For cases like External Entity representing multiple objects or entities, multiplicity symbol is sometimes added above the block, on the right side of the arrowhead. The multiplicity symbol was omitted in Figure 2-6 for simple understanding of the Motorcycle Navigation Domain structure. Though in case to indicate a multiplicity symbol, for example, to indicate External Entity can represent more
bdd [Package] Structure [Top Level Hierarchy]
Motorcycle Navigation Domain
Rider
Motorcycle
Motorcycle with Navigation System
Physical Environment
Information Presentation System
Navigation System
External Entity
Road
Figure 2-6: Block definition diagram of the Motorcycle Navigation Domain showing the Information Presentation System as the system of interest, along with the Rider and the Environment. 28
than one entity, it can add a multiplicity symbol 0..* to represent an undetermined maximum number of external entities. With the defined blocks in Figure 2-6, the high-level functionality involved in operating the motorcycle with the navigation system can be described using a use case diagram. A use case diagram is a diagram used to describe the relationship between, the use cases contained in the subject as a functionality, and the actors that is external to the subject. Figure 2-7 shows the use case diagram of the Operate Motorcycle with Navigation System with the Run Motorcycle, Present Navigation Information, and Present Navigation Information contained as use cases. The Motorcycle with Navigation System is the subject in Figure 2-7 and is depicted as a rectangle. The Rider and the Physical Environment is an actor that is external to the Motorcycle with Navigation System shown as a stick figure. Figure 2-7 shows that the Motorcycle with Navigation System is used by the Rider to achieve the Rider goals defined by the use cases. The relationship between the use case Navigate Path to Destination and the use case Present Navigation Information is called the include or inclusion relationship. The inclusion represents that the Present Navigation Information use case defines common functionality that is always performed when the Navigate Path to Destination use cases are performed. Since Figure 2-7 is shown at a high-level of abstraction, therefore, the composition of the Motorcycle with Navigation System is not described as actors but included inside the rectangle. To describe the use case Present Navigation Information with the composition of the Motorcycle with Navigation System, especially the SOI which is the Information Presentation System, specification of the use case is necessary. Figure 2-8 shows the use case diagram at hierarchy level of the Information Presentation System. Defined by the block definition diagram in Figure 2-6, Motorcycle and Navigation System is external of the Information Presentation System. Figure 2-8 use case diagram describes that the Information Presentation System has the functionality of Present Navigation Information. It is to be noted that external to Figure 2-8 diagram, the Physical Environment still has relationship since the Present Navigation Information is an inclusion of Navigate Path to Destination shown in Figure 2-7. 29
Hence, the relationship is illustrated connected to the Motorcycle and the Navigation System. The emphasis of Information Presentation System is the operational use case of Present Navigation Information to address information presentation to the rider. Therefore, to consider the relationship between the Rider and the Information Presentation System, the behavior of the Present Navigation Information shall be described. The behavior for the Present Navigation Information use case in Figure 2-8 is shown as the activity diagram in Figure 2-9. The activity diagram expresses the emphasize of input and output flow as well as control flow of the behavior. The Present Navigation Information use case diagram in Figure 2-8 show the Rider, the Information Presentation System, the Navigation System and the Motorcycle as actors. To distinguish the interactions within the Present Navigation Information, Figure 2-9 shows the actions required for the actors in the Present Navigation Information. The activity partitions, also known as swim lanes, correspond to the Rider, the Information Presentation System, the Navigation System, the Motorcycle, and the Physical Environment which is composed of the Road and the External Entity. All the blocks
uc [Package] Use Case [Operate Motorcycle with Navigation System]
Motorcycle with Navigation System Ride Motorcycle
Rider
Navigate Path to Destination
Physical Environment
Present Navigation Information
Figure 2-7: The use case diagram of the rider operating the Motorcycle with Navigation System. 30
here are from the block definition diagram in Figure 2-6. The actions in the activity partitions specify what action the actors needs to perform. Since the behavior is a continuous state of “in-transit”, it does not have a initial node or final node, but continuously interacts with the Physical Environment. Based on the Figure 2-9, the Rider performs an action to Recognize information based on the visual information from External Entity(e.g. traffic condition, traffic light, weather conditions) and the direction information from Information Presentation System. After Recognize information, the Rider then Decide direction, and Operate motorcycle. The Information Presentation System performs an action to Present information, and the Navigation System performs Calculate route. The Motorcycle receives the command from the Rider performing Operate motorcycle, which will move the motorcycle reflecting to the Road as vehicle force. Hence, while the SOI is Information Presentation System, from the activity diagram Figure 2-9, the system and actions required to design the Information Presentation System has been described for the motorcycle HUD.
uc [Package] Use Case [Navigation Information Presentation to Rider]
Information Presentation System
Rider
Motorcycle
Present Navigation Information
Physical Environment Navigation System
Figure 2-8: Use case diagram of Information Presentation System. 31
32
direction information flow
accelerate, brake, steer command flow
navigation information
: Calculate route
: Run motorcycle
vehicle force flow vehicle force
: Provide physical environment information
visual information
: External Entity
: Physical Environment
location information
: Road
: Receive vehicle force
location information flow
: Motorcycle
visual information flow
: Navigation System
Figure 2-9: Activity diagram of Present Navigation Information.
operate command flow operate command accelerate, brake, steer command : Operate motorcycle
: Present information
navigation information flow
: Information Presentation System
direction information direction knowledge flow direction knowledge : Decide direction
: Recognize information
: Rider
act [Activity] Present Navigation Information
2.1.2
Enabling Virtual Reality Environment
To proceed the Information Presentation System design considering based on the activity diagram of Figure 2-9, the Physical Environment and the Motorcycle can be considered to lead to the Rider ’s safety issue when performing tests of Information Presentation System using actual human Rider. From block diagram definition in Figure 2-6, Physical Environment can be identified with the Road and the External Entity. The External Entity can represent any physical object, such as a traffic light or another vehicle, with which the Rider interacts. Since the Information Presentation System is the SOI to design, the Physical Environment interacting with the Rider needs to be controlled safely. System design under circumstances that have safety issues often adopt an approach to use simulations. While there are different types of simulations, a simulation type called Humanin-the-Loop Simulation can be considered in the case when the human element is important and when simulation is necessary. Human-in-the-Loop Simulation has a characteristic of simulation executed in real time with computer-based models to close the inputs and outputs with a human element of the system[35]. Normally the simulation approach is used for the SOI, though in this dissertation it aims to apply the Human-in-the-Loop Simulation as an enabling system. As described in Section 1.1.3, since the Information Presentation System shall consider the rider’s viewpoint movement to solve the current issues, the visual information in Figure 2-9 needs to provide high presence similar to which is provided by the External Entity so the Rider can perform the Recognize information action in a similar action to when the Rider receives the visual information from the External Entity. To ensure the design of Information Presentation System to be useful not only in the simulation but also when it is used in the Physical Environment, providing high presence visual information is necessary. Furthermore, the visual information and the location information shall be synchronized in a continuous way provided from the simulation. To introduce such simulation environment, this dissertation enabled the immersive VR environment and constructed an immersive Cave automatic virtual 33
environment (CAVE) Motorcycle simulator as a enabling system. Details about VR and the constructed simulator is described in Section 3.1. The immersive CAVE motorcycle simulator was put to use with the following block definition diagram in Figure 2-10. The Immersive CAVE Motorcycle Simulator is composed of the Motorcycle Simulator and the Immersive CAVE. Adopting the Immersive CAVE Motorcycle Simulator, the activity diagram in Figure 2-9, Figure 211 illustrates the behavior of the constructed simulator. Comparing with Figure 2-9 and Figure 2-11, the Immersive CAVE replaces the whole Physical Environment and the Motorcycle Simulator replaces the Motorcycle. Although, the replacement is designed not to change the basic actions and flows for the Rider, the Information Presentation System, and the Navigation System. If the actions and the flows changes, especially the Recognize information action for the Rider changes, there is going to be possibilities to fail at performing final tests before the production stage in the system life cycle, or fail when system validation is performed. It shall also be noticed that the continuous flow is forming a loop in Figure 2-11, between the Rider and the Immersive CAVE Motorcycle Simulator. The loop is what can be described as the Human-in-the-Loop Simulation, as the Rider close the inputs and outputs of the Immersive CAVE Motorcycle Simulator. Since the behavior is showing an closed loop, bdd [Package] Structure [Immersive CAVE Motorcycle Simulator]
Immersive CAVE Motorcycle Simulator
Motorcycle Simulator
Immersive CAVE
Figure 2-10: Block definition diagram of the immersive CAVE motorcycle simulator. 34
35 accelerate, brake, steer command flow
visual information
: Run motorcycle
vehicle force information
vehicle force information flow
vehicle motion information : Calculate dynamics
vehicle motion information flow
: Provide location information flow location information environment information
Figure 2-11: Activity diagram of immersive CAVE motorcycle simulator enabled for Present Navigation Information.
operate command flow operate command accelerate, brake, steer command : Operate motorcycle
direction knowledge flow direction knowledge : Decide direction
: Calculate route
: Immersive CAVE
: Immersive CAVE Motorcycle Simulator : Motorcycle Simulator
visual information flow
: Navigation System
navigation information
navigation information flow
: Information Presentation System
direction information flow : Present : Recognize information direction information information
: Rider
act [Activity] Immersive CAVE Motorcycle Simulator
initial node has been added to the Provide navigation information to indicate where the simulation will start. A short summary of this Section 2.1 is organized as follows. The information presentation system for motorcycle HUD has been described using SysML. The SOI boundaries have been clarified using the block definition diagrams and the use case diagrams. From activity diagrams, the actions and the flow for the information presentation system has been described with interacting external systems. To plan tests for the information presentation system, considering rider’s safety, simulation approach has been applied. An immersive VR environment was introduced as an enabling system to serve the test environment to perform the Human-in-the-Loop Simulation. Since now the information presentation system has been described along with the enabling system, the design consideration of information presentation for motorcycle HUD can be processed.
36
2.2
Design Parameters of Information Presentation
Described in Section 1.1.4, the HUD has a history of being equipped on vehicles, which some design consideration can be used within the case of equipment to the motorcycle as well. Especially literatures for car HUD has similar conditions since car and motorcycle share the same road to drive or ride. When applying the HUD to the motorcycle, first, considering some physiological aspects of human vision perception is necessary. Human visual perception can be described in various parameters[44, 45], and HUD[46, 47] related parameters can also be determined. While it focuses on how to configure the hardware of the HUD the basic message addressed is “to provide information not to disturb attention to driving operations”[47] which is same when considering information presentation design. Though the hardware parameters are considerable parameters, the design parameters for the information itself needs to be considered from a different approach. Information presentation considering viewpoint movements will not be realized by only the hardware, but rather the design of the presented information itself needs to be carefully considered. The design parameters for navigation information itself, has been discussed for cars around when the HUD first started to be equipped. According to Lunenfeld[40, 48], for information gathering and processing, there are three main consideration necessary to concern for motorist navigation and information systems. In both low and high demand situations, drivers must possess a suitable store of information, including a trip plan, and must be provided with an appropriate array of needed information, when they need it, where they require it, and in a form best suited to their characteristics. While the best suited to their characteristics are not described in the same section, Lunenfeld describes it later in the same paper (in the section Characteristics Affecting Information Handling) as follows. Too much information, displayed too fast, could lead to overload, while too little information could lead to decreased vigilance. 37
While it states related to when they need it, the quantity of information is discussed as the important characteristics to consider for information handling. Dingus and Hulse[39] addressed more detailed design considerations and recommendations for car navigation information system including the considerations from Lunenfeld’s work[40], adding some design considerations featuring the HUD as well. In the subsection of Display location: To HUD or not to HUD?, discussing about the importance of display placement of the navigation system suggesting to display the information close as practical to the forward field of view. From the above literatures, the design parameters for information presentation can be summarized to the following three parameters. • Information Presentation Timing • Information Presentation Position • Information Presentation Quantity Since the information presentation is done by display device, the parameters does has constrains from the display device. For example, lack of luminance of the information has been a long issue. Without the required luminance, the presented information can not be recognized by the rider. For the luminance issue, as discussed in Section 1.1.4, MEMS type laser-projector has ensured some luminance and device size capable to equip on to the motorcycle. Though the laser-projector still lack of some luminance under severe weather conditions, but it can be expect that technology development solves issues relying with luminance and weather conditions. Hence, the design parameters featured in this dissertation is focused on information presentation parameters to be investigated through measuring human physiological reaction, on When, Where, and Characteristics(How much?) to present. Summarizing in a simple form, the obtained concerns to design of information presentation for motorcycle HUD can be listed as follows. 1. Motorcycle riders needs to look at the road condition carefully than car drivers (From Section 1.1.2) 38
2. Motorcycle riders have difficulties looking at mounted LCD (From Section 1.1.3) 3. Motorcycle riders shall be able to confirm the information when rider’s needs the information (From Section 1.1.3) 4. Visual information presentation for motorcycle rider needs to consider the rider’s characterful viewpoint movement (From Section 1.1.4) 5. HUD technology can be utilized as as solution to present information within rider’s FOV (From Section 1.1.4) 6. Design of information presentation shall use HSI to insure rider’s safety (From Section 2.1.1) The first and second concerns are described from literature review of motorcycle rider’s current situation of obtaining information. The third concern indicates that the navigation system shall provide information when the rider needs the information, like situations in case of confirmation of the information. While the third concern come from a perspective by using audio, unless integrating another system to confirmation the information, there are not many alternatives. The forth to sixth insight are the concerns from literature review and the adaptation of SE, in how to develop and realize the information presentation system. While the forth concern states to consider the rider’s characterful viewpoint movement, it will also need to consider the sixth concern, about safety. In order to consider both concerns, an environment for design needs a simulator to ensure the safety for design process, and the simulator will need capable to simulate the rider’s characterful viewpoint movement. Therefore, enabling system of immersive VR environment is necessary to simulate the riding environment. Within the environment, prototyping the Information Presentation System shall be necessary. Figure 2-12 shows what has been prototyped within the activity diagram shown in Figure 2-11. Comparing Figure 2-12 and Figure 2-11, the Motorcycle HUD, which is the Prototype, has replaced the Information Presentation System. In the following Chapter, Section 3.2 will described the details about the constructed prototype. 39
40 accelerate, brake, steer command flow
: Calculate route
visual information
: Run motorcycle
vehicle force information
vehicle force information flow
vehicle motion information : Calculate dynamics
vehicle motion information flow
: Provide location information flow location information environment information
Figure 2-12: Activity diagram showing prototyping the Motorcycle HUD for Information Presentation System.
operate command flow operate command accelerate, brake, steer command : Operate motorcycle
direction knowledge flow direction knowledge : Decide direction
navigation information flow
: Immersive CAVE
: Immersive CAVE Motorcycle Simulator : Motorcycle Simulator
visual information flow
: Navigation System
navigation information
: Motorcycle HUD
direction information flow : Present : Recognize information direction information information
: Rider
: Prototype
act [Activity] Prototype of Motorcycle HUD in Immersive CAVE Motorcycle Simulator
Chapter 3 Experimental Environment This chapter describes about the experimental environment which was used to conduct experiments to clarify the design parameters for the motorcycle HUD. As discussed in Subsection 1.1.2, the viewpoint movement of motorcycle rider differs from car drivers’ viewpoint movement. Therefore, the environment to conduct motorcycle experiment shall ensure a similar environment to the real world environment, whereas the motorcycle rider performs a similar reactive viewpoint movement. Regarding the motorcycle riders’ characterful viewpoint movement, it is necessary to use an environment with large angle of FOV. Utilizing simulation environments that provides wide range of user’s FOV, such as an immersive projection environment can be considered to be an useful approach. Immersive projection system such as a CAVE[49], is capable to cover broad range of the user’s FOV. The CAVE provides high realistic views of virtual environment, which is considered to be an adequate environment for simulating car driving or motorcycle riding. This chapter is organized as follows. Section 3.1 describes about enabling the CAVE as an immersive CAVE motorcycle simulator. Viewpoint movement comparison has been done between the real world, non-immersive environment(3-LCD), and the immersive CAVE[50]. Section 3.2 will describe about prototyping the motorcycle HUD for experiments to determine the values of motorcycle information presentation design parameters[51]. 41
3.1
Immersive Virtual Reality Environment
Throughout the world, there are many types of motorcycle riding simulator environments regarding to the purpose of the simulation. For example, basically each Japanese driving schools have a simulator to teach a mandatory course to their students about safe-driving and dangerous driving and situations. In this case, since the purpose of the simulator is teaching basics about safety driving, so the most important element in developing the simulator is to implement scenarios and the user experience to feel dangers. For research purpose development, while it is understandable the ideal to aim developing a simulator very similar to the real world riding environment, the difficulty of research analysis and the environmental realism are in proportional relation, so developing a high realistic simulator is not always suitable for simulation research. One of the benefits of enabling a simulation environments for research is that it can easily produce the same environmental conditions between trials, and or can easily change one or several condition. Various conditions in the real world environment are full with uncertainty, like weather conditions, traffic conditions, pedestrian existence, road surface conditions, and but not limited to, conditions of the vehicle’s components like wheels, chassis, engine to screws degradation. So simulating every conditions similar to realistic conditions is very challenging, therefore, many simulation study mainly focus to simulate the important perspectives to the research purpose. In this dissertation, as described in Section 2.2, the main purpose is to determine the values of design parameters for information presentation considering motorcycle rider’s viewpoint movement. So the important factor to consider for the simulator is that the simulator shall provide an environment that motorcycle rider can perform a similar reactive viewpoint movement to the real world. Furthermore, the experimental successfulness relies almost entirely on to how the simulated environment will be showing the driving environment to the motorcycle rider’s. 42
3.1.1
Immersive CAVE
Constructing a motorcycle simulator with high visual presence can be considered as constructing an virtual reality environment, especially when have a real human interacting with the simulator. Starting with some definitions, the virtual reality environment is known to be defined by the I 3 for “Immersion-Interaction-Imagination”[52] or described by using the Autonomy, Interaction, Presence (AIP)[53]. Although many people described the term Virtual Reality in many ways[54, 55, 56], including the introduced two definition above, it appears that the important concepts can be summarized to the following three. • Interaction in real-time • Immersion in real-time • Environment in 3D realistic For more definitions and understanding about the definitions can be found in work by Søraker[57]. Taking Zelter’s AIP cube[53] as an example, applying to the immersive CAVE motorcycle simulator, the VR simulation considering rider’s visual perception, immersiveness of the simulator can be seen as one of the variable influencing the Presence element, whereas the simulator can be described as a variable in the Autonomy and Interaction. For the Presence element, there can be two basic technical approach to increase the immersiveness for the motorcycle rider. 1. Use a non-transparent HMD coving the FOV right in front of their eyes 2. Use big screens covering the whole surroundings of their body Both approach basically aims to cover the rider’s FOV, though the main difference is with the characteristic of where the display is placed. Since the HMD’s display is mounted to the rider’s head, the HMD needs to update the displayed world in a high frequency with high accuracy depending on the rider’s head movement. Furthermore, 43
since the rider’s FOV is covered by a display, the rider can not see the motorcycle’s body or handle, and moreover, they can not see their hands or arms. Of course, utilizing various types of sensors may help simulating the driving world and the motorcycle itself or the covered hands and arms, though the sensor itself can only sense after the head movement, which always cause delays to update the display showing the visual riding environment. Covering the rider’s surrounding with big screens is more realistic approach, since the screen is always showing the correct visual riding environment. Although, it still needs to sense and apply the head movement to the displayed riding environment, though it still is capable of showing the correct previous frame of the riding environment, so the rider can still see the correct visual environment in the correct direction. There are also benefits that rider can see the motorcycle’s body, and their own body parts. Although, compared to the first approach, huge screens big screen which can be or more than 2 meters by 2 meters per direction, is a huge simulator, regarding not only the actual size but the financial costs and the difficulties in developing the application that is capable of syncing all the screens. Putting aside the cost issues, considering the user experience capable to provide to the rider, the most important aspect is how to provide high visual riding environment. Therefore, construction and utilization of the second technical approach was chosen in this dissertation. In detail, the CAVE system was enabled as an immersive CAVE simulator, putting a full scale motorcycle simulator inside the CAVE[50]. For the immersive CAVE, a CAVE-clone display system named K-CAVE, constructed at the Keio University[58] was used for this dissertation. This K-CAVE has four screens, in the front, left, right, and the bottom capable of covering the FOV for the user inside the K-CAVE. The screen size for the front is 2.63 meters in width and 2.1 meters in height, the left and right screen is 2.1 meters in both width and height, and the bottom is 2.63 meters in width and 2.1 meters in height. Each screen is projected using two projectors (NEC, NP 2150J), each projected through a circular polarizing filter, one left-circularly polarized and the other right-circularly polarized, providing stereoscopic viewing using 3D glasses which has the circular polarized fil44
Circular polarization filter Mirror
Magnetic sensor (transmitter)
Projectors 3D glasses with magnetic sensor Screen Simulation Workstation PC
Gigabit Ethernet PC
PC
PC
PC
Graphics Workstation
Figure 3-1: Structure of K-CAVE Immersive CAVE. ters. For projecting images, the calculation was done by four computers, with one computer to control rendering information. Each computer is responsible for rendering one screen, installed with two video cards (NVIDIA, Quadro FX3700) where each video card connected per projector. To sense the head movement, an electromagnetic sensor (Ascension Technology, Flock of Birds) was utilized capable to sense the position and direction. Figure 3-1 shows the overview of the utilized K-CAVE. Summarized details about the components used to construct K-CAVE are listed in Table A.1. In the old days when Personal Computer (PC) were not so fast in computing and rendering, supercomputers were used to compute and render. Recent technology development has realized fast and cheap Central Processing Unit (CPU)s and Graphics Processing Unit (GPU)s, fast and cheap enough for using PCs for graphical rendering. Also the network devices has become fast and cheap enough for clustering many PCs. These factors made systems like CAVE to cluster and use several PCs instead of installing one or few expensive supercomputers. For systems like CAVE, constructing a large display system using multiple screens has challenges in handling to render each screen synchronized. Nowadays, various solutions have been proposed and available 45
Gigabit Ethernet (LAN) images
User
3D image
3D glasses
Sensor information Electromagnetic sensor
Image rendering PC Image rendering PC Image rendering PC
Projector Projector Projector
Input Devices
Master PC for CAVE system Sync information
Image rendering PC
Projector
Position of eye, Direction of eye Figure 3-2: Block diagram of physical architecture of K-CAVE using Ethernet for PC communication. depending on the physical architecture and the system size[59]. Normally, the basic architecture uses fairly cheap and fast Ethernet like Gigabit-Ethernet, communicating through a closed simple Local Area Network (LAN) to ensure the speed. It is also to be noted that the speed of technology evolution and cost down has even realised an enormous system using 72 LCDs and 36 PC[60]. K-CAVE also clusters several PCs for the system. For PC’s communication, the open library named OpenCABIN[61] was used for this dissertation. OpenCABIN is an library developed based on the CAVE system which was constructed at Tokyo University named CABIN[62]. Figure 3-2 shows the block diagram of K-CAVE’s physical architecture. Using the Ethernet LAN, it has a controller PC as a master PC, and image rendering PC as slave PCs. Various applications like data visualization[63, 64] to educational usage[65] have been successfully developed using this library. KCAVE with OpenCABIN also has capabilities in showing real world images as treating them as texture objects in OpenGL[66, 67]. The integration of real world images can be applicable in doing simulation which is based or emulates the real world, without trying to do all the hard modeling for every little objects by using some pictures from the real world for detailed texture rendering. This approach has been done for a driving simulator, using a real world scale driving cockpit installed inside the K-CAVE[68, 69]. This immersive CAVE car simulator 46
has been used as a safe environment to study about safety driving[70], regarding that simulators have high benefits of conducting experimental research safely. That is, that even if the driver crash into a wall in the virtual world, the driver will never get physically hurt. Since immersive CAVE car simulator can be utilized efficiently, there shall be possibilities in adapting the motorcycle inside the immersive CAVE. Therefore, in theory, replacing the car hardware to motorcycle hardware, and modification with the vehicle model used for the car, shall realize the motorcycle simulator inside the immersive CAVE.
3.1.2
Development for Immersive CAVE Motorcycle Simulator
Based on previous researches of immersive CAVE car simulator, the motorcycle version, the immersive CAVE motorcycle simulator was constructed for this dissertation. In order to integrate the motorcycle simulator inside the K-CAVE, the K-CAVE’s bottom screen was cut into half and placed the motorcycle simulator on the floor to prevent any damage to the bottom screen. Figure 3-3 shows the actual picture of the motorcycle simulator placed inside the K-CAVE, and Figure 3-4 shows the overall structure. The motorcycle is made so the rider can actually maneuver the simulator. In the
Motorcycle Simulator
Half of the Bottom Screen
Figure 3-3: Picture of the motorcycle simulator placed inside the K-CAVE. 47
Circular polarization filter
Mirror
Magnetic sensor (transmitter)
Projectors
3D glasses with magnetic sensor Screen
Simulation Workstation Motorcycle
PC
DSP
Gigabit Ethernet PC
PC
PC
PC
Graphics Workstation
Figure 3-4: Structure of the immersive CAVE motorcycle simulator. real world, motorcycles are unstable and can easily turnover if the vehicle is running too slow, or if there is no stay while it is on a stop or halt. For experimental research safeness, any potential harm to the rider shall not be excluded, thus, movements of roll, pitch, and yaw to the motorcycle body was not added to the simulator. So the interaction interface between the simulator and the rider has been limited to avoid potential harm, leaving only the following basic maneuvers. • Handle operation • Throttle operation (Accelerator operation) • Brake operation (Front and back breaking) Although the simulator has been constructed capable of the rider sitting as a standard street motorcycle also known as naked bikes or roadsters, or sport bike, from the limitations of the maneuvers, the riding position was more intended to be similar to riding a cruiser type or scooter type motorcycles. Hence, the basic maneuvers where done only by the rider’s hands and arms (Figure 3-5). Also since the research focuses based on the rider’s viewpoint movement, excluding the roll, pitch and yaw 48
Handlebar Throttle grip
Rear break Front break
Figure 3-5: Picture of the motorcycle simulator with indications of the operational interfaces. movement of the motorcycle, and the rider’s rather straight riding position can lead to better expectation of accurate rider’s viewpoint movement. Figure 3-6, describes the data flow of the immersive CAVE motorcycle simulator in block diagrams. The simulation is designed including the motorcycle rider inside the simulation loop, considering the operation that the rider performs. As described in Section 2.1.2, this kind of simulation study is called the Human-in-the-Loop Simulation, including the human inside the model, especially but not limited to models or systems that requires human interaction for analysis[71]. For sensing the rider’s maneuver, potentiometers was used for each operational maneuver. The specifications of the potentiometers are in Table A.2. The measured data are sent to the Digital Signal Processor (DSP) (dSPACE, DS1006), and the analog signals are converted to digital data. In Figure 3-6, θh , ua , ubf , ubr stands for 49
Motorcycle Simulator Steering handle Accelerator lever Front brake lever Rear brake lever
θh
Rider
3D image
3D glasses
Sensor information Electromagnetic sensor
1/N
DSP
ua ubf ubr
Calculation of vehicle speed
Vehicle model
V
X
Rider’s maneuver images
δf
CAVE system Image rendering PC Image rendering PC Image rendering PC
Projector Projector Projector
Y
φ
Ethernet
Master PC for CAVE system Image information
Image rendering PC
Projector
Position of eye(xh,yh,zh), Direction of eye(φh, ϑh, ψh ) Figure 3-6: Block diagram of the simulation model for immersive CAVE motorcycle simulator. the amount of voltage measured by the potentiometer. Inside the DSP, the received data are calculated in a Segel’s front-rear two wheel single track model[72], whereas the model was originally constructed for the immersive CAVE car simulator[69, 73]. Though the motorcycle dynamics and car dynamics does differ, in this simulator, the vehicle’s turnover is not what is expected. Considering the rider will stop or halt while driving, the Segel’s front-rear two wheel single track model is more likely to have stable riding performance than implementing a true motorcycle dynamics model which will be better for to observe rider’s viewpoint movements. The model inside the DSP is first made by Matlab/Simulink, which is converted to C code and compiled on the platform of DSP. Some variables are dynamically configurable through the application distributed by dSPACE named ControlDesk1 . The 1
https://www.dspace.com/en/inc/home/products/sw/experimentandvisualization/ controldesk.cfm
50
configurable variables are used to configure the initial starting values to 0 for steering, throttle, front break and rear break potentiometers. Since in Human-in-the-Loop Simulation, the hardware and sensors that human interacts returns slightly different initial voltages depending on the temperature and humidity of the experimental room, dynamic configuration before each experiments is necessary. The Matlab/Simulink software and the ControlDesk were run on a standard desktop PC. For specifications for the PC running the Matlab/Simulink, see Table A.3. It is to be notified that the hardware and the software of the PC has been upgraded during this research, though there was no measurable difference in simulation performance. For the model inside the DSP, first, the angle of front wheel δf is calculated based on the steering wheel gear ratio N , where in motorcycle case can be described as 1 regarding the amount of operated handlebar angle equals to the steering angle. From the measured voltage of throttle ua , front break ubf , and rear break ubr calculates the Vehicle speed V . Using the δf and V as inputs for the vehicle model,the vehicle trajectory X, Y and φ are calculated. The calculated results are send through the Ethernet board (dSPACE, DS4504) installed in the DSP. Instead of Transmission Control Protocol (TCP), User Datagram Protocol (UDP) was used to send through the Internet Protocol (IP) network to the immersive CAVE’s master PC for insure the speed of calculation to render simulation images in real time. When the immersive CAVE’s master PC receives data through UDP, the master PC calculates the rendering information for the rider based on the vehicle’s data and the rider’s position of eye (xh , yh , zh ) and direction of eye (φh , ϑh , ψh ) based on electromagnetic sensor data. For the riding environment, a virtual riding course was constructed based on a real town in Japan. The model of the course was built using a modeling software (Autodesk, 3ds Max) shown in Figure 3-7.The full model size was made 320 m lateral and 205 m longitudinal, and a part of the model was used mainly for the conducted experiments throughout this dissertation. Comparing the real town and virtual town, and example view of the same intersection is shown in Figure 3-8. Figure 3-9 shows a scenery of a rider actually riding the simulator. For more information about the modeled virtual town, information and figures 51
Figure 3-7: Virtual town modeling for the immersive CAVE simulator.
Real World
Virtual World
Figure 3-8: Comparison of the real world picture and the constructed virtual world. Rider wearing 3D glasses with magnetic sensor
Rider operating the motorcycle simulator
Figure 3-9: Rider riding the motorcycle inside the immersive CAVE simulator.
52
are in the Appendix B. As described in Section 1.1.1, since motorcycle rider’s are known to move their viewpoints on the road, the road width configuration was taken to consideration when constructing the virtual world. Based on real world’s road measurement, the virtual world’s road width was configured to be the same width of 4.6 m. For zoomed-in overview of the course, see Figure B-1. Geographical location information about the location of the real town mainly used within this dissertation is described in Figure B-2. The configuration of road width is illustrated in Figure B-3.
3.1.3
Evaluation of Immersive CAVE Motorcycle Simulator
To evaluate the constructed immersive CAVE motorcycle simulator, comparison of rider’s viewpoint movement was conducted using a wearable cap-type eye-tracking device. This eye-tracking device was used for viewpoint movement measurement with every experiment conducted throughout this dissertation.
3.1.3.1
Eye-tracking device to measure viewpoint movement
The cap-type eye-tracking device(nac, EMR-9) is made from three main components shown in Figure 3-10. The cap-type head unit is the cap that has three sensors to record the viewpoint. Figure 3-11 shows the picture of the sensors, showing one visual camera to record the surroundings, and two pupil detectors each for one eye. The visual camera has the field angle of 92◦ in horizontal, and 69◦ in vertical. From this visual camera, the surroundings are recorded in a movie file in the format summarized in Table 3.1. To use the recorded movie for analysis, the movie file was first converted to an Motion Picture Experts Group Layer 4 (MPEG4) format. Details about the conversion is described with a sample bash script in the appendix Code C.1.
The
software specification used for conversion is in appendix Code C.2. The viewpoint movement analysis can be done going through each frame of the movie, or can be done through looking into the Comma-Separated Values (CSV) files which can be exportable by operating the eye-tracking device’s controller. Since the CSV file contains data in 59.94 data per second, it has twice the amount of data 53
3.5’’ LCD View Finder
Cap-type head unit
Controller Figure 3-10: The eye-tracking device. The eye-tracking device (nac, EMR-9)
Visual camera
Pupil detector
Figure 3-11: The sensors on the cap-type head unit. 54
Viewpoints
EMR-9 timeline
Figure 3-12: Sample frame from the eye-tracking device’s recorded movie. compared to the movie file which can be find useful. Table3.2 shows the basic format of the CSV file. Figure 3-12 shows a sample frame from the recorded movie file. The movie contains two important information which are the viewpoint plot and the timeline. The left eye are plotted as a +, right eye as a □ and the parallax corrected viewpoint as a ⃝. The timeline in Figure 3-12 refers to the FrameCounter in the CSV file shown in Table 3.2. Although the viewpoint movement analysis can be done by looking frame by frame through the movie, in many occasions, it can be observed that the recorded movie has some of the frames dropped to be recorded.
Going
through the CSV file may be required if the frame to analyze has been dropped from the movie file. To analyze the actual viewpoint movement, it is necessary to consider the rider’s head movement. In the immersive CAVE, since the rider’s eye position and eye direc-
Table 3.1: Movie file format of the eye-tracking device. Container MP4 Codec MPEG-4 Part 2 Core Profile frames per second (fps) 29.97 Size 640 * 480 55
Table 3.2: The eye-tracking device’s CSV file column explanations. Column name meaning unit No. Sequence number Time Time FrameCounter Frame count LX Width Coordinate for left eye LY Height Coordinate for left eye LP Size of pupil for left eye RX Width Coordinate for right eye RY Height Coordinate for right eye RP Size of pupil for right eye CX Width Coordinate after parallax correction CY Height Coordinate after parallax correction D Viewpoint distance D-Sts Data status M-Sts Measurement status E-Sts Event status
s [HH:MM:SS:FFF] movie pixel movie pixel mm movie pixel movie pixel mm movie pixel movie pixel m -
Magnetic sensor transmitter
Magnetic sensor receiver Figure 3-13: Immersive CAVE’s electromagnetic sensor.
tion is used for simulation, it is possible to calculate the amount of head movement from the electromagnetic sensor data values(Figure 3-13. In the immersive CAVE motorcycle simulator, these values were recorded in the sampling rate of 100Hz. Another approach is possible by using physical markers which can be recorded 56
Table 3.3: Environment comparison experiment’s subject attributes. Attribute Subject A Subject B Sex Year of license issued Age Daily riding frequency Last riding date Restrictions for driving license
Male Male 2009 2009 Early 20s Late 20s More than once a week Almost none This week More than one month ago Corrective Lenses None
through the visual camera of the eye-tracking device. This approach is typically used to observe viewpoint movements recorded in real world environments.In this dissertation, the same approach was used to compare the viewpoint movements between the environments. Comparison was done between with the real world environment, the non-immersive environment, and the immersive CAVE environment. Since rider’s driving habit vary from person to person, the comparison experiment was conducted by the same two subjects. Both subjects obtained the Japanese motorcycle license2 at 2009, and both are male in the 20s. Notable subject attributes are summarized in Table 3.3. 3.1.3.2
Real World Environment for Comparison
While it has been discussed in Section 2.1.1 about rider’s safety, conducting experiments in middle of the real town’s public roads is very difficult to ensure safety. Since the modeled location in the immersive CAVE motorcycle simulator has simultaneous traffic and pedestrians, conducting experiments in the same place was aborted due to safety concerns. For the real world motorcycle viewpoint measurement experiment, it was conducted inside the private property of a driving school (Hiyoshi Driving School). The experiment was conducted when the driving school was at a non-work day, meaning there are no traffic and no pedestrians for the driving condition, similar to the traffic conditions of the virtual environments utilized for this dissertation. Since the motorcycle simulator’s chassis were only intended to use in a Human2
Ordinary motorcycle license in Japan
57
in-the-Loop Simulation study, the simulator’s body or chassis is not possible to ride through the real world. So for the real world experiment, the most standard motorcycle in Japan (Honda, CBR400SFRevo) was chosen for use. This CBR400SFRevo motorcycle is the model of motorcycle used at driving schools widely in Japan, so no matter which model the subject is currently riding, it is slightly expected that the subject shall be familiar with the motorcycle. Although the experiment was conducted in a driving school using a CBR400SFRevo, the motorcycle used for the experiment is not the one the driving school uses or owns. The motorcycle was rent from a close rental shop. Figure 3-14 show the subject riding the motorcycle, preparing for the experiment. To measure the viewpoint movements, the subject wore the cap-type eye-tracking device’s head unit under the helmet. Rider’s head movements were considered by installing a soft bar stretched from the handle bar to show the red markers using a standard handle bar mount kit (Figure 3-15). The marker was placed at intervals of 10 cm up to 70 cm on the bar, making 8 markers on each bar. The eye-tracking device’s controller were put into a standard backpack which the subject carried while riding the motorcycle.
3.1.3.3
Non-Immersive Environment for Comparison
Utilizing the same motorcycle simulator used in cave, a non-immersive environment was constructed using 3-LCD monitors attached in front of the simulator (Figure 316). Two 24 inch display (LG, LG-E2442V-BN) were used for the sides shown as Display type α, and one 22 inch display (Dell, G2210T) was used for the center shown as Display type β. While the display size in inches differs, the two models has the same height of the display area. This non-immersive environment runs a different simulation software (TASS, Prescan v6.3.0) with configured driving models for this motorcycle simulator[74]. The simulation software runs its software on the Matlab/Simulink (Mathworks, Matlab R2012) platform, capable of displaying all three monitors with one PC. Though since rendering the virtual world is heavy task, three graphic cards were installed with 58
Figure 3-14: The subject riding the motorcycle prepared to start the experiment. each graphic card rendering one screen (See Table A.4 for detailed specifications of the PC). Figure 3-17 shows a scenery of the conducted experiment. Same to the immersive CAVE motorcycle simulator, in the non-immersive simulator the subject can maneuver the simulator by handle operation (steer), throttle operation (accelerate), and brake operation (front and back). For the experiment, a virtual driving course was constructed using road data based on the real town, same place with the immersive CAVE motorcycle simulator (geological location information in Figure B-2). The road map data was imported using the Prescan import function from OpenStreetMap[75]3 . Based on the imported map, slight modifications to the map was made in the area outside of the test course so the rider can rider back to the start location. The environment parameters (e.g. road width) was configured close as possible to the original 3
Map data copyrighted OpenStreetMap contributors. Available from http://www.openstreetmap.org/
59
Markers
Marker bar
Markers
Figure 3-15: Recorded scene from the eye-tracking device showing the marker bar and the marker. real town, to be configured same as the immersive CAVE motorcycle simulator’s road width. The configured road model is illustrated in Figure B-4. For the viewpoint analysis, since the non-immersive motorcycle simulator does not have a head tracking system, hence, chose to use the front monitor’s corner as the marker (Figure 3-18).
3.1.3.4
Evaluation Result and Discussion
To compare the measured results, a scenery was chosen where the subject was riding straight. 10 continuous viewpoint data was obtained every 0.15 s for comparison. Since the obtainable viewpoint data from the eye-tracking device is measured as coordinate data in pixel of the recorded movie file, the viewpoint data needs to be converted into a spatial coordinate for comparison. The markers appearing in the 60
recorded movie was then manually obtained their movie files’ coordinate data as (xm , s ym ). From the observable n marker’s coordinates at the stating frame as (xsm , ym ) and f ), each markers coordinates change amount the following frame for analysis as (xfm , ym s s can be obtained as (xsm −xfm , ym −ym ) which makes the mean of the coordinate change
amount as (¯ xm , y¯m ). (¯ xm , y¯m ) =
n (1 ∑
n
(xsm m=1
−
xfm ),
n ) 1∑ s f (x − xm ) n m=1 m
(3.1)
By subtracting the obtained head movement amount Equation 3.1 for each frame from the recorded viewpoint coordinate data (xe , ye ), the head movement amount is excluded from the viewpoint data becomes the viewpoint movement data (xe − x¯m , ye − y¯m ). To plot the data, the vanishing point in the recorded movie is set as the origin of the graph (x0 , y0 ), and the data are converted into angles from pixels by dividing the movie size by FOV of the eye-tracking device’s visual camera. (x, y) =
) ( 92 69 (xe − x¯m + x0 ), (ye − y¯m + y0 ) 640 480
Display type β
Display type α Display type α
Figure 3-16: The overview of the non-immersive motorcycle simulator. 61
(3.2)
Figure 3-17: Non-immersive motorcycle simulator experiment scenery.
Markers
Markers
Figure 3-18: Markers for non-immsersive experiment.
62
Vertical angle [deg]
20
Subject A Immersive Real World Non Immersive
15 10 5 0 -5 -10 -15 -20 -20 -15 -10 -5
0
5
10 15 20
Horizontal angle [deg] Figure 3-19: Comparison between simulation environment (Subject A).
Vertical angle [deg]
20
Subject B Immersive Real World Non Immersive
15 10 5 0 -5 -10 -15 -20 -20 -15 -10 -5
0
5
10 15 20
Horizontal angle [deg] Figure 3-20: Comparison between simulation environment (Subject B). The comparison was done by subjects regarding the fact of individual difference in moving their viewpoints. In figure 3-19 and figure 3-20, the blue data represents the real environment, red data represent the immersive CAVE, and the green data represent the non-immersive environment. Results summarized in Table 3.4 and Table 3.5 shows the minimum and maximum viewpoint angle. 63
64
5.84 6.66 4.59 7.58 2.73 1.58
Immersive Real World Non-Immersive Immersive Real World Non-Immersive
Subject A
Subject B
10.65 15.81 1.06
4.95 14.36 0.79
14.36 8.48 2.95
20.93 19.04 9.82
12.82 38.96 1.61
14.13 37.96 2.78
Table 3.4: Data of viewpoint movement field size and total amount for each environment. Viewpoint angle size Total amount of movement Horizontal [deg] Vertical [deg] Horizontal [deg] Vertical [deg]
Table 3.5: Minimum and maximum viewpoint angle measured. Viewpoint Angle Minimum [deg] Maximum [deg] X Y X Y Subject A
Immersive −3.39 Real World −0.86 Non Immersive −2.96
−12.46 −11.36 −4.43
4.18 1.87 −1.39
−1.81 4.46 −3.37
Subject B
Immersive −1.98 Real World −2.63 Non Immersive −4.83
−8.63 −17.88 −2.79
3.85 4.03 −0.24
−3.68 −3.52 −1.99
Shown in Table 3.4, both subjects vertical angular size for non-immersive environment was the smallest compared to the other two environments. Especially in Subject A, viewpoint moved only in the range of 0.79◦ vertically, and spent most of the movements horizontally. Subject B showed a big difference between the non immersive environment and the other two environments. For the horizontal angle, immersive environment size was 4.85◦ bigger than the real world, but for the vertical angle the real world was 5.16◦ bigger. Amount of viewpoint movement in both subjects moved vertically the most in the real world, immersive as next and the least for non immersive environment. Though for the horizontal angle, the immersive environment moved the most, and real world as next. Though the data does not show similar results, Figures 3-19 and 3-20 visualize the characteristic of viewpoint movement showing the immersive environment to be closer to the real world environment. It is hard to determine how close or is it close enough, so similar studies comparing the real world and simulation world shall be discussed. Focusing on the vertical viewpoint movements in Table 3.4, both angle size and amount of movements for the real world was bigger than the immersive environment. From a car simulator comparison results, Ogawa et al.[76] suggests the possibility that the driving behavior can be affected by the subject feeling the simulation safeness. Yamada et al.[77] also reports possibilities that subjects recognizing that they are riding inside the simulator environment affects the subject’s driving behavior including their viewpoint movements. However, since the purpose of 65
the simulator environment is to conduct experiments while ensuring the safety of the driver, it is difficult to completely prevent the driving behavior change since providing safe environment is one of the purpose of simulation study.
3.2
Prototyping the Motorcycle HUD
In this dissertation, it introduces two motorcycle HUD prototype. The first prototype was intended to investigate the design parameter value of information presentation position. Therefore the prototype HUD has been constructed in a rather big size considering to be equipped on a motorcycle. The second prototype has been refined based on the determined design parameter value of information presentation position, which realized the size to be small enough to be equipped on the handle bar. Since the prototyping is intended to determine the values of information presentation design parameters, the software prototyping was focused on to perform the tests for the determination of design parameters. Though for the design parameter Information Presentation Timing, the timing to present needed to be controlled based on the immersive CAVE motorcycle simulator’s riding environment. Hense, the second prototype was constructed with consideration of software implementation to the prototype of motorcycle HUD. The first prototype was utilized to conduct experiments described in Chapter 4 and Chapter 5. The second prototype was utilized to conduct experiments described in Chapter 6.
3.2.1
Structure of the Motorcycle HUD prototype
As shown in Figure 3-21, the motorcycle HUD prototype was constructed to determine the information presentation design parameter’s values[51]. The prototype uses an acrylic board that has a 92.6% transparency as the combiner. The display device is composed of the MEMS-based laser projector (Microvision, Pico Projector SHOWWX+) which projects to the screen to diffuse the lights.
For the optical
element, a non-spherical lens (Eschenbach, 2636–11) was utilized for adjusting the 66
Combiner
Optical element
Display device Figure 3-21: Picture of the first HUD prototype. focal distance. The specification of utilized components are described in Table A.5 for the MEMS-based laser projector, and Table A.6 for the non-spherical lens. As discussed in Section 2.2, there are many design parameters for the HUD itself[46, 47], though the focus in this dissertation is about the design parameters for the presented information. Although, there are parameters to consider some parameters for the prototype to function as a HUD. One important parameter is the focal distance of the virtual image, since while the rider moves their viewpoint, they continuously change the focal distance to the distance of the road surface. Hence, if the focal distance is not configured properly, issue arise that the rider will have a hard time obtaining the presented information. The focal length can be easily calculated using the lens formula (Equation 3.3). 1 1 1 + = A B F
(3.3)
Since the utilized non-spherical lens has the focal distance F as 90.9 mm (Lens specifications in Table A.6), adjustment for the virtual image’s focal distance by adjusting the distance between the screen and the lens. According from the real world viewpoint movement measurement in Table 3.5, the 67
vertical viewpoint moved angle can be observed between from −20◦ to 5◦ . Illustrated as Figure 3-23 both subject had the eye height of 1.55 m, meaning in case when the viewpoint is at the angle of −20◦ , the rider’s focal distance is 4.53 m and the lateral distance to the road surface is 4.26 m. Since human visual perception is not made to adjust the focal distance further than the object they are looking at (e.g. in this case, further than the road surface), the focal distance needs to be adjusted in a distance shorter than the object. Hence, the virtual image’s focal distance was adjusted to 4.00 m. Therefore, from calculating by the Equation 3.3, the distance from lens to screen A can be determined approximately 93 mm. Figure 3-23 shows the configuration of the display device and optical element based on the calculation results. The second prototype uses the same design for the display device, but with rather smaller combiner. Summarized in Chapter 4, the value of information presentation position’s design parameter has been determined to two positions, therefore, the two small combiner are only used. The combiner size is horizontally 140 mm and vertically 85.91 mm. Though for the combiner to be used conveniently, the combiner itself is rotated 45◦ so the physical size when utilized differs from the vertical height. Figure 324 shows the overall design of the HUD, equipped to the handle bar[78]. For the second prototype, the display device’s projector has been upgraded to a successor model of Microvision’s Pico Projector, the MEMS-based laser projector by
+5° -20°
Planar where virtual information are presented
Eye position 1.55 m
road
4.26 m 4.00 m (Focal Distance)
Figure 3-22: Virtual image focal distance configuration.
68
Half mirror
Lens
Screen
Projector
Figure 3-23: The display device, lens, and the combiner configuration for the first prototype. Celluon, called PicoPro was utilized (for specifications see Table A.7).
3.2.2
Software of the Information Presentation Prototype
As stated in Section 3.2, throughout this dissertation, the developing a software is only for determination of the information presentation design parameters values. Although, some kind of software for the motorcycle HUD’s display device to show visual images. This section briefly describes about the software used or developed for the experiment conducted in Chapters 4 to 6. Detailed configuration or usage within the experiment will be described within the experiment’s chapters. 69
Windshield Half mirror
Lens
Screen
Projector
Projector adjustors
Figure 3-24: The display device, lens, and the combiner configuration for the second prototype. For experiment in Chapter 4, symbols of arrows and exclamation mark were only used for the information presentation. The presentation timing was manually executed, therefore, no special software was developed for the experiment. Figure 3-25 shows a sample of symbol used to informing the rider to turn left at the intersection.
The arrows and the exclamation mark were designed referring to the standard ISO 6727:2012[79]. Rather than automating the timing to show, it was showed by manual operation to prevent the subject to predict the timing of when the information will be presented. The image files were made and shown by a standard Notebook type computer (See Table A.8 for specifications) through presentation mode of Microsoft Power Point 2010, to the motorcycle HUD’s display device. Chapter 5 includes two experiment, conducted by two different software. For the first software, it was made using Perl/TK to show virtual image of symbols defined based on ISO/IEC 10646[80], which is also well known to be called as Unicode. Since 70
the standard updates frequently, it shall be follow the new standard when updated. In this dissertation it referred to the version ISO/IEC 10646:2014 which has been the latest standard when the experiment was conducted. Although, the symbols are defined as letters, many computers can not handle most of the new defined symbols by default due to limitations from the pre installed fonts. To solve this issue, additional fonts were installed and used for this research. For the first experiment, Noto Sans Symbols font (Google, Noto Font Family4 ) was installed to show the symbols, and to unify the font, Noto Sans font family was used to show Japanese and English alphabets. Based on symbols defined in the ISO/IEC 10646[80], 18 symbols indicating arrows and exclamation mark were selected, and another 18 symbols from the U+2600–26FF block (Miscellaneous Symbols Block) was selected for use. All 36 symbols that have been used for experiment are listed in the Appendix A.9. For the next experiment conducted in Chapter 5, a program using Perl/TK was developed to show strings in Japanese (Source code in Appendix C.3). The software was build with a slight simpler modification to show only Japanese Hiragana. The file itself is a simple program, first reading a file and parsing each line into an array to prepare for the experiment. When the experiment starts, the operator manually
Figure 3-25: Sample of arrow used for information presentation position experiment.
4
https://www.google.com/get/noto/
71
Figure 3-26: Sample of information presentation used for information presentation quantity experiment. presses the space key to show and hide information. When all the trials are conducted, it has a function to show the string END to indicate the rider and the experiment operator that all trials has been conducted. Figure 3-26 shows a sample information presented on the HUD. For experiment in Chapter 6, as software was developed with Perl/TK to show arrows based on ISO/IEC 10646[80]. For this experiment, since the timing to show is the aspect we want to investigate, a function to communicate with the immersive CAVE simulator has be developed. From this experiment, considering the further aim of the prototype to be equipped on to the motorcycle, the program was developed to work on a miniature PC, a size attachable to a real motorcycle. The miniature PC was configured by using a Intel NUC Kit (Intel, DC3217IYE), which has two ports of HDMI for display output. Other components for the miniature PC is summarized in Table 3.6. The software developed on this miniature PC uses the same platform from the previous softwares, Perl/TK. For this miniature PC, the font Symbola was installed and utilized to handle more symbols defined in ISO/IEC 10646[80]. For
Table 3.6: The miniature PC to run the software for HUD. Component Product Base model CPU Random Access Memory (RAM) SSD Wifi+Bluetooth Operating System (OS) Application
Intel NUC Kit DC3217IYE Intel Core i3–3217U CPU @ 1.80GHz Transcend JM1600KSH–16GL PLEXTOR PX–64M6M Intel Centrino Advance–N 623 Windows 8.1 DSP (64bit) DWIM Perl for Windows 5.14.2.1-v7 (32bit) 72
the information presentation timing experiment, three basic symbols was used. The symbols are U+2B05 for turn left, U+2B06 for go straight, and U+279E for turn right. Figure 3-27 shows the system configuration diagram for the information presentation timing experiment. In Figure 3-27, the Navigation Render Computer indicates the constructed miniature PC. To control the information presentation timing, the software needs to use the motorcycle position data(Xγ , Yγ ) within the immersive CAVE motorcycle simulator. To receive the data from the immersive CAVE’s master PC, UDP/IP was used to for data transfer. Detailed description about designing the parameters will be in Section 6.1.
Motorcycle Simulator
DSP
θh
Steering handle
ua
Accelerator lever
HUD image HUD
V
Vehicle model
X
Rider’s maneuver
Rider
Calculation of vehicle speed
ub
Brake lever
3D image
δf
1/N
CAVE system images
3D glasses
Eye position Electromagnetic sensor
Image rendering PC Image rendering PC Image rendering PC
Projector Projector Projector
Y
φ
Ethernet
Master PC for CAVE system Image information
Image rendering PC
Projector
Position of eye(xh,yh,zh), Direction of eye(φh, ϑh, ψh ) Navigation Render Computer
Motorcycle position (Xγ, Yγ)
Figure 3-27: Updated system configuration diagram to perform experiments for information presentation timing 73
Chapter 4 Information Presentation Position This chapter discuss about the experiment conducted to determine the design parameter value of information presentation position for motorcycle HUD. The experiment was conducted using the immersive CAVE motorcycle simulator with an prototype of motorcycle HUD. Using the eye-tracking device, experiments measuring durations of the viewpoint movements was conducted. From 10 subjects, the lower left or the lower right position within the rider’s FOV is determined to be the design parameter
Figure 4-1: Scenery of the experiment to investigate the information presentation position. 75
value of information presentation position for motorcycle HUD. Part of this chapter’s work can also be found on authors publication[81].
4.1
Information Presentation Position Experiment
Discussed in Section 2.2, considering the information presentation position is important[40, 48]. For motorcycle rider, it is known the rider’s move their viewpoints looking carefully on the road, different to the car driver’s viewpoint movement[3, 4]. Furthermore, it is known that human’s useful FOV changes depending on psychological factors[5]. Hence, in order to determine the design parameter value of information presentation position, study considering the rider’s viewpoint movement is necessary. In this dissertation, to evaluate the design parameter value of information presentation position for the motorcycle HUD, an Human-in-the-Loop Simulation experiment using a immersive VR environment conduction was conducted. For the experiment, navigation information was presented on the prototype HUD to the subjects while riding the immersive CAVE motorcycle simulator. Using the eye-tracking device, the subjects viewpoint movement was measured for evaluation. In this experiment, three durations were measured for analysis. As shown in Figure 4-2, the defined durations are Detection time, Observation time, and Impartation time. The Detection time is the duration from when the information is presented to when the rider’s viewpoint moved on to the presented information. The Observation time is the time from after the rider’s viewpoint moved on to the presented information until the viewpoint removed from the presented inforInformation presentation
Viewpoint on information
Detection time
Viewpoint off information
Timeline
Observation time
Impartation time
Figure 4-2: The defined durations for analysis of the position experiment. 76
mation. The Impartation time is the sum of the Detection time and the Observation time. To measure the durations, the eye-tracking device introduced in Section 3.1.3.1 was used. The recorded movie file was frame forwarded to obtain the moments of Information presentation, Viewpoint on information, and Viewpoint off information. For the information presentation, four types of symbolic picture was used. Figure 3-25 in Page 71 shows the four types of information presented for the experiment. The information indicates to turn left at the target intersection, turn right at the target intersection, go straight at the target intersection, and halt/stop before the intersection. The target intersection is told to the subject at the intersection where the convenient store is. Figure 3-8 in Page 52 shows the real world view and the modeled view of the convenient store. The timing for information presentation to the motorcycle HUD was done manually in a distance about 40 m from the target intersection. It was chosen to manually operate the information presentation timing to prevent the subjects from trying to predict the information presentation timing, though it was roughly controlled around 40 m since information presentation timing has the potential to affect the defined durations in Figure 4-2. Figure 4-3 illustrates the information presentation timing, target intersection, and the directions the rider will rider following the information presented through the motorcycle HUD. To determine the value of information presentation position, the HUD was divided
Right Target intersection 40 m
Straight
Information presentation timing Left Figure 4-3: The test course used for the information presentation position experiment. 77
1
4
7
2
5
8
3
6
9
Figure 4-4: The HUD positions divided into nine positions.
Upper
1
4
7
Middle
2
5
8
Lower
3
6
9
Left
Center
Right
Figure 4-5: Nine positions labeled with names.
into nine positions based on the road’s vanishing point to be the center. The divided positions are illustrated in Figure4-4) as an image from the rider’s view. The divided positions were labeled with names (e.g. 1 for Upper Left, 5 for Middle Center, 9 for Lower Right) as shown in Figure 4-5.
It has been divided in about 5◦ up and
down,and right and left, based on the center position. Although it is to be noted that the road’s vanishing point from the rider’s view is extremely difficult to precisely maintain the relation of position. Since road’s vanishing position is determined only by the relative position relation between rider’s riding posture, which moves while 78
riding, also differs between people’s height or sitting height, and their riding habits. Preliminary design can be done by regarding to standardized sitting positions[82, 83], though it shall be considered to have functionality of configuration for each rider’s physical descriptions and riding posture, considering to be designed human-centered. Within the conducted experiment, the basic configuration was done by referring to the standards[82, 83], though it required configuration for subject to subject, asking to the subject before each experiment starts per information presentation position. For each information presentation position, four types of information indicating directions to head or to halt/stop were presented. Figure 4-6 shows the four symbols indicating to the rider to turn left, turn right, go straight at the target intersection, or to halt/stop before the target intersection. The information presentation was done in a random order of the four types, and the number of times presented vary from three to four times. Order randomization was done by using a simple script of Perl using the rand function. The number of times information presentation was done per type is not fixed to prevent the rider from predicting how many trials are left or what information type will come next. Although, “Turn right” was always used for the last trial, to let the subject ride in a longer distance within the modeled course for relaxation.
(a) Turn left
(b) Turn right
! !
(c) Go straight
(d) Stop/Halt
Figure 4-6: The four types of information presented for information presentation position experiment. 79
Experiment subjects were informed the following information before the experiment started. • Ride the motorcycle simulator as if you are riding a motorcycle in the real world • There will be no traffic danger but try not to crash or cause accidents • Navigation information will be presented on the HUD while approaching the intersection • Understand the navigation information and follow the instructed navigation information • Four types of information will be used for instructions • The simulation will be done more than 10 times per position The experiment was conducted to 10 subjects who has motorcycle driving license in Japan. The subjects are all Male with the age from 20’s to the 50’s.
4.2
Experimental Results of Information Presentation Position
Total of 1177 trials were conducted, though 10 trials were unable to obtained data for analysis due to the movie file dropping the frames to analyze. For the explanation about the eye-tracking devices movie file, see Page 53 in Section 3.1.3.1. From the experimental results, total of 1167 data were obtained from 10 subjects. The subject understood the presented information correctly for all the trials which has been confirmed through subject’s motorcycle operation and the instructed navigation information. Table A.10 in the appendix shows the number, means and standard deviations of the obtained data.
First, two-way Analysis of variance (ANOVA)
was conducted on the nine information presentation “Position” and the information “Type” as independent variables, on each defined durations (Detection time, Observation time, and Impartation time).
Factor “Position” were statistically significant 80
at the .01 significance level on all three defined durations. The results of Detection time shown in Table 4.1, the effect of “Position” yielded an F ratio of F (8, 1131) = 10.33, p.05, indicating that the effect of “Type” was not statistically significant. Since there was no interaction, post hoc comparisons using the Tukey HSD test was conducted, which indicated significant differences between several condition. Figure 4-7 shows the significant differences ( *
Table 4.1: Two-way ANOVA of Detection Time by Position and Type. Source SS DF MS F P Position Type Position * Type Error Total Corrected Total
3.399 8 0.224 3 1.025 24 46.494 1131 267.502 1167 51.268 1166
0.425 0.075 0.043 0.041
10.334 1.82 1.039
0.000 0.142 0.411
Table 4.2: Two-way ANOVA of Observation time by Position and Type. Source SS DF MS F P Position Type Position * Type Error Total Corrected Total
4.165 8 0.134 3 2.214 24 107.699 1131 431.106 1167 114.284 1166
0.521 0.045 0.092 0.095
5.467 0.47 0.969
0.000 0.704 0.506
Table 4.3: Two-way ANOVA of Impartation time by Position and Type. Source SS DF MS F P Position Type Position * Type Error Total Corrected Total
12.923 0.641 3.462 156.137 1230.06 173.523
8 3 24 1131 1167 1166
81
1.615 0.214 0.144 0.138
11.701 0.000 1.549 0.2 1.045 0.404
& [ページ タイトル]
(s)
*
4.00 *
*
*
*
*
*
3.00
Duration
* *
*
* *
*
*
2.00
1.00
.00
1
2
3
4
5
6
7
Position
8
9 n=1167
Error Bar: +/- 2 SD
Figure 4-7: Detection time means and statistical differences from Tukey HSD test on nine positions.
Detection time [s]
1.2 1.0 0.8 0.6 0.4 0.2 0.0
0.51 0.49
0.42 0.49
0.43
Upper Middle Lower
0.39 0.44
0.35
ページ 1
0.35
Left
Right Center
Figure 4-8: 3D graph plot of means Detection time for nine positions.
82
pButton( −text => "open-window", −command => \&onButton2 ); $button2−>pack();
42 43 44 45 46 47 48
# Make button to open console $button3 = $top−>Button( −text => "console-window", −command => \&onButton3 ); $button3−>pack();
49 50 51
# start loop MainLoop();
52 53 54 55 56 57 58 59 60 61 62 63 64 65 66 67 68 69 70 71 72 73 74 75 76 77 78 79 80
sub onButton { my $filename = $ARGV[0]; my ($key,$value); open(IN, $filename); while(){ chomp($_); my $pushstr = Encode::decode(’utf8’, $_); $pushstr =~ s/(.+?)\//$1/; # Store strings to array push(@str_arr, $pushstr); } close(IN); # Randomize the order to show @str_arr = List::Util::shuffle @str_arr; unshift(@str_arr, "␣"); push(@str_arr, "EOF"); # Save shuffled array open(OUT, ’>’.$filename.’-used.csv’); while (($key,$value) = each(@str_arr)) { print OUT Encode::encode(’utf8’, $value), "\n"; } close(OUT); # Message the operator it’s ok $top−>messageBox( −type => "ok", −icon => "info", −title => "OK", −message => "$ARGV[0]␣Has␣loaded!" ); }
81 82 83 84 85 86
sub onButton2 { my ($header_text,$show_header); # Show message $top2 = $top−>Toplevel(−background=>’black’,); my $w = $top2−>screenwidth;
151
my $h = $top2−>screenheight; $top2−>overrideredirect (1); $top2−>MoveToplevelWindow (1280,0); $top2−>geometry (join(’x’,$screen_w,$screen_h));
87 88 89 90 91
my my my my my
92 93 94 95 96
$i=0; $k=0; #$i+1; $j=0; $end_flag=0; $haikei_color;
97
$haikei_color = ’black’; $times_text=1; $show_text = $str_arr[$i]; my $showing = $top2−>Label( −background=>$haikei_color, −font => [$fontname, $fontsize], −foreground=>$fontcolor, −justify=>’center’, −height =>$hiragana_height, −width =>$hiragana_width, −anchor=>’center’, −textvariable => \$show_text); $showing−>pack();
98 99 100 101 102 103 104 105 106 107 108 109 110 111
#do not start until space is pressed. $top2−>bind(’all’ => ’’ => sub { $j++; if($j % 2 == 1) { $i++; $k=$i+1; if($str_arr[$k] eq "EOF") { $end_flag=1; } my $parseshow = $str_arr[$i]; $parseshow =~ s/\d,(.+?)/$1/; $show_text=$parseshow; } else { if ($end_flag==1) { $top2−>destroy; $show_text="END"; } else { $times_text=$k; $show_text="␣"; } } }); $top2−>bind(’all’ => ’’ => sub {$top2−>destroy;});
112 113 114 115 116 117 118 119 120 121 122 123 124 125 126 127 128 129 130
}
131 132 133 134 135 136 137 138
sub onButton3 { my ($show_console_text,$show_times_text); unless (Exists($top3)) { $top3 = $top−>Toplevel(−title=>’showing’,); $show_times_text = $top3−>Label(−background=>’black’, −font => [ $fontname, 16], −foreground=>’white’, −textvariable => \$times_text); $show_times_text−>pack(); $show_console_text = $top3−>Label(−background=>’black’, −font => [ $fontname, 16], −foreground=>’white’, −textvariable => \$show_text);
152
$show_console_text−>pack();
139
}
140 141
}
The software program is written in Perl. Usage of this software is described in main text page 69.
153
Glossary Architecture Not used as a general term referring to profession of designing buildings or process of construction, it is used in term as a fundamental underlying design and evolutions. For the international standard definition, see ISO:15288:2015 4.1.5 architecture[34] and ISO:42010:2011 [105]. Design As a verb, design is a process to define the architecture, components, interfaces, system elements, and or but not limited to other characteristics of a system, components, or system elements[34, 106]. This output is also called “design” as a noun, which sufficiently describe definitions for the architecture. HSI Human Systems Integration (HSI), is an integration of human consideration in the process of systems engineering. As a lot of systems include the humans as an element of a system or an operator of the system, it is important to integrate the “human consideration” in some human-centered domains. For further definitions, see the Systems Engineering Handbook [35, Section 10.13, p. 237–241]. For fundamental literature of HSI, see the Handbook of Human Systems Integration[38]. Human-in-the-Loop Simulation Human-in-the-Loop Simulation (sometimes called HILS or HITL/HuIL for Humanin-the-Loop), but the acronym of HILS is also known as an acronym for Hardware155
in-the-Loop Simulation meaning to include actual hardware simulators for simulation study. According to the Systems Engineering Handbook [35, Section 9.1.4.2, p. 185], it is described in the following term. Hardware and/or human-in-the-loop simulations execute in real time and use computer-based models to close the loop on inputs and outputs with a hardware and or human element of the system. Since the acronym can be confused with Hardware-in-the-Loop Simulation, this dissertation has typeed out “Human-in-the-Loop Simulation” instead of using an acronym. Immersiveness Immersive + -ness The degree described in the scale of immersive. Objective measurement of immersiveness is difficult, and while currently it is popular to measure subjectively through questionnaire. Objective measurement, or more concreate subjective measurment of “immersiveness” is still under research[107, 108]. OpenCABIN An opensource software formally developed after CABIN library development at Tokyo University. Source code of the library are avaliable in the following github. https://github.com/tateyama/OpenCABIN-library SE Systems Engineering (SE), is a perspective, a process, and a profession[35, Section 2.6, p. 11]. The purpose focuses to satisfy requirments of not only the defined customers but with required functionality in a near optimal manner, integrated by all the disciplines and specialty groups to form a structred development process proceeding from concept to production to operation.
156
Acronyms AIP
Autonomy, Interaction, Presence
ANOVA Analysis of variance AR
Augmented Reality
CAVE
Cave automatic virtual environment
CPU
Central Processing Unit
CSV
Comma-Separated Values
DSP
Digital Signal Processor
FOV
Field of View
fps
frames per second
GPU
Graphics Processing Unit
HMD
Head-Mount Display
HSI
Human Systems Integration
HUD
Head-Up Display
IP
Internet Protocol
LAN
Local Area Network
157
LCD
Liquid Crystal-Display
MEMS
Micro Electro Mechanical Systems
MPEG4
Motion Picture Experts Group Layer 4
OS
Operating System
PC
Personal Computer
RAM
Random Access Memory
SE
Systems Engineering
SOI
System-of-Interest
SysML
Systems Modeling Language
TCP
Transmission Control Protocol
UDP
User Datagram Protocol
UML
Unified Modeling Language
VR
Virtual Reality
158
List of symbols θh
Voltage measured by the potentiometer for handle
[V]
ua
Voltage measured by the potentiometer for throttle (accel)
[V]
ubf
Voltage measured by the potentiometer for front break
[V]
ubr
Voltage measured by the potentiometer for rear break
[V]
V
Vehicle velocity
[m/s]
δf
Steering angle of front wheel
[◦ ]
N
Steer wheel gear ratio
[−]
X
Global coordinate of X axis fixed to the ground
[−]
Y
Global coordinate of Y axis fixed to the ground
[−]
φ
Yaw angle of vehicle
[◦ ]
Xγ
immersive CAVE coordinate of X axis fixed to the ground
[−]
Yγ
immserive CAVE coordinate of Y axis fixed to the ground
[−]
xh
Eye position coordinate of X axis inside the immersive CAVE simulator
yh
Eye position coordinate of Y axis inside the immersive CAVE simulator
zh
Eye position coordinate of Z axis inside the immersive CAVE simulator
φh
Eye direction angle of roll inside the immersive CAVE simulator
ϑh
Eye direction angle of pitch inside the immersive CAVE simulator
ψh
Eye direction angle of yaw inside the immersive CAVE simulator
159
xm
Coordinate data X in pixel of the recorded movie file
[px]
ym
Coordinate data Y in pixel of the recorded movie file
[px]
n
Number of markers in the frame
[-]
xsm
The first frame coordinate data X for analysis
[px]
s ym
The first frame coordinate data Y for analysis
[px]
xfm
Coordinate data X to analyze
[px]
f ym
Coordinate data Y to analyze
[px]
x¯m
The mean of movement amount for Coordinate data X
[px]
y¯m
The mean of movement amount for Coordinate data Y
[px]
xe
Coordinate data X in pixel of the recorded movie file
[px]
ye
Coordinate data Y in pixel of the recorded movie file
[px]
x0
Coordinate data X to analyze
[px]
y0
Coordinate data Y to analyze
[px]
160
List of References [1] Japan Safe Driving Center. Research on ways of providing information to the motorcycle. https://www.jsdc.or.jp/search/pdf/all/h17_2.pdf, March 2006. Last visited at 2016-12-22. Located at https://www.jsdc.or.jp/ library/index.html (in Japanese). [2] Li-Yen Chang. Analysis of effects of manhole covers on motorcycle driver maneuvers: A nonparametric classification tree approach. Traffic Injury Prevention, Vol. 15, No. 2, pp. 206–212, 02 2014. [3] Takanobu Morita. On visual information seeking of motorcyclists. Departmental Bulletin Paper, Vol. 4, pp. 239–265, mar 1978. (in Japanese). [4] Toshiaki Miura. Visual behavior in driving : An eye movement study. Departmental Bulletin Paper, Vol. 5, pp. 253–289, mar 1979. (in Japanese). [5] Toshiaki Miura. Some notes on visual behavior: Problems of gazing duration and functional visual field. Departmental Bulletin Paper, Vol. 8, pp. 171–206, mar 1982. (in Japanese). [6] Masha Maltz and David Shinar. Eye movements of younger and older drivers. Human Factors, Vol. 41, No. 1, pp. 15–25, 1999. PMID: 10354803. [7] William L. Mihal and Gerald V. Barrett. Individual differences in perceptual information processing and their relation to automobile accident involvement. Journal of Applied Psychology, Vol. 61, No. 2, pp. 229 – 233, 1976. [8] G. Wulf, P.A. Hancock, and M. Rahimi. Motorcycle conspicuity: An evaluation and synthesis of influential factors. Journal of Safety Research, Vol. 20, No. 4, pp. 153 – 176, 1989. [9] Sheila G. Klauer, Feng Guo, Bruce G. Simons-Morton, Marie Claude Ouimet, Suzanne E. Lee, and Thomas A. Dingus. Distracted driving and risk of road crashes among novice and experienced drivers. New England Journal of Medicine, Vol. 370, No. 1, pp. 54–59, 2014. [10] Joanne L. Harbluk, Y. Ian Noy, Patricia L. Trbovich, and Moshe Eizenman. An on-road assessment of cognitive distraction: Impacts on drivers’ visual behavior and braking performance. Accident Analysis & Prevention, Vol. 39, No. 2, pp. 372 – 379, 2007. 161
[11] Dick de Waard, Paul Schepers, Wieke Ormel, and Karel Brookhuis. Mobile phone use while cycling: Incidence and effects on behaviour and safety. Ergonomics, Vol. 53, No. 1, pp. 30–42, 2010. [12] Japan Automobile Manufactures Association. Guidelines for in-vehicle display systems - version 3.0. http://www.jama-english.jp/release/release/ 2005/jama_guidelines_v30_en.pdf, August 2004. Last visited at 2016-12-22. Located at http://www.jama-english.jp/publications/environmental. html. [13] Alliance of Automobile Manufactures. Statement of principles, criteria and verification procedures on driver interactions with advanced in-vehicle information and communication systems. http://www.autoalliance.org/ index.cfm?objectid=D6819130-B985-11E1-9E4C000C296BA163, June 2006. Last visited at 2016-12-22. Located at http://www.autoalliance.org/ distracteddriving. [14] Hajime ITO. Integrated development of automotive navigation and route guidance system. Synthesiology English edition, Vol. 4, No. 3, pp. 162–171, 2012. [15] Michael Sivak. The information that drivers use: is it indeed 90% visual? Perception, Vol. 25, No. 9, pp. 1081–1089, 1996. [16] H. Marko. Information theory and cybernetics. IEEE Spectrum, Vol. 4, No. 11, pp. 75–83, Nov 1967. [17] Kenneth W Gish and Loren Staplin. Human factors aspects of using head up displays in automobiles: A review of the literature. Technical Report DOT HS 808 320, United States. National Highway Traffic Safety Administration, August 1995. [18] Paul M. Fitts. Psychological requirements in aviation equipment design. The Journal of aviation medicine, Vol. 17, pp. 270–275, 1946. [19] Charles M. Enderby and Scott T. Wood. Head-up display in automotive/aircraft applications. In SAE Technical Paper. SAE International, 02 1992. [20] M. Weihrauch, G. G. Meloeny, and T. C. Goesch. The first head up display introduced by general motors. In SAE Technical Paper. SAE International, 02 1989. [21] Akimasa Hattori, Kensuke Makita, and Shigeru Okabayashi. Development of hud combiner for automotive windshield application. Vol. 1168, pp. 272–282, 1989. [22] Yasuhiro Inuzuka, Yoshimasa Osumi, and Hiroaki Shinkai. Visibility of head up display (hud) for automobiles. Proceedings of the Human Factors Society Annual Meeting, Vol. 35, No. 20, pp. 1574–1578, 1991. 162
[23] Russell J. Sojourmer and Jonathan F. Antin. The effects of a simulated head-up display speedometer on perceptual task performance. Human Factors, Vol. 32, No. 3, pp. 329–339, October 1990. [24] Osami Utsuboya, Takashi Shimizu, and Atsushi Kurosawa. 40.1: Invited paper: Augmented reality head up display for car navigation system. SID Symposium Digest of Technical Papers, Vol. 44, No. 1, pp. 551–554, 2013. [25] W. O. Davis, R. Sprague, and J. Miller. Mems-based pico projector display. In 2008 IEEE/LEOS International Conference on Optical MEMs and Nanophotonics, pp. 31–32, Aug 2008. [26] F. Chao, S. He, J. Chong, R. Ben Mrad, and L. Feng. Development of a micromirror based laser vector scanning automotive hud. In 2011 IEEE International Conference on Mechatronics and Automation, pp. 75–79, Aug 2011. [27] Jason Tauscher, Wyatt O. Davis, Dean Brown, Matt Ellis, Yunfei Ma, Michael E. Sherwood, David Bowman, Mark P. Helsel, Sung Lee, and John Wyatt Coy. Evolution of mems scanning mirrors for laser projection in compact consumer electronics. Vol. 7594, pp. 75940A–75940A–12, 2010. [28] JASO. JASO Standards(English) T-103-04e Motorcycles - Fairings. The Society of Automotive Engineers of Japan, Inc, 10-2, Goban-cho, Chiyoda-ku,Tokyo 102, Japan, 2004. [29] Elias Kalapanidas, Costas Davarakis, Maria Nani, Thomas Winkler, Todor Ganchev, Otilia Kocsis, Nikos Fakotakis, Adam Handzlik, Grzegorz Swiecanski, Atta Badii, Ali Khan, Richard Adderley, Filippo Cappadona, and Didier Pirez. Moveon: A multimodal information management application for police motorcyclists. In System Demonstrations of the 18th European Conference on Artificial Intelligence. IOS Press, July 2008. [30] Megan Bayly, Michael Regan, and Simon Hosking. Intelligent Transport Systems and Motorcycle Safety. Monash University Accident Research Centre, July 2006. [31] Pradeep Setlur, John Wagner, Darren Dawson, and Lance Powers. A hardwarein-the-loop and virtual reality test environment for steer-by-wire system evaluations. In Proceedings of the 2003 American Control Conference, 2003., Vol. 3, pp. 2584–2589 vol.3, June 2003. [32] Bo-Chiuan Chen and Huei Peng. Differential-braking-based rollover prevention for sport utility vehicles with human-in-the-loop evaluations. Vehicle System Dynamics, Vol. 36, No. 4-5, pp. 359–389, 2001. [33] Roger Fales, Erik Spencer, Kurt Chipperfield, Frank Wagner, and Atul Kelkar. Modeling and control of a wheel loader with a human-in-the-loop assessment using virtual reality. Journal of dynamic systems, measurement, and control, Vol. 127, No. 3, pp. 415–423, 2005. 163
[34] ISO, IEC, and IEEE. Iso/iec/ieee international standard - systems and software engineering – system life cycle processes. ISO/IEC/IEEE 15288 First edition 2015-05-15, pp. 1–118, May 2015. [35] INCOSE, David D. Walden, Garry J. Roedler, Kevin J. Forsberg, R. Douglas Hamelin, and Thomas M. Shortell, editors. Systems engineering handbook : a guide for system life cycle processes and activities. John Wiley & Sons, Inc., Hoboken, New Jersey, 4th edition, 2015. San Diego, CA: International Council on Systems Engineering. [36] Object Management Group (OMG). Documents associated with omg systems modeling language tm (sysml(r)), version 1.4. http://www.omg.org/spec/ SysML/1.4/, September 2015. Last Visited:2017-02-06. Located at http:// www.omg.org/spec/SysML/1.4/. [37] IEEE Computer Society. Ieee guide–adoption of iso/iec tr 24748-1:2010 systems and software engineering–life cycle management–part 1: guide for life cycle management. IEEE Std 24748-1-2011, pp. 1–96, June 2011. [38] Harold R. Booher. Handbook of human systems integration. Wiley-Interscience, Hoboken, N.J, 2003. [39] Thomas A Dingus and Melissa C Hulse. Some human factors design issues and recommendations for automobile navigation information systems. Transportation Research Part C: Emerging Technologies, Vol. 1, No. 2, pp. 119–131, 1993. [40] Harold Lunenfeld. Human factor considerations of motorist navigation and information systems. In Vehicle Navigation and Information Systems Conference, 1989. Conference Record, pp. 35–42, Sept 1989. [41] T. A. Dingus, J. T. Carpenter, F. E. Szczublewski, M. K. Krage, L. G. Means, and R. N. Fleischman. Human factors engineering the travtek driver interface. In Vehicle Navigation and Information Systems Conference, 1991, Vol. 2, pp. 749–755, Oct 1991. [42] Sanford Friedenthal, Alan Moore, and Rick Steiner. A practical guide to SysML: the systems modeling language. Morgan Kaufmann, imprint of Elsevier, 3rd edition, 2014. [43] Object Management Group (OMG). Omg systems modeling language (omg sysml) version 1.4. Direct link to pdf: http://www.omg.org/spec/SysML/1. 4/PDF, June 2015. Last Visited:2017-02-06. Located at http://www.omg.org/ spec/SysML/1.4/. [44] David M. Regan. Human Perception of Objects: Early Visual Processing of Spatial Form Defined by Luminance, Color, Texture, Motion, and Binocular Disparity. Sinauer Associates, Inc., Sunderland, Mass, 2000. 164
[45] E. Bruce Goldstein, editor. Blackwell handbook of sensation and perception. Blackwell Publishing Ltd, Oxford, UK Malden, MA, 2008. [46] J. Alejandro Betancur Ramirez. Design considerations of hud projection systems applied to automobile industry. Vol. 8383, pp. 83830D–83830D–8, 2012. [47] Kazumoto Morita. Features and challenges related to automotive displays (in japanese). IDW/AD’16 tutorial, December 2016. (in Japanese). [48] Gerson J Alexander and Harold Lunenfeld. Driver expectancy in highway design and traffic operations. Technical Report FHWA-TO-86-1, US Department of Transportation, Federal Highway Administration, Office of Traffic Operations, May 1986. [49] Carolina Cruz-Neira, Daniel J. Sandin, Thomas A. DeFanti, Robert V. Kenyon, and John C. Hart. The cave: Audio visual experience automatic virtual environment. Commun. ACM, Vol. 35, No. 6, pp. 64–72, June 1992. [50] Kenichiro Ito, Yoshisuke Tateyama, Hidekazu Nishimura, and Tetsuro Ogi. Development of motorcycle simulator in the immersive projection display. In ASIAGRAPH 2015 Forum in Taiwan Proceedings, Vol. 10, pp. 41–46. ASIAGRAPH, April 2015. [51] Kenichiro Ito, Yoshisuke Tateyama, Hasup Lee, Hidekazu Nishimura, and Tetsuro Ogi. Development of head-up display for motorcycle navigation system. In APCOSEC2013 Proceedings, pp. No. TS-05-2. Asia-Pacific Council on Systems Engineering, September 2013. [52] Grigore C. Burdea and Philippe Coiffet. Virtual Reality Technology. London: Wiley-Interscience, 1994. [53] David Zeltzer. Autonomy, interaction, and presence. Presence: Teleoper. Virtual Environ., Vol. 1, No. 1, pp. 127–132, January 1992. [54] Jaron Lanier. A vintage virtual reality interview. original interview archived by author at:http://www.jaronlanier.com/vrint.html. [55] Steve Aukstakalnis and David Blatner. Silicon Mirage; The Art and Science of Virtual Reality. Peachpit Press, Berkeley, CA, USA, 1992. [56] Stephen R. Ellis. What are virtual environments? IEEE Computer Graphics and Applications, Vol. 14, No. 1, pp. 17–22, Jan 1994. [57] Johnny Hartz Søraker. Virtual entities, environments, worlds and reality: Suggested definitions and taxonomy. In Proceedings of The Philosophy of Computer Games Conference 2009, August 2009. 165
[58] Yoshisuke Tateyama, Satoshi Oonuki, So Sato, and Tetsuro Ogi. K-cave demonstration: Seismic information visualization system using the opencabin library. In 18th International Conference on Artificial Reality and Telexistence 2008, pp. 363–364. Virtual Reality Society of Japan, VRSJ, December 2008. [59] Luciano P Soares, Bruno Raffin, and Joaquim A Jorge. Pc clusters for virtual reality. The International Journal of Virtual Reality, Vol. 7, No. 1, pp. 67–80, 2008. [60] Alessandro Febretti, Arthur Nishimoto, Terrance Thigpen, Jonas Talandis, Lance Long, J. D. Pirtle, Tom Peterka, Alan Verlo, Maxine Brown, Dana Plepys, Dan Sandin, Luc Renambot, Andrew Johnson, and Jason Leigh. Cave2: a hybrid reality environment for immersive simulation and information analysis. In Proceedings of SPIE Volume 8649 The Engineering Reality of Virtual Reality 2013, Vol. 8649, pp. 864903–864903–12. Society of Photo-Optical Instrumentation Engineers, March 2013. [61] Yoshisuke Tateyama and Tetsuro Ogi. Development of applications for multinode immersive display using opencabin library. In ASIAGRAPH 2013 Forum in HAWAi’i, pp. 67–70. ASIAGRAPH, April 2013. [62] Michitaka Hirose, Tetsuro Ogi, Shohei Ishiwata, and Toshio Yamada. Development and evaluation of the cabin immersive multiscreen display. Systems and Computers in Japan, Vol. 30, No. 1, pp. 13–22, 1999. [63] Satoshi Oonuki, Yoshisuke Tateyama, and Tetsuro Ogi. Seismic data visualization in tele-immersion environment. In ASIAGRAPH 2008 in Tokyo, pp. 186–189. ASIAGRAPH, October 2008. [64] Tetsuro Ogi, Hanxiong Chen, Takashi Furumura, Shoji Itoh, Takahiro Katagiri, Atsuyuki Morishima, Kengo Nakajima, and Osamu Tatebe. Vindam: Data visualization and data mining in tele-immersion environment. In 13th SIAM Conference on Parallel Processing for Scientific Computing, p. 80. Society for Industrial and Applied Mathematics, March 2008. [65] Tetsuro Ogi, Yoshisuke Tateyama, and Shinichiro Haruyama. Education on human centered design using virtual environment. In ASME 2010 International Design Engineering Technical Conferences and Computers and Information in Engineering Conference, pp. 667–672. American Society of Mechanical Engineers, ASME, August 2010. [66] Hasup Lee, Yoshisuke Tateyama, and Tetsuro Ogi. Realistic visual environment for immersive projection display system. In 2010 16th International Conference on Virtual Systems and Multimedia, pp. 128–132, Oct 2010. [67] Hasup Lee, Yoshisuke Tateyama, and Tetsuro Ogi. Panoramic stereo representation for immersive projection display system. In Proceedings of the 9th ACM 166
SIGGRAPH Conference on Virtual-Reality Continuum and Its Applications in Industry, VRCAI ’10, pp. 379–382, New York, NY, USA, 2010. ACM. [68] Y. Tateyama, Y. Mori, K. Yamamoto, T. Ogi, H. Nishimura, N. Kitamura, and H. Yashiro. Car driving behaviour observation using an immersive car driving simulator. In 2010 International Conference on P2P, Parallel, Grid, Cloud and Internet Computing, pp. 411–414, Nov 2010. [69] Yoshisuke Tateyama, Hiroki Yamada, Junpei Noyori, Yukihiro Mori, Keiichi Yamamoto, Tetsuro Ogi, Hidekazu Nishimura, Noriyasu Kitamura, and Harumi Yashiro. Observation of drivers’ behavior at narrow roads using immersive car driving simulator. In Proceedings of the 9th ACM SIGGRAPH Conference on Virtual-Reality Continuum and Its Applications in Industry, VRCAI ’10, pp. 391–396, New York, NY, USA, 2010. ACM. [70] Junji Yamada, Yoshisuke Tateyama, Tetsuro Ogi, Keiichi Yamamoto, Junpei Noyori, Hidekazu Nishimura, Kana Kumeta, and Noriyasu Kitamura. Evaluation as analyze system of driving behavior by comparison between an immersive driving simulator and a real car. In ASIAGRAPH 2011 in Tokyo, pp. 99–100. ASIAGRAPH, October 2013. [71] Wenchao Li, Dorsa Sadigh, S Shankar Sastry, and Sanjit A Seshia. Synthesis for human-in-the-loop control systems. In International Conference on Tools and Algorithms for the Construction and Analysis of Systems, pp. 470–484. Springer, 2014. [72] Leonard Segel. Theoretical prediction and experimental substantiation of the response of the automobile to steering control. Proceedings of the Institution of Mechanical Engineers: Automobile Division, Vol. 10, No. 1, pp. 310–330, 1956. [73] Kei-ichi Yamamoto, Yukihiro Mori, Hidekazu Nishimura, Yoshisuke Tateyama, Tetsuro Ogi, and Noriyasu Kitamura. System development and application of a three-dimensional immersive vehicle simulator (in japanese). The Transportation and Logistics Conference, Vol. 2010, No. 19, pp. 331–334, dec 2010. [74] Shotaro Nagakura. Construction of bike simulator for system design of frontsteering assist control. Master’s thesis, Keio University, Yokohama, Japan, March 2014. (in Japanese). [75] Mordechai (Muki) Haklay and Patrick Weber. Openstreetmap: User-generated street maps. IEEE Pervasive Computing, Vol. 7, No. 4, pp. 12–18, October 2008. [76] Keiichi Ogawa, Kazuhiro Doi, and Naoki Kusaka. Application possibility of the portable driving simulator system for examination of traffic safety countermeasures. Traffic science, Vol. 37, No. 1, pp. 46–54, 2006. (in Japanese). 167
[77] Junji Yamada, Yoshisuke Tateyama, Tetsuro Ogi, Noriyasu Kitamura, Keiichi Yamamoto, Junpei Noyori, and Hidekazu Nishimura. Analysis of the driver’s action using immersive driving simulator. In Human Interface Symposium 2011, pp. 229–234. Human Interface Society, September 2013. (in Japanese). [78] Kenichiro Ito, Hidekazu Nishimura, and Tetsuro Ogi. Head-up display for motorcycle navigation. In SIGGRAPH Asia 2015 Head-Up Displays and Their Applications, SA ’15, pp. 10:1–10:3, New York, NY, USA, 2015. ACM. [79] ISO. ISO 6727:2012(E) Road vehicles — Motorcycle — Symbols for controls, indicators and tell-tales. International Organization for Standardization, Geneva, Switzerland, 2012. [80] ISO. ISO 10646:2014(E) Information technology — Universal Coded Character Set (UCS). International Organization for Standardization, Geneva, Switzerland, 2014. [81] Kenichiro Ito, Yoshisuke Tateyama, Hidekazu Nishimura, and Tetsuro Ogi. Evaluation of the position to present information using the head-up display for motorcycle. The transactions of Human Interface Society, Vol. 18, No. 4, pp. 435–442, November 2016. (in Japanese). [82] JASO. JASO Standards(English) T-003:2009 Motorcycles - Riding position. The Society of Automotive Engineers of Japan, Inc, 10-2, Goban-cho, Chiyodaku,Tokyo 102, Japan, 2009. [83] JASO. JASO Standards(English) T-006:2007 Motorcycles - Procedure for Hpoint determination. The Society of Automotive Engineers of Japan, Inc, 10-2, Goban-cho, Chiyoda-ku,Tokyo 102, Japan, 2007. [84] Yasuhiro SEYA, Tadasu YAGI, and Hidetoshi NAKAYASU. Measurement of effective visual field in driving using a real-time gaze analysis. IEICE technical report. ME and bio cybernetics, Vol. 107, No. 460, pp. 43–46, jan 2008. [85] Trent W Victor, Joanne L Harbluk, and Johan A Engström. Sensitivity of eyemovement measures to in-vehicle task difficulty. Transportation Research Part F: Traffic Psychology and Behaviour, Vol. 8, No. 2, pp. 167–190, 2005. [86] Clifton M Schor, Lori A Lott, David Pope, and Andrew D Graham. Saccades reduce latency and increase velocity of ocular accommodation. Vision Research, Vol. 39, No. 22, pp. 3769–3795, 1999. [87] Taosheng Liu, David J Heeger, and Marisa Carrasco. Neural correlates of the visual vertical meridian asymmetry. Journal of Vision, Vol. 6, No. 11, pp. 12–12, 2006. 168
[88] Yoo Herbert, Tsimhoni Omer, Watanabe Hiroshi, Green Paul, and Shah Raina. Display of hud warnings to drivers: Determining an optimal location. Technical Report UMTRI-99-9, The University of Michigan Transportation Research Institute, April 1999. [89] Kenichiro Ito, Yoshisuke Tateyama, Hidekazu Nishimura, and Tetsuro Ogi. Evaluation of information amount to present for motorcycle head-up display. Transactions of the JSME (in Japanese), Vol. 81, No. 830, pp. 15–00203–15– 00203, 2015. (in Japanese). [90] C. E. Shannon. A mathematical theory of communication. SIGMOBILE Mob. Comput. Commun. Rev., Vol. 5, No. 1, pp. 3–55, January 2001. [91] Seiichi Namba. Study on the amount of information in a still-picture and the display time required. NHK Technical Journal, Vol. 35, No. 1, pp. 22–29, 1983. (in Japanese). [92] Christopher D. Wickens, Justin G. Hollands, Simon Banbury, and Raja Parasuraman. Engineering Psychology & Human Performance. Psychology Press, Boston, 2013. [93] Jeanette Altarriba, Judith F. Kroll, Alexandra Sholl, and Keith Rayner. The influence of lexical and conceptual constraints on reading mixed-language sentences: Evidence from eye fixations and naming times. Memory & Cognition, Vol. 24, No. 4, pp. 477–492, 1996. [94] D Chincotta, J Hyona, and G Underwood. Eye fixations, speech rate and bilingual digit span: numeral reading indexes fluency not word length. Acta psychologica, Vol. 97, No. 3, pp. 253–275, December 1997. [95] Karl H. S. Kim, Norman R. Relkin, Kyoung-Min Lee, and Joy Hirsch. Distinct cortical areas associated with native and second languages. Nature, Vol. 388, No. 6638, pp. 171–174, Jul 1997. [96] Sarah J. White, Masako Hirotani, and Simon P. Liversedge. Eye movement behaviour during reading of japanese sentences: Effects of word length and visual complexity. Reading and Writing, Vol. 25, No. 5, pp. 981–1006, 2012. [97] Shinya Saida. The role of periperal vision in reading. The Japanese journal of ergonomics, Vol. 26, No. Supplement, pp. 238–239, 1990. [98] Ryoko Fukuda and Tadahiko Fukuda. Visual information capacity for musical tones. The Japanese journal of ergonomics, Vol. 30, No. Supplement, pp. 366– 367, 1994. [99] Ken Sagawa and Keishiro Takeichi. Spectral luminous efficiency functions in the mesopic range. J. Opt. Soc. Am. A, Vol. 3, No. 1, pp. 71–75, Jan 1986. 169
[100] Kenichiro Ito, Hidekazu Nishimura, and Tetsuro Ogi. Design of presenting route information for motorcycle head-up display. In Design & Systems Conference ’16, pp. 2508-1–2508-8. JSME, October 2016. (in Japanese). [101] Keisuke MORISHIMA, Atsushi MINOCHI, Koichirou ABE, Sho FURUKI, Kimihiro YAMANAKA, and Hiroshi DAIMOTO. Measurement of useful field of view in eye and head-free condition while driving. TRANSACTIONS OF THE JAPAN SOCIETY OF MECHANICAL ENGINEERS Series C, Vol. 79, No. 806, pp. 3561–3573, 2013. (in Japanese). [102] Japan Safe Driving Center. Research on influence of safety support information provision to driving behaviors, March 2009. Last visited at 2017-01-22. Located at https://www.jsdc.or.jp/library/index.html (in Japanese). [103] TRACY ROSS and GARY BURNETT. Evaluating the human-machine interface to vehicle navigation systems as an example of ubiquitous computing. Int. J. Hum.-Comput. Stud., Vol. 55, No. 4, pp. 661–674, October 2001. [104] Geospatial Information Authority of Japan. Gsi maps. http://maps.gsi. go.jp/. (Contents used to indicate geological information on academic paper, source citation use under the Geospatial Information Authority of Japan Website Terms of Use (Version 2.0)). [105] ISO, IEC, and IEEE. Iso/iec/ieee systems and software engineering – architecture description. ISO/IEC/IEEE 42010:2011(E) (Revision of ISO/IEC 42010:2007 and IEEE Std 1471-2000), pp. 1–46, Dec 2011. [106] ISO, IEC, and IEEE. Systems and software engineering – vocabulary. ISO/IEC/IEEE 24765:2010(E), pp. 1–418, Dec 2010. [107] Dong P Jang In Y Kim, Sang W Nam, Brenda K Wiederhold, Mark D Wiederhold, and Sun I Kim. An investigation of immersiveness in virtual reality exposure using physiological data. Medicine Meets Virtual Reality 02/10: Digital Upgrades, Applying Moore’s Law to Health, Vol. 85, p. 207, 2002. [108] Lane Phillips, Victoria Interrante, Michael Kaeding, Brian Ries, and Lee Anderson. Correlations between physiological response, gait, personality, and presence in immersive virtual environments. Presence: Teleoperators and Virtual Environments, Vol. 21, No. 2, pp. 119–141, 2012.
170
List of Publications List of related publications. Refereed Journal Publications • Kenichiro Ito, Yoshisuke Tateyama, Hidekazu Nishimura, and Tetsuro Ogi. Evaluation of information amount to present for motorcycle head-up display. Transactions of the JSME (in Japanese), Vol. 81, No. 830, pp. 15–00203, 2015. in Japanese. • Kenichiro Ito, Yoshisuke Tateyama, Hidekazu Nishimura, and Tetsuro Ogi. Evaluation of the position to present information using the head-up display for motorcycle. The transactions of Human Interface Society, Vol. 18, No. 4, pp. 435–442, November 2016. in Japanese. Refereed Full Papers in Conference Proceedings • Kenichiro Ito, Yoshisuke Tateyama, Hasup Lee, Hidekazu Nishimura, and Tetsuro Ogi. Development of head-up display for motorcycle navigation system. In APCOSEC2013 Proceedings Asia-Pacific Council on Systems Engineering Conference 2013. Asia-Pacific Council on Systems Engineering, September 2013., pp. No. TS-05-2. • Kenichiro Ito, Yoshisuke Tateyama, Hidekazu Nishimura, and Tetsuro Ogi. Development of motorcycle simulator in the immersive projection display. In ASIAGRAPH 2015 Forum in Taiwan Proceedings ASIAGRAPH 2015 Forum in Taiwan, Vol. 10. ASIAGRAPH, April 2015., pp. 41–46. Refereed Works in Conference (Demos and Posters) • (Poster) Kenichiro Ito, Yoshisuke Tateyama, Hasup Lee, Hidekazu Nishimura, and Tetsuro Ogi. Information presentation using head-up display for motorcycle rider. In ASIAGRAPH 2013 Forum in Hawai’i Proceedings ASIAGRAPH 2013 Forum in Hawai’i. ASIAGRAPH, April 2013., pp. 107–108. • (Demo) Kenichiro Ito, Hidekazu Nishimura, and Tetsuro Ogi. Head-up display for motorcycle navigation. In SIGGRAPH Asia 2015 Head-Up Displays and Their Applications, SA ’15, pp. 10:1–10:3, New York, NY, USA, 2015. ACM. 171
Non-refereed Conference Paper • Kenichiro Ito, Yoshisuke Tateyama, Hidekazu Nishimura, and Tetsuro Ogi. CAVE 二輪シミュレータを用いた HUD の評価. In VRSJ Research Report (in Japanese) 20th Conference on Tele-immersion Technology, TTS13-2, Vol. 18. Virtual Reality Society of Japan, June 2013., pp. 49–60. in Japanese. • Kenichiro Ito, Yoshisuke Tateyama, Hidekazu Nishimura, and Tetsuro Ogi. Evaluation of presenting information to motorcycle rider using head-up display. In Design & Systems Conference ’13 23th Conference on The Japan Society of Mechanical Engineers, Design and Systems Division. JSME, October 2013., pp. 3205-1–3205-10. in Japanese. • Kenichiro Ito, Yoshisuke Tateyama, Hidekazu Nishimura, and Tetsuro Ogi. Contents design of information presented on the head-up display for motorcycle. In Design & Systems Conference ’14 24th Conference on The Japan Society of Mechanical Engineers, Design and Systems Division. JSME, September 2014., pp. 1408-1–1408-8. in Japanese. • Kenichiro Ito, Hidekazu Nishimura, and Tetsuro Ogi. Visual processing evaluation on character types for navigation assist to motorcyclist. In Proceedings of the Human Interface Symposium 2015 Human Interface 2015 HAKODATE. Human Interface Society, September 2015., pp. 837–840. in Japanese. • Kenichiro Ito, Hidekazu Nishimura, and Tetsuro Ogi. Evaluation of motorcyclist visual information capacity using the head-up display. In Design & Systems Conference ’15 25th Conference on The Japan Society of Mechanical Engineers, Design and Systems Division. JSME, September 2015., pp. 2201-1–2201-8. in Japanese. • Kenichiro Ito, Hidekazu Nishimura, and Tetsuro Ogi. Design of presenting route information for motorcycle head-up display. In Design & Systems Conference ’16 26th Conference on The Japan Society of Mechanical Engineers, Design and Systems Division. JSME, October 2016., pp. 2508-1–2508-8. in Japanese. Non-first Author Publications • Tetsuro Ogi, Hidekazu Nishimura, and Kenichiro Ito. 没入型シミュレータを 用いた自動二輪車用 HUD の設計. In VRSJ Research Report (in Japanese) 30th Conference on Tele-immersion Technology, TTS16-3. Virtual Reality Society of Japan, December 2016., in Japanese. Others • Kenichiro Ito. 没入型シミュレータを用いた自動二輪車用ヘッドアップディ スプレイの設計. Invited Presentation at the 第 12 回二輪車の運動特性部門 委員会 in Society of Automotive Engineers of Japan (JSAE), March 2016. in Japanese. 172