SOFTWARE – PRACTICE AND EXPERIENCE Softw. Pract. Exper. (2013) Published online in Wiley Online Library (wileyonlinelibrary.com). DOI: 10.1002/spe.2201
A visual language-based system for extraction–transformation–loading development Vincenzo Deufemia* ,† , Massimiliano Giordano, Giuseppe Polese and Genoveffa Tortora Department of Management and Information Technology, University of Salerno, 84084 Fisciano (SA), Italy
SUMMARY Data warehouse loading and refreshment is typically performed by means of complex software processes called extraction–transformation–loading (ETL). In this paper, we propose a system based on a suite of visual languages for mastering several aspects of the ETL development process, turning it into a visual programming task. The approach can be easily generalized and applied to other data integration contexts beyond data warehouses. It introduces two new visual languages that are used to specify the ETL process, which can also be represented by means of UML activity diagrams. In particular, the first visual language supports data manipulation activities, whereas the second one provides traceability information of attributes to highlight the impact of potential transformations on integrated schemas depending on them. Once the whole ETL process has been visually specified, the designer might invoke the automatic generation of an activity diagram representing a possible orchestration of it based on its dependencies. The designer can edit such a diagram to modify the proposed orchestration provided that changes do not alter data dependencies. The final specification can be translated into code that is executable on the data sources. Finally, the effectiveness of the proposed approach has been validated through a user study in which we have compared the effort needed to design an ETL process in our approach with respect to the one required with main visual approaches described in the literature. Copyright © 2013 John Wiley & Sons, Ltd. Received 21 April 2012; Revised 24 March 2013; Accepted 12 April 2013 KEY WORDS:
data integration; visual languages; ETL processes
1. INTRODUCTION An extraction–transformation–loading (ETL) process is responsible for extracting data from multiple data sources, transforming them for cleansing and format change purposes, and loading them into a target data warehouse (DW). This software process is accomplished by hand in more than three quarters of the application projects in production today [1]. While hand-coded ETL is still workable in the context of a single application, the price is paid in the overall complexity spread throughout an enterprise, also because the code written for a specific project it can hardly be reused on other projects. Designing ETL processes can be extremely complex, costly, and time consuming [2–5]. ETL and data cleaning tools are estimated to cost at least one-third of effort and expenses in the budget of a DW [6], and this number can rise up to 80% of the development time in a DW project [7]. The difficulty mainly lies in the combination of data integration and data cleaning tasks: because data are often moved and transferred from a data store to another, the details of schema and value mappings play a great role. At the same time, the data can be in highly irregular states, in terms of duplicates, constraint and business rule violations, and in terms of irregularities in the internal structure of fields. For this reason, several data cleansing approaches have been proposed, many of which are based on approximate functional dependencies [8, 9]. *Correspondence to: Vincenzo Deufemia, Department of Management and Information Technology, University of Salerno, 84084 Fisciano (SA), Italy. † E-mail:
[email protected] Copyright © 2013 John Wiley & Sons, Ltd.
V. DEUFEMIA ET AL.
In this scenario, many tailored ETL approaches and automated tools have been proposed in the context of DW development [10, 11]. In particular, ETL development is usually structured as a three-tier process, where an initial conceptual design is iteratively refined through a logical and a physical design phases, at the end of which ETL are implemented and deployed. As a conceptual modeling language, some approaches employ UML [12, 13], whereas others use alternative graphical notations, such as Business Process Model Notation [14–16]. Moreover, several suites of tools, such IBM Websphere and PDI Pentaho, have been proposed to support the whole ETL development process. In addition, several researchers in this area have recently started advocating the introduction of a further semantically richer layer on the top of the ETL development process to enable the (semi-)automatic production of the logical and physical design [17, 18]. In other words, they aim to provide users with friendly languages to let them specify requirements at a high level of abstraction and simulate the impact of requirement changes over lower design layers. The achievement of the abovementioned goals is desirable, because it would yield a clean, friendly, and highly automated ETL development process. Nevertheless, there are many practical scenarios in which it is difficult to operate at design level. For instance, ETL development often starts from data scattered across heterogeneous databases, which do not always exhibit a proper conceptual schema and also the information systems using them are poorly documented. Moreover, it is not always clear what will be the analytical queries that will be invoked on such data, which is important to derive a proper requirement specification and trigger a well-structured design process. In such scenarios the developer often finds it useful to work at data level by using a trial–error approach, which might help him/her better understand the meaning of raw data and accomplish ETL development despite poor requirements. However, UML and other common modeling languages do not support such development paradigms. In this paper, we propose a system supporting ETL development based on a trial–error approach, which can be used alone or in combination with model-based approaches in all situations in which requirements are poor or incomplete. The proposed system is based on two visual languages, each providing a different view of the data during the ETL development process. In particular, the former is the Job Design Language (JoDeL), which is based on the spreadsheet metaphor, and it is mainly used to support typical data transformation operations based on a trial–error paradigm. The second language is the Data Traceability Language (DaT raL), which is based on the cause–effect diagrams [19], and it is used to trace attribute derivations and dependencies, particularly useful both in understanding data schemas and in evaluating the impact of potential schema evolution operations. At the end of the ETL development process, the system can also infer an activity diagram providing a higher level view on the specified process, which can be used to further analyze and extend it in a model-based fashion. JoDeL is mainly used to specify ETL jobs, where a job is a software application performing data transformations, and it is able to fetch data from several sources and store them into several target databases. The designer builds a spreadsheet by selecting attributes from data sources or by creating new ones. On the spreadsheet, he or she can define all kinds of transformations (as usual in spreadsheets), and apply filtering, join, and projection operators through visual metaphors. The result of this process is the definition of ETL jobs, which are defined as entities with (possibly more than one) an input schema, an output schema, and possibly a rejection schema for the rows that do not pass a given criterium. The system can exploit job specifications to automatically derive the activity diagram describing the whole orchestration of the ETL process. The user can edit the activity diagram to enhance it with dynamic aspects such as control flow information and time constraints on the job execution. JoDeL has the advantage of providing the designer with immediate feedbacks on data transformation operations. Nevertheless, because it is often used in contexts in which requirements are missing or incomplete, developers might need additional views on data to effectively accomplish ETL development. For instance, they might need to elicit the history of past transformations and the impact of hypothetical transformations on other data schemas. To this end, the system provides the DaTraL language, which is derived from Ishikawa’s cause–effect diagrams [19], a notation extensively employed in manufacturing to organize diagnostic knowledge about faults in manufacturing processes. Cause–effect diagrams have the visual appearance of a fishbone, which is Copyright © 2013 John Wiley & Sons, Ltd.
Softw. Pract. Exper. (2013) DOI: 10.1002/spe
A VISUAL LANGUAGE-BASED SYSTEM FOR ETL DEVELOPMENT
represented as a tree with branches called bones. Sub-branches represent the elements contributing to a fault. In contrast to a typical decision tree with decision points at each node in a tree, the Ishikawa diagram is primarily a concept organizing technique. These characteristics make Ishikawa diagrams suitable for analyzing the impact and history of data transformations. In particular, thanks to the visualization of attribute metadata and their history, DaTraL provides the developer with important attribute and transformation insights, which help him or her devise further transformations or reuse the ETL process on different data sources. The effectiveness of the proposed system has been validated through the execution of a user study, in which poor requirements were available, together with a set of raw logical data schemas to be integrated. We have compared performances of our tool with respect to those of other two visual language-based ETL development tools not using a trial–error approach, namely Kettle and Talend [20, 21]. The study has confirmed that in circumstances where proper specifications are missing, the trial–error approach is more effective. In particular, we have observed that with our approach the time to accomplish ETL development shortened from 30% to 50% with respect to other visual approaches mentioned earlier. The paper is organized as follows. Section 2 describes the visual languages of the proposed approach. In Section 3, we present a usability study confirming the effectiveness and efficiency of the proposed approach and a discussion on the results. In Section 4, we compare our approach and the tool with similar proposals described in the literature. Finally, conclusions and insights for future work are highlighted in Section 5. 2. VISUAL SPECIFICATION OF EXTRACTION–TRANSFORMATION– LOADING PROCESSES In this section, we present the two visual languages underlying our system for ETL development. Moreover, we also describe how the system generate the UML activity diagram representing job orchestration. To provide a more effective explanation, in what follows, we introduce a reference example, which will be used throughout the paper. 2.1. A reference example Let us consider a source data store containing clinical records, called Clinic, on which we will define an ETL process to populate a data mart of diagnosis, called Diagnosis. Figure 1(a) shows the conceptual schema of the operational data source, whereas Figure 1(b) shows the conceptual schema of the target data mart. The operational database contains information about therapeutic practices on ‘patients’. Each ‘therapeutic activity’ is identified by a unique ID, and it falls in one of three kinds of supported activities: ‘BioChemical’, ‘Instrumental’, and ‘Pharmacological’. Each therapeutic activity is made of a collection of ‘steps’, and each step is subject to a set of ‘preconditions’. Steps are also the building blocks of ‘Protocols’. A protocol specifies the ‘therapeutic path’ that the doctor adopts for a given patient. It might follow the ‘Standard’ specification, or it might be customized by the doctor to better fit patient requirements. The target schema, as well, is fact oriented and centered on diagnosis. Each diagnosis event is characterized by the number of evaluations that are the unique measure for this fact. Diagnosis and their evaluations might be analyzed along five dimensions: Patient, Date, Therapy, Anamnesis, and Protocol. We use the proposed ETL tool to feed the target data mart schema with data stored in the operational schema. All transformations take place over the Clinic schema, and resulting data are loaded into the Diagnosis schema by using a process defined through some JoDeL sentences. 2.2. JoDeL: using the spreadsheet metaphor for extraction–transformation–loading job definition In JoDeL, we exploit the characteristics of spreadsheets in the construction of ETL jobs, to simplify their construction and to overcome many of the abovementioned problems arising in traditional graph-based approaches. Copyright © 2013 John Wiley & Sons, Ltd.
Softw. Pract. Exper. (2013) DOI: 10.1002/spe
V. DEUFEMIA ET AL.
(a)
(b) Figure 1. Conceptual schemas of the operational data source (a) and of the target data mart (b).
It is well-known that spreadsheets provide a concise data representation, providing immediate and continuous feedbacks on the requested transformation operations, hence enabling a ‘trials and errors’ approach, which can potentially boost user productivity [22]. Another important advantage of spreadsheets is that most of their operations can be easily translated in a declarative language [23], such as Structured Query Language (SQL). At the same time, spreadsheets still support imperative procedures, which are particularly useful in the data transformation and cleaning phases. Main visual symbols of JoDeL are described in the appendix section. The key symbol is the Datasheet. Other visual symbols include Filtering, Join, plus symbols for common operations such as Union, Diff, Sort, and Group By. Following subsections provide detailed descriptions of such symbols. Copyright © 2013 John Wiley & Sons, Ltd.
Softw. Pract. Exper. (2013) DOI: 10.1002/spe
A VISUAL LANGUAGE-BASED SYSTEM FOR ETL DEVELOPMENT
Figure 2. The datasheet symbol: (a) key property icon, (b) datasheet name, (c) datasheet menu, (d) adds a new column, (e) performs join operation, (f) imposes filter definition, and (g) makes the datasheet persistent.
2.2.1. Datasheet. The ETL process can be modeled through several datasheets. A datasheet can be constructed by dragging an empty datasheet on the working area and by adding attributes to it by means of drag and drop operations from the data sources, or through the definition of new attributes by using common spreadsheet operations. Usually, a datasheet shows only a small portion of the underlying datasets. The designer might explore the dataset by defining transformations on attributes whose results are immediately visualized. It is worth noting that some transformations might require long processing time, because they need to perform computations over the entire dataset. However, before the whole computation is completed, we load an estimation of it into the spreadsheet [24]. In this way, designers can quickly sense if a particular query reveals anything interesting about the data. They can refine or halt the processing if necessary, and issue other queries for further investigations. By using the datasheet symbol, it is possible to perform the following operations: ! Data selection: by dragging the attributes of a data source on the icon representing the
datasheet; and
! Data transformation: by applying a predefined or user-defined function on one or more
attributes of the datasheet, according to the typical syntactic style of a spreadsheet.
During the design phase, the designer might also use the datasheet to perform analytical tasks on the data. In particular, the datasheet metaphor might be used to perform statistical operations over data, aggregation or analysis, and visual data exploration. Each time a user creates a datasheet it might make it persistent through the ‘sticky’ icon, which stores the datasheet into the target database (Figure 2). Working on our running example, we might clarify the use of datasheet basic functionalities by trying to populate the Patient dimension in the target diagnosis data mart. To accomplish this task, we need to extract data from the Patients table in the schema of the operational database. Whereas the sex dimensional attribute might be directly copied from the corresponding attribute in the Patients table, the dimensional attributes age, state, district, and town cannot be imported directly, rather they must be computed. Figure 3 shows a sample ETL sequence of steps to feed the Patient dimension. After copying the sex attribute by dragging it onto a new datasheet (Figure 3(a)), we can compute the age attribute by creating a new column in the datasheet just created, selecting the date of birth attribute from the Patients table in the operational database, and dropping it on the datasheet (Figure 3(b)). Afterwards, we add a new column age to the datasheet and bind it to a transformation function computing age from date of birth (Figure 3(b)). The transformation function is specified in a spreadsheet-like fashion, by entering the formula YEAR.TODAY.// " YEAR.Œ0 date of birth0 !/
where YEAR and TODAY are library functions, and Œ0 date of birth0 ! allows to refers to the column in the datasheet. Copyright © 2013 John Wiley & Sons, Ltd.
Softw. Pract. Exper. (2013) DOI: 10.1002/spe
V. DEUFEMIA ET AL.
(a)
(b)
(c)
Figure 3. Use of datasheet in selection of an attribute (a and b) and data transformation (c).
Figure 4. Application of the filtering operator on a datasheet.
2.2.2. Filtering operator. This operator enables the filtering of unwanted data, based on some restrictions. The elements filtered from a datasheet are defined through one or more conditions such as the null, the missing, and the out of range values. The filter operator is associated with a ‘Reject’ attribute visualizing all those elements of a source datasheet that do not fulfill the filter condition. The rejected rows can be used for different purposes, such as to validate the filter conditions. Moreover, if the designer needs to process these rows further, then he or she can use the reject datasheet. In this case, the filter operation plays the role of a splitter operator. If the rejected rows should not have a special treatment, then they can be ignored. In a real world context, such as our reference example, the filtering operator might be useful in several situations. For instance, it might be useful for data warehouse practitioners when they need to check whether a record exists and whether it has changed. In our example, instead of physically checking every field, we use an hash code to check if a set of columns has been updated. The leftmost datasheet in Figure 4 is the output of an ETL job, where a hash code is computed and stored the first time a record is inserted in the destination table. Therefore, the topmost datasheet on the right portion of the figure contains the condition of the specified filtering operator, which aims to highlight records whose hash code has not changed (middle datasheet on the right portion of the figure), and those for which it has changed (last datasheet on the right portion). Upon such visualization, the user might possibly decide to update tuples not satisfying the filtering condition, that is, those that were updated. 2.2.3. Join operator. The Join operator enables the typical join used in relational databases among several datasheets. It is possible to match rows from two or more different datasheets based on standard SQL processing. The types of join supported are: inner, left outer, right outer, and full outer. The operator is used in conjunction with the ‘condition’ operator, yielding a new resulting datasheet. If more than two input datasheets are joined, the join must be an inner join. Copyright © 2013 John Wiley & Sons, Ltd.
Softw. Pract. Exper. (2013) DOI: 10.1002/spe
A VISUAL LANGUAGE-BASED SYSTEM FOR ETL DEVELOPMENT
The Join operator is useful to complete the Patient Dimension table in our running example, to extract data about state, district, and town. Figure 5 shows a fragment of the JoDeL sentence performing this task. In detail, the Join operation is accomplished on the basis of the foreign key country in the Patients table. When joining two datasheets through JoDeL, the user might select the rows to include in the resulting datasheet, which is usually named by combining the names of the input datasheets. 2.2.4. Function application. Other than the abovementioned operations, more general data manipulation functions can be invoked on the elements of the datasheets. These can be either accomplished by specifying the functions formula on the first row of the datasheet or by invoking the assistance of a wizard, which provides the user with a visual interface to compose the formula, simplifying its specification. For instance, Figure 6 shows the composition of a function representing a data mining model. In particular, Figure 6(a) shows the selection of the input, output, and key features, whereas Figure 6(b) shows the specification of their content type. 2.2.5. Other common operations: Union, Diff, Sort, and Group By. Other than the previous basic operations, JoDeL supports further data manipulation functions. The Union operation unconditionally merges the rows of two datasheets into a single output datasheet. The Diff merges the rows of two datasheets into a single output datasheet, retaining only those rows existing in the first data set but not in the second one. Sort and Group By operations enable sorting and grouping of the datasheet elements based on attribute conditions, respectively. 2.2.6. Check operations: key violation and null values. The check operation enables the definition of rules on the elements of the datasheets and their enforcement. Any check operation has a corresponding icon on the datasheet that can be used to enable/disable it. The key violation (null values, respectively) operation allows to specify whether the elements in the column of a datasheet are all different (do not contain null values, respectively).
Figure 5. Application of the inner join operator on three datasheets.
(a)
(b)
Figure 6. Usage of the function composition wizard for specifying a data mining model. Copyright © 2013 John Wiley & Sons, Ltd.
Softw. Pract. Exper. (2013) DOI: 10.1002/spe
V. DEUFEMIA ET AL.
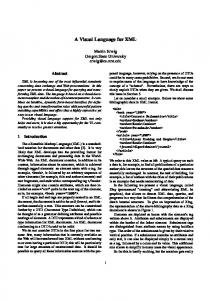
2.2.7. Flow operations: splitter, duplicator, and merger. As said earlier, the dataflow can be splitted by using a filter. The data flow might be duplicated by using the duplicator symbol, which receives as input a link from the datasheet to be duplicated, and it produces as output, the set of duplicated datasheets. Furthermore, some datasheets might be merged in a new one by using a combination of Join and/or Union. 2.2.8. Data warehouse operations: surrogate key generation, row (de)normalize, and pivoting. The surrogate key generation operator assigns a unique records identifier (surrogate key) to each record in a datasheet. This operator might be used in conjunction with a transformation function that removes duplicates in a datasheet to obtain a new datasheet suitable for populating a table dimension for a data warehouse. The row denormalize operation enables the user to produce an extensive denormalization step in which the values of a column in a datasheet are transformed, on the basis of some specified criteria, into decomposed values and populated into distinct columns. The row normalize operation performs the opposite task. Both operations are supported by the proposed visual language through the definition of (de)composition functions, which can be applied on datasheet columns. Pivot operators combine several related columns from an input datasheet into a single column in the output datasheet. Pivot operators group data from several related columns into a single column by creating additional rows. The pivot operator can be used when a number of column headings are as closely related that they make sense as values in a single column. The result datasheet contains fewer columns and more rows than the input datasheet. 2.3. DaTraL: attribute mapping traceability and visualization Historical information about attribute mappings can be organized into hierarchical models. Thanks to attribute traceability, the definition, evolution, and porting of an ETL process might be simplified and made more effective. To this end, we have defined the DaTraL visual language, exploiting Ishikawa diagrams [19], previously employed in manufacturing to organize knowledge about several problems that could cause a process to be out-of-control. Such as an out-of-control process, which simply does not meet some statistical requirements for the manufactured product, an attribute might be traced using the same approach. The full chain of transformations can be organized such as causal knowledge chains of ever decreasing granularity, grouped around the main subject that may be the attribute name. As an example, in Figure 7, we have an outlook over the duration attribute that is represented as a box on the right of the diagram. The duration attribute is obtained from the transformation of submission_start and submission_end attributes, from drug table in Diagnosis database. Moreover, these two attributes came from the subministrationDate attribute, selected together with other attributes from the Clinic database. In the following subsections, we first explain how the traceability information are extracted from ETL processes, and then how they are visualized.
Figure 7. A sentence of DaTraL showing attribute traceability information. Copyright © 2013 John Wiley & Sons, Ltd.
Softw. Pract. Exper. (2013) DOI: 10.1002/spe
A VISUAL LANGUAGE-BASED SYSTEM FOR ETL DEVELOPMENT
2.3.1. Computing traceability information. The data model underlying the DaTraL language is a directed graph structure, named traceability graph, where each node corresponds to the attributes involved in the ETL process, and edges represent operations applied to them. In particular, for each attribute in a datasheet for an ETL process, there exists a node in the traceability graph, and a directed edge from node a to node b, with label x, indicating that attribute a is transformed to attribute b through the application of operation x. The traceability graph is incrementally constructed during the definition of the ETL process. In particular, when an ETL operation is defined, the graph is updated by adding the corresponding nodes to it. It is worth noting that because an attribute of an ETL process has a node in the traceability graph for every operation in which it is involved, we have associated a timestamp to each node to provide an unambiguous match between nodes and attribute operations. Moreover, to efficiently access the node corresponding to a given attribute in a datasheet, we maintain an index on the attribute’s name, and on its timestamp. In this way, we can rapidly select the portion of the traceability graph representing the history of a given attribute and construct the DaTraL visual sentence. 2.3.2. Visualizing traceability information. DaTraL is composed of a set of visual symbols, which are described in Table A2 of Appendix. The key symbol is the attribute symbol, which might be connected through links to one or more transformation symbols. Each ETL process might be explored by analyzing its attribute mappings. Tracing attributes might be considerably useful, because a developer might evaluate schema refactoring impact over preexisting ETL processes, or assess how to adapt an ETL process to a different set of source schemas, improving code reuse. We call border attributes, those attribute instances directly connected to source/destination schema attributes. Analogously, we call intermediate attributes, those produced by transformations applied over other intermediate or border attributes. As an example, in Figure 7, patientID is a border attribute, whereas subministration end is an intermediate one. In reusing existing ETL processes with new source/destination schemas, the process logic, which mainly involves intermediate attributes, can be almost totally reused, whereas the border attribute mapping should be redesigned. Our visual approach simplifies reuse because it enables the visualization of misalignment between border attributes and the new source/destination schemas. In particular, attributes that are not aligned with the original schemas can be easily traced in our system, thanks to the attribute symbol of the DaTraL language, which shows an attribute and all metadata associated to it. Transformations in ETL processes are represented by using the transformation symbol, which is composed of a label connected to an attribute. The connection indicates that the attribute is transformed through the transformation function specified by the label. As an example, in Figure 7, the subtract transformation function is applied to subministration end to derive the attribute duration. By selecting a transformation function it is possible to see all the metadata associated to the function: input/output specification, dependencies, complexities, and documentation describing the transformation. 2.4. Job orchestration When the task of ETL job definition ends, the designer needs to define the execution plan, that is, the order and combination of task execution. This also includes the specification of time constraints on the execution of jobs, dynamic aspects of ETL processes, and sequencing of control flows. Control flow monitoring, error checking, or failure detection can also be specified. As an example, the control flow could notify the data warehouse administrator that some records failed to load properly. The language we use to represent ETL job orchestration is based on the UML activity diagrams 2.0. This notation allows us to define a graph of activity nodes connected through edges, which either represent the control flow or the object flow between the nodes representing the defined ETL jobs. In particular, edges together with synchronization/concurrency control symbols allow to coordinate the execution of the ETL jobs. Moreover, UML activity diagrams allow us to specify constraints on ETL jobs, to represent dynamic aspects and behavior, and to embed temporal constraints. Copyright © 2013 John Wiley & Sons, Ltd.
Softw. Pract. Exper. (2013) DOI: 10.1002/spe
V. DEUFEMIA ET AL.
Figure 8. An example of activity diagram orchestrating a set of extraction–transformation–loading jobs.
Figure 8 shows a simple example of job orchestration. The diagram is enclosed into a square box, which gives the name to the entire process. This name is the handle of the activity, and it can be used to invoke it in other activities. Each job is represented through the typical metaphor used in the UML activity diagrams. The main execution flow is represented by arcs, and the order of execution follows the activity diagram convention. In an activity, we can invoke ETL jobs characterized by the ‘’ stereotype, or other routines defined inside the system, as well as other ETL activities or system routines. In the example, three ETL jobs are invoked. In addition, as provided by the UML 2.0 activity diagram specification, actions such as ETL jobs might be triggered by conditions, subsequently mapped to events and functions of the underlying system. Furthermore, in the example the execution of Activity #1 is triggered by a temporal condition indicating that the activity should be carried out at midnight and by an event indicating that the number of new orders is greater than 100. Activity #1 is composed of several other subactivities. After their completion, other actions are executed. In particular, in case of clean exit, a report is generated; whereas in case of errors, a notification is sent by email to the administrator, and the exception is logged. Every activity diagram orchestrating a set of jobs is translated into an ‘Activity Script’ for the application server. This is automatically performed by means of a parser generated from visual language grammars [25]. In particular, the grammar formalism used to model orchestration diagrams is the eXtended Position Grammars [26, 27], which represent a direct extension of context-free string grammars with more general relations other than concatenation. Figure 9 shows a portion of the grammar productions for generating Activity Scripts. The terminals are in upper case style, for example, START, BAR, whereas the nonterminals in lower case. The right-hand side of the productions alternate grammar symbols with spatial relations, which are denoted in bold. These relations are defined on the attributes associated to the grammar symbols. As an example, a JOB symbol is in relation 1_1 with a SYNC symbol if and only if attaching point 1 of JOB, which represents an arc entering to or exiting from an activity symbol, is connected to attaching point 1 of SYNC, which represents the side of the synchronization bar where the activities enter. In other words, it specifies that the end point of an arrow exiting from an ETL job is connected to the borderline of a synchronization symbol. Productions 2–4 define nonterminal Activity as the START terminal symbol or as an Activity connected with a Job or a Sync bar. A Job can be a JOB terminal symbol, which Copyright © 2013 John Wiley & Sons, Ltd.
Softw. Pract. Exper. (2013) DOI: 10.1002/spe
A VISUAL LANGUAGE-BASED SYSTEM FOR ETL DEVELOPMENT
Figure 9. A portion of the eXtended Position Grammar for generating Activity scripts from activity diagrams.
represents a JoDel job, or an END terminal symbol (productions 8 and 9), whereas a Sync can be a BAR terminal symbol (production 6) connected to a set of incoming (production 7) or outcoming (production 8) Jobs. The semantic actions associated to the productions (those enclosed between braces) initialize the attribute values of the nonterminal on the left-hand side by using the attribute values of the symbols on the right-hand side and embed code for the generation of the Activity Scripts, which are XML files. As an example, the first instruction of the semantic action associated to production 3 generates a script line specifying that the ETL job represented by Job has to be executed after the one represented by Act ivity 0 . The second instruction specifies that Act ivity inherits the attributes of Act ivity 0 when the production is reduced. Notice that production 1 is merely defined for generating the closing tag of the script. The use of context-free such as productions in eXtended Position Grammars allowed the extension of the well-known LR parsing technique and automatic parser generator tools to visual languages, overcoming the inefficiency of previously proposed visual language parsing algorithms. In the generation process, the activity diagram is mapped on an Activity Script, where the events are taken from a list provided by the underlying system, and the control flow of the activity diagram is implemented by the control structures of the ‘Activity Scripting Language’. 2.4.1. Inferring the orchestration diagram. The proposed system provides a process modeling tool enabling the creation, display, and editing of graphical representations in ETL processes, including processes with nonlinear or asynchronous actions. Through the combination of various elements, such as action nodes, event links, and special purpose nodes, such as split and join nodes, complex processes can be modeled, including asynchronous, parallel, or iterative events and functions. Copyright © 2013 John Wiley & Sons, Ltd.
Softw. Pract. Exper. (2013) DOI: 10.1002/spe
V. DEUFEMIA ET AL.
Generally speaking, a process is modeled as a series of action nodes connected by event links. In addition, service requests are invoked from action nodes to objects associated with the process. The system can automatically infer graphical representations of ETL processes and represent them as UML activity diagrams, which the user can successively customize. The user invokes the inference process by selecting a set of ETL jobs, which yields a graphical representation of the consequent ETL process. To produce the latter, the system generates a dependency graph, deriving a possible execution order by means of topological sorting. In addition, the system can detect circular dependencies, which prevent the inference of a correct execution order. In this case, the system produces a graphical representation and it requests user intervention to break the dependence cycle. Finally, when the user approves the execution order, the system generates executable code based upon the graphical representation of the inferred ETL process. Code generation is obtained, thanks to code fragments that are associated with each element of a graphical representation. A code generator engine parses the graphical representation, and it uses the code fragments in addition to library resources to create an executable version of the process that has been modeled. 3. SYSTEM PROTOTYPE AND USER EVALUATION We have developed a system, namely the Graphical Data Integrator (GraDI), embedding the proposed visual languages. As shown in Figure 10, main system components are: ! a visual programming environment developed by using Java and JavaFX languages, ! a Java/XML component translating the visual specification into executable code, and ! an application server executing such code.
Figure 11 shows a screenshot of GraDI’s programming environment. Each editing step is logged into an XML file, which is interpreted for executing the ETL process. In particular, the XML interpreter translates the log file into executable code, which is composed of a set of Javascript functions and SQL code, and deploys it on the application server. To evaluate the effectiveness of the proposed ETL tool, we have run an experiment on the design of ETL procedures for a health care decision support system. In particular, we have performed a user study to evaluate the efforts required to develop ETL procedures with the proposed system, comparing them against those obtained with two popular open-source visual ETL tools, namely Kettle and Talend [20, 21]. Although the last two are more mature and complete systems, we have focused the comparison on the core tasks concerning the creation of the ETL process and the development of ETL procedures.
Figure 10. Deployment diagram describing the architecture of the Graphical Data Integrator tool. Copyright © 2013 John Wiley & Sons, Ltd.
Softw. Pract. Exper. (2013) DOI: 10.1002/spe
A VISUAL LANGUAGE-BASED SYSTEM FOR ETL DEVELOPMENT
Figure 11. Screenshot of the Graphical Data Integrator tool. Table I. Task organization.
Group A Group B Group C
GraDI
Kettle
Talend
t1 t3 t2
t2 t1 t3
t3 t2 t1
GraDI: Graphical Data Integrator.
3.1. Experiment setup The first important decision to be made when performing this type of empirical studies is to select an appropriate group of participants. Although selecting professionals that are supposed to use experimental technologies might appear the best choice, there are several difficulties preventing this option. In particular, experiments in industrial settings often require big efforts in terms of time, resources, and hence costs. Thus, before making investments for more accurate industrial level evaluations, it is often suggested to conduct preliminary studies with academic students [28]. Obviously, there are some risks underlying this choice, due to the lack of working experience and of maturity of students, which can be mitigated by considerations such as the effort they are keen to produce also for gaining a good course grade, the year of study, the open-mindedness, and the familiarity in working with not mature technologies. Moreover, several studies in the literature reveal that in empirical studies the differences between industrial professionals and graduate students are small [29]. Based on the previous considerations, we have performed an early evaluation of our solution by relying on graduate students. In particular, we have recruited 30 graduate students in Computer Science attending a course on Decision Support Systems, all having basic knowledge on ETL processes, but with no experience of ETL tools. The study has been organized in steps by using the think-aloud technique, an approach originating in cognitive psychology [30]. All the subjects first undertook a 2 h introductory course on the proposed visual languages, the GraDI tool and the open-source ETL tools Ket t le [20] and T alend [21]. After that, they were asked to use each tool for 20 min without invoking tutor support. Then, the subjects were divided in three groups of 10 elements (A, B, and C) on the basis of their grade point average. Each group was requested to accomplish three tasks (t1, t 2, and t 3), one per day. Table I shows the tools used by each group to solve their task. Each task consisted of creating an ETL job for the diagnosis analysis data mart described in Subsection 2.1. In particular, task t1 referred to the population of the Patient dimension, task t 2 to the population of Copyright © 2013 John Wiley & Sons, Ltd.
Softw. Pract. Exper. (2013) DOI: 10.1002/spe
V. DEUFEMIA ET AL.
(a)
(b)
Figure 12. Questions regarding the usability of the used tool (a) and those regarding a comparison among the surveyed tools (b).
the Therapy dimension, and task t 3 to the population of the Protocol dimension. For each task, the groups had 6 h to solve it by only using the assigned tool. We observed how students worked with the tools during the study. After finishing each task, they were asked to fill a post-task questionnaire regarding their experience with the tool, as shown in Figure 12(a). At the end, subjects where asked to fill a conclusive questionnaire to report their positive/negative opinions about the ETL tools, as shown in Figure 12(b). The judgment to the questions was given according to a Likert scale [31]: from 1 (very low) to 5 (very high). We accomplished our experiments on a PC with a 2.6 GHz Intel Core2 Duo CPU, 4 GB RAM, and Windows Vista operating system. 3.2. Results and discussion We have based the evaluation of GraDI on the responses of the questionnaire presented earlier, and on the time to produce a correct and at acceptable quality level solution for each assigned task, without evaluating intermediate incorrect or incomplete solutions. A comparison of the three ETL tools based on the quality of the produced solutions has not turned out to be effective, because we could not observe a correlation between the tool used for accomplishing a given task and the quality of the produced solution. The major or minor quality of the produced solutions could only somehow be related to the capabilities of the group members. The boxplots in Figure 13 report the distribution of the times required by each group to solve the assigned tasks. A boxplot shows average values (horizontal lines), interquartile ranges (boxes), the largest and smallest observations (whiskers). We can observe that for each task GraDI allows to considerably reduce the time to find an acceptable solution. Figure 14 shows the average values of user answers to the post-task questionnaire for each tool. The answers to question A.9 produce an average value close to two for all the three compared tools, meaning that they all yield a non-neglectable perceived complexity of the problem of finding a working solution, even if they bring this parameter below the average value of the used Likert scale. For the remaining questions, the curves reveal that on the three assigned tasks, GraDI has been perceived as the most usable tool. The boxplots in Figure 15 compares the distributions of user answers to the conclusive questionnaire. They reveal that even if simplifying the complex tasks related to ETL development, GraDI is not totally pleasant to use (Figure 15(c)) and that participants improved their judgements when not using it as the first tool (Figures 15(a), (b), and (d)). Copyright © 2013 John Wiley & Sons, Ltd.
Softw. Pract. Exper. (2013) DOI: 10.1002/spe
A VISUAL LANGUAGE-BASED SYSTEM FOR ETL DEVELOPMENT
(a) Task 1
(b) Task 2
(c) Task 3 Figure 13. Boxplots showing the distribution of times (in minutes) to solve the three tasks by each group. (a) Task 1, (b) Task 2, and (c) Task 3.
Figure 14. The average values of user answers to the post-task questionnaire for each tool.
Regarding open questions (B.5 and B.6), answers to question B.5 reveal that the main difficulties experienced by participants in the use of GraDI regarded the inability to modify the underlying source code as allowed in T alend and the way to report errors on the spreadsheets. Conversely, answers to question B.6 reveal that the appealing features of GraDI are the continuous visualization of data during ETL design, the visualization of attribute traceability, and the automatic orchestration of ETL jobs. Moreover, they also reveal that both groups prefer GraDI because it turns the ETL process into a synergic mix of visual programming and data manipulation tasks, providing a proper trade-off between the need of abstraction and prototyping. We have conducted a further analysis to discover possible correlations between characteristics of participants and responses. In particular, we found out that performances of participants were affected by familiarity with CASE tools, but not by grade point average and programming skills. 4. RELATED WORK In this section, we first describe main approaches of ETL development provided in the literature. Successively, we give an overview of existing tools supporting the ETL process, subdividing them Copyright © 2013 John Wiley & Sons, Ltd.
Softw. Pract. Exper. (2013) DOI: 10.1002/spe
V. DEUFEMIA ET AL.
(a) Question B.1
(b) Question B.2
(c) Question B.3
(d) Question B.4
Figure 15. Distribution of answers to conclusive questionnaire by group. (a) Question B.1, (b) Question B.2, (c) Question B.3, and (d) Question B.4.
into three main categories, namely open-source, commercial, and research prototype tools. Finally, we compare such approaches and tools with GraDI and its underlying approach. 4.1. Approaches to extraction–transformation–loading development From what said so far, it is clear that ETL is a complex programming process. Thus, many tools have been proposed to support ETL development as a design process. However, these are mainly based on specific conceptual and logical models. For this reason, researchers have started focussing on high-level, platform-independent, design approaches and their automatic implementation. In particular, the model proposed by Simitsis et al. [4] represents ETL processes as graphs where nodes represent transformations, constraints, attributes, and data stores, whereas edges represent dataflows, inter-attribute relations, compositions, and concurrent candidates. El Akkaoui et al. propose a high-level and platform-independent approach for conceptual design of ETL based on Business Process Model Notation [32], which they implement by means of the standard executable language Business Process Execution Language [33], but they also provide mechanisms for the automatic generation of vendor-specific code for several platforms [14, 15]. As an alternative design approach, Wilkinson and Simitsis use the hypercube as a conceptual model [34]. In particular, they extract data from sources and arrange them on extract hypercubes and define target hypercubes, namely load hypercubes. Therefore, they apply hypercube macro operations to map extract onto load hypercubes. Successively, semantically validated macro operations are expanded into detailed hypercube operations, from which logical ETL operations are generated. Moreover, there is a recent trend to make ETL design more an abstract process. In particular, many researchers have started advocating the necessity to embed ontologies and similar high-level abstraction techniques to enable the user specify ETL processes in a friendly language, from which to start the abovementioned modeling tasks [17, 18]. In this way, they promise to be able to considerably automate the logical and physical phases of the whole ETL production process [35–38]. Other authors stress on formal requirement analysis methods to (semi)automatically generate ETL conceptual models [39]. 4.2. Extraction–transformation–loading tools Since 1970s, several systems performing data transformation and integration have been introduced [40, 41]. Nowadays, there exist several commercial tools [42–46], several open-source tools Copyright © 2013 John Wiley & Sons, Ltd.
Softw. Pract. Exper. (2013) DOI: 10.1002/spe
A VISUAL LANGUAGE-BASED SYSTEM FOR ETL DEVELOPMENT
[20, 21, 47], and a few research prototypes [10, 11, 48]. In particular, we will focus on tools using visual languages for programming data ETL procedures. 4.2.1. Open-source extraction–transformation–loading tools. One of the most widely used opensource tools for data integration is Pentaho Kettle [20]. It is based on a metadata driven framework, which is in turn tightly integrated into an even larger business intelligence framework, the Pentaho BI Project, recently renamed Pentaho Data Integration. Kettle is classified as an ETL tool, even if the concept of classic ETL process has been slightly modified, yielding a four stage process named Extraction, Transportation, Transformation, and Loading. Kettle is a set of tools and applications allowing data manipulation across multiple sources. An important component of Pentaho Data Integration is Spoon – a graphical tool facilitating the design of Extraction, Transportation, Transformation, and Loading processes. It performs the typical dataflow functions such as reading, validating, refining, transforming, and writing of data to several different types of data sources and destinations. Transformations designed in Spoon can be executed with the Kettle tools named Pan and Kitchen. Figure 16 shows an example of ETL process specification accomplished with Spoon. Talend is a further example of open-source data integration tool. It provides data quality and profiling capabilities [21], and it generates Java or Perl code, which can later be run on a server. Talend provides a GUI, implemented as an add-on inside Eclipse Rich Client (RC). JasperETL, built on the top of Talend, is a tool for data integration, transformation, movement, cleansing, and enrichment [49]. It is a complete and ready-to-run data integration platform for organizations of all sizes. JasperETL can routinely extract, transform, and load data from operational systems into a ‘star schema’ style database, which can be safely and quickly accessed for interactive end-user reporting and data analysis. JasperETL includes a GUI job designer, which provides users with a graphical editor of the ETL process as well as a graphical view of transformations and complex mappings. CloverETL is a Java-based ETL framework that can be used to transform structured data [47]. It is accompanied by CloverGUI, which allows developers to create and modify data transformations in a graphical format. The developer selects graphical objects from a palette of existing components and pastes them onto a worksheet. Then he or she interconnects them into a graphical representation of a transformation graph. The graphical representation is then translated by CloverGUI into
Figure 16. Extraction–transformation–loading process specification with the tool Kettle. Copyright © 2013 John Wiley & Sons, Ltd.
Softw. Pract. Exper. (2013) DOI: 10.1002/spe
V. DEUFEMIA ET AL.
XML self-documenting code, which is subsequently executed by the CloverETL engine. In addition, CloverETL allows the integration of ETL management operators based on the available Java sources. The CloverGUI has been developed as an Eclipse plug-in. 4.2.2. Commercial extraction–transformation–loading tools. IBM InfoSphere DataStage is a commercial ETL tool and part of the IBM Information Platforms Solutions suite and the IBM InfoSphere [44]. It is a client server tool for designing, controlling, and engineering the ETL process. The Datastage Server is the engine accepting a series of transformation requests, taking over their execution. On the client side, there is a set of tools enabling the graphical design and deployment of the ETL applications. In particular, Datastage provides a graphical notation to construct data integration solutions, and it is available in various versions, such as the Server and the Enterprise Editions. Evolutionary Technologies International (ETI) provides a tool suite [45], named ETI EXTRACT, which is a code generating software product automating data transformation, reorganization, and integration. ETI EXTRACT tool generates all the code and necessary scripts to extract data from source systems, transform them as required, and load them into the target systems. Developers specify data integration issues by using ETI’s editors. The tool analyzes the integration project, and it generates the actual code in the generation engine. The ETI platform also includes a user interface helping customers automating the capture and communication of mapping specifications. Data Transformation Services (DTS) is a suite of tools conceived by Microsoft to automate ETL operations [46]. The software modules supporting DTS are packaged with MS SQL server. These packages include (a) DTS Designer, which is a GUI used to interactively design and execute DTS packages; (b) DTS Export and Import Wizards, that is, wizards that ease the process of defining DTS packages for the import, export, and transformation of data; and (c) DTS Programming Interfaces, which include a set of Object Linking and Embedding automation and a set of Component Object Model interfaces to create customized transformation applications for any system supporting Object Linking and Embedding automation or Component Object Model. In particular, the DTS Designer allows designers to build complex DTS Packages with workflows and event-driven logic. Each connection and task in DTS Designer is shown with a specific icon. These are joined with precedence constraints specifying the order and requirements for tasks to be run. One task may run, for instance, only if another task succeeds (or fails). Other tasks may run concurrently. 4.2.3. Research extraction–transformation–loading prototypes. ARKTOS II is a graphical design tool that models and executes the ETL process [48, 50]. In particular, an ETL scenario can be graphically modeled by using a graphical specification language based on a formal conceptual and logical model describing data sources, data targets, and the transformations between them. These tasks are greatly assisted (a) by a friendly GUI and (b) by a set of reusability templates. A useful feature in the construction of the dataflow of the scenario is the zoom-in/zoom-out capability. In particular, the designer can deal with a scenario at two levels of granularity: (a) at the entity or zoom-out level, where only the participating recordsets and activities are visible, and their provider relationships are abstracted as edges between the corresponding entities or (b) at the attribute or zoom-in level, where the user can see and manipulate the constituent parts of activities, along with their respective providers at the attribute level. The AJAX system is a data cleaning tool developed at INRIA France [10]. It deals with typical data quality problems, such as the object identity problem, mistyping errors, and data inconsistencies between matching records. This tool can be used either for a single source or for integrating multiple data sources. AJAX provides a framework wherein the logic of a data cleaning program is modeled as a directed graph of data transformations starting from some input source data. An interactive environment is supplied to the user to resolve errors and inconsistencies and to inspect intermediate results. The Potter’s Wheel system provides interactive data cleaning functionalities [11]. The system offers the possibility of performing several algebraic operations over an underlying dataset. The general idea behind Potter’s Wheel is that users build data transformations in an iterative and interactive way. In the background, Potter’s Wheel automatically infers structures for data values in terms of Copyright © 2013 John Wiley & Sons, Ltd.
Softw. Pract. Exper. (2013) DOI: 10.1002/spe
A VISUAL LANGUAGE-BASED SYSTEM FOR ETL DEVELOPMENT
user-defined domains and checks for constraint violations accordingly. Users gradually build transformations to clean the data by adding or undoing transformations on a spreadsheet-like interface; the effect of a transformation is shown at once on records visible on screen. These transformations are specified either through simple graphical operations, or by showing the desired effects on sample data values. However, the graphical interface for specifying data transformations might not be suitable for specifying transformations involving complex business logic. 4.3. Comparison with our proposal Although the high-level ETL design approaches surveyed earlier promise to turn ETL development in a clean process, in practice there many situations in which a reduced size of the project or the lack of proper documentation call for more agile development processes. Thus, the developer might need to manipulate data at instance level to better understand their meaning, to detect analogies and redundancies across multiple data sources, and to figure out the transformations that are necessary to map them onto a reconciliated schema. For small size projects, these activities alone might help the designer rapidly derive ETL procedures, especially if adequate support is provided through tools based on visual and trial–error paradigms. However, for large size projects instance-level manipulation activities can still proficiently complement high-level design approaches, because they might help integrating poor requirement specifications and suggest how to compose complex transformation functions. The proposed approach provides a visually assisted trial-and-error data manipulation paradigm, which can be used to rapidly produce ETL processes. These are represented by means of UML activity diagrams in case the developer needs to perform further analysis and refinements at conceptual or logical level. Alternatively, the proposed tool can also represent the output ETL processes by means of other conceptual or logical models, such as those surveyed previously [14, 15, 34]. Thus, the main advantage of our approach is that it provides an agile method for small ETL processes, but it can still benefit from the use of more rigorous design approaches when needed, in which case it helps eliciting requirements and characteristics of required transformations. Regarding ETL tools, in what follows, we compare GraDI with the tools surveyed earlier on the basis of usability aspects. In general, we could say that such tools share some common characteristics in the graphical user interface. In particular, they all provide a visual environment composed of: ! a repository, that is, a toolbox gathering all the items that can be used to describe the business
model or to sketch a job design; and
! a graphical workspace, usually a flowchart editor, to manipulate both business models and job
designs.
Within the graphical workspace jobs, all have the classical acyclic graph structure, starting from one or more sources and ending in one or more destinations. Moreover, part of the graphical workspace contains a set of icons useful to design the data workflow. Commercial ETL tools provide ad hoc programming interfaces for general transformations, which suffer from the lack of interactivity because errors in a program are not caught until the entire dataset has been transformed and rechecked for discrepancies. Moreover, it is not easy to write ‘compensatory scripts’ to undo an erroneous transformation. Indeed, some transformations, such as regular expression substitutions cannot be undone at all, forcing users to maintain and track multiple versions of potentially large datasets. In conclusion, although all the abovementioned tools provide a visual interface to facilitate ETL development, they lack some important features with respect to GraDI. In particular, they miss to provide feedbacks on the results of executed operations (the visual interfaces of some surveyed tools offer feedbacks only upon user requests), they lack visual support for analyzing traceability information, and they provide support only for long-running noninteractive operations. On the contrary, other than providing visual representations easy to understand, the tool GraDI provides users with instantaneous feedbacks, giving them the possibility to analyze traceability information of attributes, thereby allowing easy experimentations with different transformations. Copyright © 2013 John Wiley & Sons, Ltd.
Softw. Pract. Exper. (2013) DOI: 10.1002/spe
V. DEUFEMIA ET AL.
5. CONCLUSIONS AND FUTURE WORKS In this paper, we have proposed a visual language-based system for supporting ETL development. The system is mainly composed of two visual languages, namely JoDeL and DaTraL, which allow designers to interactively define ETL jobs, whose orchestration is described by means of UMLlike activity diagram. The JoDel language is based on the spreadsheet metaphor, and it assists the designer in structuring data integration activities, giving immediate feedbacks on the effects of the planned data transformation processes. The DaTraL language supports attribute traceability and mapping investigation. The whole visual specification is interpreted and translated into code executable on an application server. Moreover, the UML activity diagram is generated for validating the specified ETL process, but it can also be used as a requirement source that can be enriched to guide further refinements of the ETL process. The effectiveness of the proposed approach has been validated through the execution of a user study, which also evidences the circumstances in which GraDI contributes to improve productivity in the whole ETL development process. We are currently investigating higher level visual languages to be used in combination with our solution to try shooting at the complexity of ETL specification in larger projects, and tackling scaling up problems often arising with trial–error paradigms. We intend to evaluate these new proposals by applying the techniques proposed for monitoring user’s activity [51] and for implicitly capturing user’s feedbacks [52, 53]. Moreover, the possibility to work at conceptual level will also let us generalize the approach to other application contexts beyond data warehouses. As an example, we could handle the management of semi-structured data to perform data integration on Web sources, because the support of data integration aspects is a well-known weakness of mashup development tools [54]. Finally, we intend to use the proposed ETL tool to integrate and normalize the rock art archaeology data considered in the Indiana MAS project [55]. APPENDIX In this section, we provide details on the icon dictionary of both JoDeL and DaTraL visual languages.
(a) DataSheet
(b) Condition
(c)
(d)
(e)
Filter
Union
Group By
(f) Sort
(g) Diff
(h)
(i) Left
(j)
Inner Join
Outer Join
Right Outer Join
Figure A1. JoDeL visual symbols for extraction–transformation–loading job definition. (a) Datasheet, (b) Condition, (c) Filter, (d) Union, (e) Group By, (f) Sort, (g) Diff, (h) Inner Join, (i) Left Outer Join, and (j) Right Outer Join. Copyright © 2013 John Wiley & Sons, Ltd.
Softw. Pract. Exper. (2013) DOI: 10.1002/spe
A VISUAL LANGUAGE-BASED SYSTEM FOR ETL DEVELOPMENT
Table A1. Rationale of JoDeL’s visual symbols. Function
Description
Datasheet
A graphical element integrating the functionalities of a dataset and those of a spreadsheet; the datasheet has a typical table layout, and it offers the usual operations of a spreadsheet (Figure A1(a)).
Condition
A special spreadsheet enabling the specification of a set of rules in ‘or’. To specify multiple rules that must be valid at the same time, many condition symbols must be used. Condition sheet supports functions, logical expressions, and regular expressions (Figure A1(b)).
Filter
A graphical element allowing the application of a filter on a given datasheet; this operation is affected by a constraint specified by means of the ‘condition’ sheet (Figure A1(c)).
Union
It is used to combine two or more datasheets. Each datasheet used with the Union operator must have the same number of columns, otherwise the user is prompted for the selection of a subset of the biggest datasheet column. Columns must also have similar data types, and must be in the same order (Figure A1(d)).
Group By
It is used in conjunction with an aggregate functions to group the datasheet by one or more columns (Figure A1(e)).
Sort
It sorts the result set by one or more columns, in ascending or descending order (Figure A1(f)).
Diff
Similar to Union, but whereas this essentially acts as an OR operator (value is selected if it appears in one datasheet), Diff acts as an AND operator (value is selected only if it appears in any datasheets) (Figure A1(g)).
Inner, left outer, and right outer join operators
They enable inner/left outer/right outer join operations between datasheets, respectively. They are typically used in conjunction with the ‘condition’ sheet, but as opposed to the filter operator they are associated to two or more datasheets (Figure A1(h), (i), and (j)).
Table A2. Rationale of DaTraL’s visual symbols. Function
Description
Attribute
A graphical element representing one database attribute both as the source and as the destination of an attribute transformation. If a refactoring of the underlying schema breaks the dependencies among source destination attributes, all the attributes involved in the refactoring will be depicted in red (Figure A2(a)).
Transformation
A graphical element representing one attribute transformation. By interacting with this graphical symbol, it is possible to achieve more details about the nature of the transformation (i.e., input parameters, output type, etc.) (Figure A2(b)).
Arrow
It enables tracing transformations between datasheets. This operator is typically used in conjunction with the ‘attribute’ graphical element or with the ‘transformation’ graphical element. It enables the association between a transformation and an attribute or between a source and a destination attribute (Figure A2(c)).
Copyright © 2013 John Wiley & Sons, Ltd.
Softw. Pract. Exper. (2013) DOI: 10.1002/spe
V. DEUFEMIA ET AL.
(a) Attribute
(b) Transformation (c) Arrow
Figure A2. DaTraL visual symbols. (a) Attribute, (b) transformation, and (c) arrow.
ACKNOWLEDGEMENTS
This research is supported by the ‘Indiana MAS and the Digital Preservation of Rock Carvings’ FIRB project funded by the Italian Ministry for Education, University and Research, under grant RBFR10PEIT.
REFERENCES 1. 2. 3. 4. 5. 6. 7. 8. 9. 10. 11. 12. 13. 14. 15. 16. 17. 18. 19. 20. 21. 22. 23. 24.
Madsen MR. The role of open source in data integration. Technical Report, January 2009. Inmon WH. Building the Data Warehouse. John Wiley & Sons, Inc.: New York, NY, USA, 1996. Inmon WH. The Data Warehouse Budget. DMReview Magazine: New York, NY, USA, 1997. Vassiliadis P, Simitsis A, Skiadopoulos S. Conceptual modeling for ETL processes. In Proceedings of the 5th Acm Int. Workshop on Data Warehousing and OLAP. McLean: USA, 2002; 14–21. Simitsis A, Vassiliadis P, Sellis T. State-space optimization of ETL workflows. IEEE Transactions on Knowledge and Data Engineering 2005; 17(10):1404–1419. Shilakes C, Tylman J. Enterprise Information Portals. Merrill Lynch, Inc.: New York, NY, USA, 1998. Demarest M. The politics of data warehousing. Available from: http://www.noumenal.com/marc/dwpoly.html [Accessed date: 12 May 2013]. Chang S-K, Deufemia V, Polese G, Vacca M. A normalization framework for multimedia databases. IEEE Transactions on Knowledge and Data Engineering 2007; 19(12):1666–1679. Song S, Chen L. Differential dependencies: Reasoning and discovery. ACM Transactions on Database Systems 2011; 36(3):16:1–16:41. Galhardas H, Florescu D, Shasha D, Simon E. Ajax: An extensible data cleaning tool. In Proceedings of the 2000 ACM SIGMOD International Conference on Management of Data. ACM: New York, NY, USA, 2000; 590. Raman V, Hellerstein JM. Potter’s wheel: An interactive data cleaning system. In Proceedings of the 27th International Conference on Very Large Data Bases. Morgan Kaufmann Publishers Inc.: San Francisco, CA, USA, 2001; 381–390. Luján-Mora S, Vassiliadis P, Trujillo J. Data mapping diagrams for data warehouse design with UML. In ER, Vol. 3288, Atzeni P, Chu WW, Lu H, Zhou S, Ling TW (eds), LNCS. Springer: Berlin Heidelberg, 2004; 191–204. Trujillo J, Luján-Mora S. A UML based approach for modeling ETL processes in data warehouses. In ER, Vol. 2813, Song I-Y, Liddle SW, Ling TW, Scheuermann P (eds), LNCS. Springer: Berlin Heidelberg, 2003; 307–320. El Akkaoui Z, Zimanyi E. Defining ETL worfklows using BPMN and BPEL. In Proceedings of the ACM Twelfth International Workshop on Data Warehousing and OLAP. ACM: New York, NY, USA, 2009; 41–48. El Akkaoui Z, Zimànyi E, Mazón J-N, Trujillo J. A model-driven framework for ETL process development. In Proceedings of the ACM 14th International Workshop on Data Warehousing and OLAP. ACM: New York, NY, USA, 2011; 45–52. Vassiliadis P, Simitsis A, Skiadopoulos S. Conceptual modeling for ETL processes. In Proceedings of DOLAP’02. ACM: New York, NY, USA, 2002; 14–21. Simitsis A, Skoutas D, Castellanos M. Representation of conceptual ETL designs in natural language using semantic web technology. Data & Knowledge Engineering 2010; 69(1):96 –115. Skoutas D, Simitsis A, Sellis T. Ontology-driven conceptual design of ETL processes using graph transformations. In Journal on Data Semantics XIII, Spaccapietra S, Zimányi E, Song I-Y (eds). Springer-Verlag: Berlin, Heidelberg, 2009; 120–146. Ishikawa K. Guide to Quality Control. Asian Productivity Organization: Tokyo, 1976. Pentaho. Kettle. Available from: http://kettle.pentaho.org [Accessed date: 12 May 2013]. Talend. Talend Open Studio. Available from: http://www.talend.com [Accessed date: 12 May 2013]. Brady JT. A theory of productivity in the creative process. IEEE Computer Graphics and Applications 1986; 6(5):25–34. Bullen S, Bovey R. The Definitive Guide to Developing Applications Using Microsoft Excel and VBA. Addison-Wesley: Boston, MA, USA, 2005. Hellerstein JM, Avnur R, Chou A, Hidber C, Olston C, Raman V, Roth T, Haas PJ. Interactive data analysis: The control project. Computer 1999; 32(8):51–59.
Copyright © 2013 John Wiley & Sons, Ltd.
Softw. Pract. Exper. (2013) DOI: 10.1002/spe
A VISUAL LANGUAGE-BASED SYSTEM FOR ETL DEVELOPMENT 25. Costagliola G, Deufemia V, Polese G, Risi M. A parsing technique for sketch recognition systems. In IEEE Symposium on Visual Languages and Human-Centric Computing. IEEE Computer Society: Los Alamitos, CA, USA, 2004; 19–26. 26. Costagliola G, Deufemia V, Polese G. Visual language implementation through standard compiler-compiler techniques. Journal of Visual Languages and Computing 2007; 18(2):165–226. 27. Costagliola G, Deufemia V, Risi M. Sketch grammars: A formalism for describing and recognizing diagrammatic sketch languages. In International Conference on Document Analysis and Recognition. IEEE Computer Society: Los Alamitos, CA, USA, 2005; 1226–1231. 28. Carver J, Jaccheri L, Morasca S, Shull F. Issues in using students in empirical studies in software engineering education. In Proceedings of Ninth International Symposium on Software Metrics, Sydney, Australia. IEEE Computer Society: Los Alamitos, CA, USA, 2003; 239 –249. 29. Runeson P. Using students as experiment subjects - an analysis on graduate and freshmen psp student data. Proceedings of 7th International Conference on Empirical Assessment & Evaluation in Software Engineering, Keele, UK, 2003; 95 –102. 30. Norman KL, Panizzi E. Levels of automation and user participation in usability testing. Interacting with Computers 2006; 18:246–264. 31. Oppenheim AN. Questionnaire Design, Interviewing, and Attitude Measurement. Martin’s Press: London, 1992. 32. OMG (OBJECT MANAGEMENT GROUP). Business process modeling notation (bpmn), 2011. Available from: http://www.omg.org/spec/BPMN/2.0/ [Accessed date: 12 May 2013]. 33. OASIS. Web services business process execution language version 2.0, 2007. Available from: http://docs.oasisopen.org/ wsbpel/2.0/wsbpel-v2.0.pdf [Accessed date: 12 May 2013]. 34. Wilkinson K, Simitsis A. Designing integration flows using hypercubes. In Proceedings of the 14th International Conference on Extending Database Technology, EDBT/ICDT ’11. ACM: New York, NY, USA, 2011; 503–508. 35. Simitsis A, Vassiliadis P, Dayal U, Karagiannis A, Tziovara V. Benchmarking ETL workflows. In Performance Evaluation and Benchmarking, Nambiar R, Poess M (eds). Springer-Verlag: Berlin, Heidelberg, 2009; 199–220. 36. Simitsis A, Wilkinson K, Castellanos M, Dayal U. QoX-driven ETL design: Reducing the cost of ETL consulting engagements. In Proceedings of the 2009 ACM SIGMOD International Conference on Management of Data. ACM: New York, NY, USA, 2009; 953–960. 37. Simitsis A, Wilkinson K, Castellanos M, Dayal U. Optimizing analytic data flows for multiple execution engines. In Proceedings of the 2012 ACM SIGMOD International Conference on Management of Data. ACM: New York, NY, USA, 2012; 829–840. 38. Wilkinson K, Simitsis A, Castellanos M, Dayal U. Leveraging business process models for ETL design. In Conceptual Modeling ER 2010, Vol. 6412, Parsons J, Saeki M, Shoval P, Woo C, Wand Y (eds), Lecture Notes in Computer Science. Springer Berlin: Heidelberg, 2010; 15–30. 39. Romero O, Simitsis A, Abelló A. GEM: requirement-driven generation of ETL and multidimensional conceptual designs. In Proceedings of the 13th International Conference on Data Warehousing and Knowledge Discovery, DaWaK’11. Springer-Verlag: Berlin, Heidelberg, 2011; 80–95. 40. Roth MT, Schwarz PM. Don’t scrap it, wrap it! A wrapper architecture for legacy data sources. In Vldb ’97: Proceedings of the 23rd International Conference on Very Large Data Bases. Morgan Kaufmann Publishers Inc.: San Francisco, CA, USA, 1997; 266–275. 41. Shu NC, Housel BC, Taylor RW, Ghosh SP, Lum VY. Express: A data extraction, processing, and restructuring system. ACM Transactions on Database Systems 1977; 2(2):134–174. 42. Corporation DataMirror. Transformation server. Available from: http://www.datamirror.com [Accessed date: 12 May 2013]. 43. IBM. Ibm data warehouse manager. Available from: http://www-01.ibm.com/software/data/db2/datawarehouse [Accessed date: 12 May 2013]. 44. IBM. InfoSphere DataStage. Available from: http://www-01.ibm.com/software/data/infosphere/datastage/ features.html [Accessed date: 12 May 2013]. 45. Evolutionary Technologies Intl. Eti extract. Available from: http://www.eti.com/ [Accessed date: 12 May 2013]. 46. Microsoft. MS data transformation services. Available from: http://msdn.microsoft.com/en-us/library/aa933484 (SQL.80).aspx [Accessed date: 12 May 2013]. 47. Pavlis D. Clover ETL. Available from: http://www.cloveretl.org [Accessed date: 12 May 2013]. 48. Vassiliadis P, Simitsis A, Georgantas P, Terrovitis M, Skiadopoulos S. A generic and customizable framework for the design of ETL scenarios. Information Systems 2005; 30(7):492–525. 49. Jaspersoft. JasperETL. Available from: http://www.jaspersoft.com/jasperetl [Accessed date: 12 May 2013]. 50. Vassiliadis P, Simitsis A, Skiadopoulos S. Modeling ETL activities as graphs. In DMDW, Vol. 58, Lakshmanan LVS (ed.), CEUR Proceedings. CEUR-WS.org: Aachen, 2002; 52–61. 51. Costagliola G, Fuccella V, Giordano M, Polese G. Monitoring online tests through data visualization. IEEE Transactions on Knowledge and Data Engineering 2009; 21(6):773–784. 52. Deufemia V, Giordano M, Polese G, Simonetti LM. Exploiting interaction features in user intent understanding. In Web Technologies and Applications, Vol. 7808, Ishikawa Y, Li J, Wang W, Zhang R, Zhang W (eds), Lecture Notes in Computer Science. Springer Berlin: Heidelberg, 2013; 506–517. Copyright © 2013 John Wiley & Sons, Ltd.
Softw. Pract. Exper. (2013) DOI: 10.1002/spe
V. DEUFEMIA ET AL. 53. Deufemia V, Giordano M, Polese G, Tortora G. Inferring web page relevance from human-computer interaction logging. In Proceedings of the 8th International Conference on Web Information Systems and Technologies, Krempels K-H, Cordeiro J (eds). SciTePress: Setubal, Portugal, 2012; 653–662. 54. Di Lorenzo G, Hacid H, Paik H, Benatallah B. Data integration in mashups. SIGMOD Record 2009; 38(1):59–66. 55. Mascardi V, Deufemia V, Malafronte D, Ricciarelli A, Bianchi N, de Lumley H. Rock art interpretation within Indiana MAS. In Agent and Multi-Agent Systems. Technologies and Applications, Vol. 7327, Jezic G, Kusek M, Nguyen N-T, Howlett R, Jain L (eds), Lecture Notes in Computer Science. Springer: Berlin Heidelberg, 2012; 271–281.
Copyright © 2013 John Wiley & Sons, Ltd.
Softw. Pract. Exper. (2013) DOI: 10.1002/spe