[11] K. Toyama, B. Brumitt, J. Krumm, and B. Meyers, âWallflower: Principles and practicle of background maintenance,â The IEEE. International Conference on ...
1
A Distributed Visual Surveillance System Xiaojing Yuan, Zehang Sun, Yaakov Varol, and George Bebis Department of Computer Science, University of Nevada, Reno (xjyuan,zehang,varol,bebis)@cs.unr.edu Abstract We present a distributed vision-based surveillance system. The system acquires and processes grey level images through one or multiple Camera Units monitoring certain area(s) via a Local Area Network (LAN) and is capable of combining information from multiple Camera Units to obtain a consensus decision. It can be trained to detect certain type of intrusions, for example pedestrians, a group of pedestrians, vehicles, pets etc., and minimizes false alerts due to other non-interested intrusions. As a case study, we aim to detect Pedestrian/Vehicle in an observation area. Our vision-based intrusion detection approach consists of two main steps: background subtraction based Hypothesis Generation(HG) and appearance-based Hypothesis Verification(HV). HG hypothesizes possible threats(intrusions), and HV verifies those hypotheses using Gabor filter for feature extraction and Support Vector Machines (SVMs) for classification. The system has been tested under unconstrained outdoor environment, illustrating good performance.
I. Introduction There has been a growing interest and efforts in the surveillance industries to build optical sensor based automatic systems - Intelligent Vision-based Surveillance Systems(IVSS). IVSS aims to automate object detection, recognition, tracking and activity understanding in dynamic scenes. It is of great social importance due to its potential value to enhance security. IVSS involves many of the core topics in computer vision area such as moving object detection, tracking, classification, activity learning and semantic interpretation of object behaviors. In this paper, we present a trainable distributed vision-based surveillance system using static cameras under unconstrained outdoor environment. Currently, our system is trained to detect pedestrians and vehicles presented in the observation scenes, however, it can be very easily trained to detect different intrusions. The following is a brief review of some previous works targeting Pedestrian/Vehicle detection. The reviewed approaches here, as well as the developed system, are under the static camera assumption. Pedestrians are non-rigid objects with a high degree of variability in shape, scale, location, orientation, pose, and occlusion. Compared to face detection [1], pedestrian detection has received dramatically less attention in the literature. Oren et al. [2] used an “overcomplete dictionary” of wavelet basis functions to extract features and SVMs as the
classifier. Ozer et al. [3] proposed an algorithm for human detection in JPEG compressed still images and MPEG I frames by using an eigenspace representation of human silhouettes. It was, however, not for real-time application. Haritaoglu et al. [4] developed a single camera system to detect and monitor people by combining shape analysis and tracking. They used a simplified Gaussian model, where the absolute maximum, minimum and the largest consecutive difference values were utilized. An improved Point Distribution Model followed by Principal Component Analysis (PCA) approach was employed in [5] to detect and track pedestrians in images caught by a moving camera. Similar to pedestrian detection, vehicle detection is a difficult task in general. Vehicles, for example, come into view with different speeds and may vary in shape, size, and color. Also, vehicle appearance depends on its pose and is affected by nearby objects. In-class variability, occlusion, and lighting conditions also change the overall appearance of vehicles. Foresti et al. used line segments as descriptive primitives and each line segment was characterized by its position, orientation, endpoints and length. Vehicle detection was based on those line segments as well as some constraints such as size[6]. In [7], a deformable model is formed from manually sampled data using PCA. Both the structure and pose of a vehicle can be recovered by fitting the PCA model to the image. A convex polygon shape describer approximated by cubic splines with 12 control points was used in [8] to detect and track multiple vehicles. Two ”trap” positions were predefined in the observed area, one was for hypothesis generation, and the other for verification in [9]. The hypothesis generation used three 1-D correlation along x, y, z directions, while verification employed 2-D sparse template-matching. The literature shows that most of the static camera based vehicle detection methods utilize some templates consisting of segments or curves. In this paper, we use appearance-based method, which is a more powerful approach and has been used in the context of on-road vehicle detection (vehicle detection in images acquired by a moving vehicle) [10]. We have developed a trainable distributed surveillance system using static optical sensors. Not just a motion detector, this vision-based system is specifically designed with the capability to recognize certain objects(unauthorized vehicle, people, or animals). It minimizes false alarms due to other non-interested intrusions. When a suspicious intrusion is detected, an alarm indicating the type of the intrusions(vehicle, people etc.), the spot of the intrusions (observation area I, observation area II, etc.) will be sent to the server (customer’s security control center) along with the
ferent application requirements. In this paper, we consider the problem of Pedestrian/Vehicle detection, the system, however, is applicable to other type of intrusion detections.
corresponding video display. From application perspective, the main features of this system are: First, it is a trainable system i.e. we can easily train the system for different usages, for instance, alert us when vehicles, pedestrians or pets are present in some observation area. Second, it is a distributed system - heavy computations are distributed to terminal PCs. And it can monitor multiple areas simultaneously and fuse the alert information in the server to make a consensus decision. Technically speaking, the whole system consists of multiple cameras connected by a Local Area Network (LAN), vision-based object detection and classification algorithms. Our vision-based algorithm is a two-stage approach: Hypothesis Generation(HG) and Hypothesis Verification(GV). Specifically, HG hypothesizes the possible threat locations using background subtraction method and HV verifies if there are true threats. HV, essentially, is a pattern classification problem and we use Gabor filter to extract features and Support Vector Machines(SVM) to perform the classifications. The rest of the paper is organized as follows: In Section II, a general description of the developed system is provided. A description of the hypothesis generation is given in Section III. The appearance-based hypothesis verification using the Gabor Filter and SVMs are detailed in Section IV. Our experimental results are presented in Section V. Section VI contains our conclusions and plans for future work.
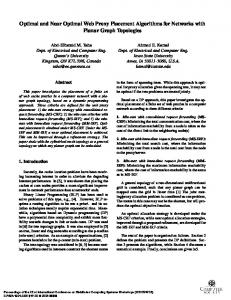
Fig. 1. System diagram
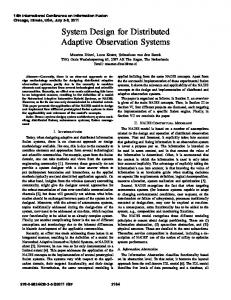
III. Hypothesis Generation Using Simple Background Subtraction The purpose of the HG stage is to search for the likely Pedestrian/Vehicle presences in a frame. “Background subtraction” method is employed in this paper. It is a common technique for finding moving objects in a video sequence. The idea is that moving objects can be found by subtracting the stationary background image from the current image. Several practical problems have to be solved to make background subtraction a more reliable approach. These problems, addressed in detail by Toyama et al. [11], as well as [12], include but are not limited to: • Threshold setting: A predefined threshold has to be used to assign a pixel to background/foreground; • Quick illumination changes: A quick illumination change, locally or globally, will cause severe false detection; • No spatial information: we process each pixel independently without any use of spatial information or more generic, higher-level information; • Shadows: Objects cast shadows that might also be classified as foreground due to the illumination change in the shadow region. Lots of researches have been carried out to improve the background substraction method, for instance, mixture of Gaussian model[13], integrated region- and pixel-based approach, integrated color and gradient information approach[12] etc.. In this paper, we do not put much effort in the background subtraction (HG stage) due to the following reasons: (a). Processing speed is very important in any surveillance systems, the more sophisticated the method is, the more time it requires, and (b). The two-step method (HG followed by HV) limits the system’s demanding for background subtraction. The HG stage is used to generate some hypotheses, which will have to pass further verification to trigger an alarm. Even if we have some false hypotheses, we still have big chance to screen them out in the following HV stage. In other words, the difficulties inherited in the background subtraction are mitigated to our
II. system overview The minimum configuration of the system is one server connected with one client - a camera connected to and controlled by a terminal PC, referred to as a Camera Unit hereafter. In practice, one server will be connected to multiple clients(Camera Units), each located at a different location, see Fig. 1. The communication between the server and each client is based on TCP/IP protocols. The server and the clients are not equal peers in terms of communication, because: (a). Each client communicates with the server only, while the server talks with a group of clients; (b). Usually it is the client that starts a communication session when it has information to send, while the server does not know when, and which client will send messages beforehand. The server will listen to all its ports all the time. Therefore, the server communication socket and the client sockets are implemented with different models. When a client system reboots, it will ask for the IP address of the server, and then create a socket to communicate with that address only. The server is not bound to communicate with any specific client. It will listen to all the ports for incoming messages, and the reply packet, if any, will be sent to the port from which the request is received. Each of the Camera Units is equipped with the object detection and classification algorithms. It processes captured images constantly and alerts the security center, by sending alarm information as well as the corresponding images to the server, only when certain types of intrusions happen. Our detection and classification algorithm is trainable - we can train the system to detect different objects to meet dif2
where σu = 12 πσx , σv = 12 πσy and ½ x ˜ = x cos θ + ysinθ y˜ = −x sin θ + ycosθ
HV stage, where some false detection can be easily ruled out. We can see there are false hypotheses in both of the two examples, see Fig. 2, where the HV comes in.
(3)
where σu and σv are the scaling parameters of the filter (i.e., determine the effective size of the neighborhood of a pixel), W is the center frequency, and θ determines the orientation of the filter (i.e., it will respond stronger to a bar or edge, the normal to which coincides with θ). Gabor filters act as local bandpass filters. Fig.3(a) shows the power spectrum of a 3 × 5 Gabor filter bank and Fig.3(b) shows 4 × 6 Gabor filter bank (the light areas indicate spatial frequencies and wave orientation). In this paper, we use the design strategy described in [18]. Given an input image I(x, y), Gabor feature extraction is performed by convolving I(x, y) with a Gabor filter bank: Z Z r(x, y) = I(ξ, η)g(x − ξ, y − η)dξdη (4)
Fig. 2. Hypothesis generation using background substraction
IV. Appearance-based Hypothesis Verification Intrusion detection and classification (Pedestrian/Vehicle) are essentially a three-class pattern classification problem - Pedestrian, Vehicle, and Others. Gabor filter, as feature extraction method, and SVMs, as classifiers, are utilized in the HV step. In particular, redundant statistical Gabor features extracted from several partial overlapped windows, together with Gaussian kernel SVM, compensate for errors introduced in HG step, makes the system more robust.
Although the raw responses of the Gabor filters could be used directly as features, some kind of post-processing is usually applied (e.g., Gabor-energy features, thresholded Gabor features, and moments based on Gabor features [19]). In this paper, we use Gabor features based on moments, extracted from several subwindows of the input image (see Section IV-B)
A. Gabor Filter and SVMs Review
(a)
(b)
(c)
A.1 Gabor Filters Fig. 3. (a) Gabor filter bank with 3 scales and 5 orientations; (b) Gabor filter bank with 4 scales and 6 orientations; (c) Feature extraction subwindows.
There has been an increased interest in Gabor analysis motivated by biological findings (i.e., the receptive fields of neurons in the visual cortex are known to have shapes that can be approximated by 2-D Gabor filters [14]). Gabor filters have been successfully applied to many image analysis applications including texture analysis [15] [16], handwritten number recognition [17], and image retrieval [18]. An important property of Gabor filters is that they have optimal joint localization both in the spatial and frequency domains [14]. The general function of the two-dimensional Gabor filter family can be represented as a Gaussian function modulated by an oriented complex sinusoidal signal. Specifically, a two dimensional Gabor filter g(x, y) and its Fourier transform G(u, v) can be written as: g(x, y) =
h 1 x ˜2 y˜2 i 1 exp − ( 2 + 2 ) exp[2πjW x ˜] 2πσx σy 2 σx σy
1 (u − W )2 v2 G(u, v) = exp[− ( + )] 2 σu2 σv2
A.2 SVMs SVMs are primarily two-class classifiers that have been shown to be an attractive and more systematic approach to learn linear or non-linear decision boundaries [20] [21]. Given a set of points, which belong to either of two classes, SVM finds the hyperplane leaving the largest possible fraction of points of the same class on the same side, while maximizing the distance of either class from the hyperplane. This is equivalent to performing structural risk minimization to achieve good generalization [20] [21]. Assuming l examples from two classes
(1)
(x1 , y1 )(x2 , y2 )...(xl , yl ), xi ∈ RN , yi ∈ {−1, +1}
(5)
finding the optimal hyper-plane implies solving a constrained optimization problem using quadratic program-
(2) 3
consideration, while position information is essentially discarded. This is particularly useful to compensate for errors in the hypothesis generation step (i.e., errors in the extraction of the subimages). Suppose we are using S = 2 scales and K = 3 orientations (i.e., S × K filters). Applying the filter bank on each of the 9 subwindows yields a feature vector of size 162, having the following form:
ming. The optimization criterion is the width of the margin between the classes. The discriminate hyperplane is defined as: l X yi ai k(x, xi ) + b (6) f (x) = i=1
where k(x, xi ) is a kernel function and the sign of f (x) indicates the membership of x. Constructing the optimal hyperplane is equivalent to find all the nonzero ai . Any data point xi corresponding to a nonzero ai is a support vector of the optimal hyperplane. Suitable kernel functions can be expressed as a dot product in some space and satisfy the Mercer’s condition [20]. By using different kernels, SVMs implement a variety of learning machines (e.g., a sigmoidal kernel corresponding to a two-layer sigmoidal neural network while a Gaussian kernel corresponding to a radial basis function (RBF) neural network). The Gaussian radial basis kernel is given by k(x, xi ) = exp(−
k x − x i k2 ) 2δ 2
[µ11 σ11 κ11 , µ12 σ12 κ12 · · · µ69 σ69 κ69 ]
(8)
We have experimented using the first two moments only. However, much better results were obtained when the third moment(skewness) was considered. C. Forming the Training Set The images used in our training set were collected in a driveway using Sony EVI-D30 camera. To ensure a good variety of data, the image collect program had been running on the daytime for a period of about 5 days. The training set contains subimages of Vehicle, Pedestrian and Other which were extracted semi-automatically from the data. A total of 336 Vehicle subimages, 192 Pedestrian subimages and 154 Other subimages were extracted. Due to different lighting conditions or shadows, there is some variability in the way the subimages were extracted. For example, certain subimages cover the whole Vehicle/Pedestrian, others cover the Vehicle/Pedestrian partially, and others contain the vehicle and some background (see Fig. 4). In [22], the subimages were aligned by wrapping the bumpers to approximately the same position for Vehicle detection. We have not attempted to align the data in our case since alignment requires detecting certain features on the vehicle accurately. Moreover, we believe that some variability in the extraction of the subimages can actually improve performance. Each subimage in the training was scaled to 64 × 64.
(7)
The Gaussian kernel is used in this study (i.e., our experiments have shown that the Gaussian kernel outperforms other kernels in the context of our application). B. Feature Extraction for Classification In this section we describe our Gabor feature extraction procedure. The input to the feature extraction subsystem are the hypothetical Vehicle/Pedestrian subimages extracted from the input images. Vehicle/Pedestrian contains strong edges and lines at different orientation and scales, information that is also captured by the Gabor features. The statistics of these features provide a compact and powerful representation for Vehicle/Pedestrian detection. Instead of extracting these statistics from the whole image, we collect them from several subwindows obtained by subimages. This provides robustness to errors in the hypothesis generation step. First, each subimage is scaled to a fixed size which is 64 × 64. Then, it is subdivided into 9 overlapping 32 × 32 subwindows. Assuming that each subimage consists of 16 16×16 patches (see Figure 3(c)), patches 1, 2, 5 and 6 comprise the first 32 × 32 subwindow, 2, 3, 6 and 7 the second, 5, 6, 9 and 10 the fourth, and so forth. The Gabor filters are then applied on each subwindow separately. The motivation for extracting – possibly redundant – Gabor features from several overlapping subwindows is to compensate for errors in the hypothesis generation step (e.g., subimages containing partially extracted Vehicle/Pedestrian or background information), making feature extraction more robust. The magnitudes of the Gabor filter responses are collected from each subwindow and represented by three moments: the mean µij , the standard deviation σij , and the skewness κij (i.e., i corresponds to the i-th filter and j to the j-th subwindow). Using moments implies that only the statistical properties of a group of pixels is taken into
Fig. 4. Subimages for training.
D. Classification SVMs are primarily two-class classifiers. The problem we are facing involves three classes: Pedestrian, Vehicles and Others. The “tournament” method can be used here. This method, essentially, needs three trained classifiers, each of which separates one of the three classes against the other two. To save processing time, we build only two SVMs classifiers in this application. One separates Vehicle against Pedestrian and Other, referred to as x = Cv (T ). The second is to separate Pedestrian against Vehicle and Other, 4
referred to as x = Cp (T ). T is the threat(intrusion) for verification and x is output of the classifier. Because we are only interested in detecting Pedestrian/Vehicle, building another classifier to separate Other is unnecessary. Given a hypothesized threat T generated from HG step, the classification is carried out by following the rule:
T hreat
=
(
V ehicle P edestrian Other
Cv (T ) > c & Cp (T ) < −c Cv (T ) < −c & Cp (T ) > c otherwise
will be sent to the server(security office), as well as the video frame. Fig. 6 shows an instance of the alert with the intrusion type (Vehicle), the general location about where it happens(in the observation area of Camera # 1) and bounding boxes specifying intrusion location in that frame (white bounding boxes for Vehicle and black boxes for Pedestrian). To evaluate the performance of the developed system, we have run it during the daytime over a period of several days. The system exhibits good performance under different illumination conditions. Some representation detection results are illustrated in Fig. 7 and 8. The built system is able to detect multiple presences of the same type of intrusions Fig.8.a, as well as different types Fig.8.b and d. Although, there is no group of pedestrians in our training data set, it still detected the group of two pedestrians as Pedestrian, see Fig.7.c, showing good generalization property. Although we haven’t tested it, the performance of the system is expected to degrade under some abnormal conditions, such as, raining, too little contrast between the Pedestrian/Vehicle and background, moving vehicles too close to each other, etc. The current system runs on two laptops(Pentium III 750MHZ, as the terminals) and one desktop(Pentium 200MHZ, as the server) at the speed of 2HZ. We can increase its speed dramatically even with our current computational power. However, a higher processing speed is not necessary in our application scenario - driveway monitoring, given Pedestrian/Vehicle is very slow.
(9)
where c ∈ [0 1) is a predefined threshold and used to adjust the system’s sensitivity. In order to evaluate the performance of the two-step surveillance system, tests were carried out under two scenarios: offline testing using the data described in Section IV-C, and online testing in realtime under unconstrained outdoor environment, addressed in Section V.
Fig. 5. Offline testing results
V. Experimental Results A. Off-line Testing For the off-line testing, we use three-fold cross-validation procedure and record the average error (ER), false positive (FP) and false negative (FN). Specifically, to train either of the two classifiers(Cp (T ) or Cv (T )), for instance Cv (T ), we split the training dataset randomly three times (Set1, Set2 and Set3) by keeping 50 out of the 336 Vehicle subimages, 25 out of the 192 Pedestrian and 25 out of the Other subimages for testing and all the rest for training. Therefore, each of the three data sets has 582 training subimages and 100 test subimages. The final results is illustrated in Fig. 5. The detection error rate of Cv (T ) is 5%, FP 3% and FN 2%. The detection rate achieved by Cp (T ) is slightly worse: ER 7%, FP 5% and FN 2%. One observation here is that the FP rate is higher than FN in both of the two classifiers, which may be due to the relatively small number of Other examples used for training. Given that the Other class is much larger than the Vehicle/Pedestrian class, it would make more sense to include much more Other examples in the training sets.
Fig. 6. Server display
VI. Conclusion and Future Work We have developed a distributed visual surveillance system, and the system demonstrates good performance under unconstrained outdoor environment. The basic structure of the system is a LAN, with server sitting in the security office and Camera Units distributed in different observation areas. The current system detects Vehicle/Pedestrian in the monitoring area. It can also be trained to detect other type of intrusions easily, because it is a trainable system. We have defined our own protocol to make the communication more efficient. The intrusion detection program consists of two steps: background subtraction based hypothesis generation and appearance-based hypothesis verification. The two-step strategy mitigates the difficulties faced by all background subtraction methods to appearance-based
B. On-line Testing As introduced in the Section II, this system is on a LAN. If any intrusion (Vehicle/Pedestrian) is detected, the alert 5
versity of Nevada, Reno under an Applied Research Initiative (ARI) grant, and in part by NSF under CRCD grant No.0088086. References [1] [2] (a)
(b) [3] [4]
[5] [6] (c)
(d)
[7]
Fig. 7. Vehicle/pedestrian detection using the developed surveillance system: single presence
[8] [9] [10] [11] [12]
(a)
(b) [13] [14]
[15] [16] (c)
(d) [17]
Fig. 8. Vehicle/pedestrian detection using the developed surveillance system: multiple presences [18]
hypothesis generation step. In the hypothesis generation step, powerful pattern classification approach, utilizing redundant statistical Gabor filter features and SVMs, can screen out the false hypotheses very easily. For future work, we plan to investigate more extensively the problem of information fusion from multiple cameras, lower the detection error, especially the FP using bootstrapping method, and upgrade the system with the capability of human activity recognition.
[19]
[20] [21] [22]
Acknowledgements: This research was supported by Ford Motor Company under grant No.2001332R, the Uni6
M. Yang, D. Kriegman and N. Ahuja, “Detection faces in images:a survey,” IEEE Transactions on Pattern Analysis and Machine Intelligence, vol. 24, no. 1, pp. 34–58, 2002. M. Oren C. Papageorgiou, P. Sinha, E. Osuma, and T. Poggio, “Pedestrain detection using wavelet templates,” IEEE Conf. on Computer Vision, pp. 193–199, 1997. B. Ozer and W. Wolf, “Human detection in compressed domain,” IEEE Conf. on Image Processing, 2001. I. Haritaoglu, D. Harwood and L. Davis, “ω 4 : Real time surveillance of people and their acticities,” IEEE Transactions on Pattern Analysis and Machine Intelligence, vol. 22, pp. 809–830, 2000. V. Philomin, R. Duraiswami and L. Davis, “Pedestrian tracking from a moving vehicle,” IEEE Intelligent Vehicles Symposium, pp. 350–355, 2000. G. Foresti, V. Murino, and C. Regazzoni, “Vehicle recognition and tracking from road image sequences,” IEEE Transactions on Vehicular Technology, vol. 48, no. 1, pp. 301–318, 1999. J. Ferryman, A. Worrall, G. Sullivan, and K. Baker, “A generic deformable model for vehicle recognition,” Proceedings of British Machine Vision Conference, pp. 127–136, 1995. D. Koller, J. Weber, J. Malik, “Robust multiple car tracking with occlusion reasoning,” Technical Report UCB/CSD-93-780, University of California at Berkeley, 1993. G. Sullivan, K. Baker and A. Worrall, “Model-based vehicle detection and classification using orthographic approximations,” Bristish Machine Vision Conference, pp. 695–704, 1996. Z. Sun, R. Miller, G. Bebis, and D. DiMeo, “A real-time precrash vehicle detection system,” The IEEE International Workshop on Application of Computer Vision, Dec., 2002. K. Toyama, B. Brumitt, J. Krumm, and B. Meyers, “Wallflower: Principles and practicle of background maintenance,” The IEEE International Conference on Computer Vision, 1999. O. Javed, K. Shafique and M. Shah, “A hierarchical approach to robust background subtraction using color and gradient information,” The IEEE International Workshop on Application of Computer Vision, Dec., 2002. N. Friedman and S. Russell, “Image segmentation in video sequences: a probabilistic approach,” Proc. Thirteenth Conf. on Uncertainty in Artificial Intelligence (UAI 97), 1997. J. Daugman, “Complete discrete 2-d gabor transforms by neural network for image analysis and compression,” IEEE Transactions on Acoustics, Speech, and Signal Processing, vol. 36, no. 7, pp. 1169–1179, 1988. T. Weldon, W. Higgins and D. Dunn, “Efficient gabor filter design for texture segmentation,” Pattern Recognition, vol. 29, no. 12, pp. 2005–2015, 1996. A. Jain and F. Farrokhnia, “Unsupervised texture segementation using gabor filters,” Pattern Recognition, vol. 23, pp. 1167–1186, 1991. Y. Hamamoto, S. Uchimura, M. Watanabe, T. Yasuda, Y. Mitani, and S. Tomota, “A gabor filter-based method for recognizing handwritten numerals,” Pattern Recognition, vol. 31, no.4, pp. 395–400, 1998. B. Manjunath and W. Ma, “Texture features for browsing and retrieval of image data,” IEEE Transactions on Pattern Analysis and Machine Intelligence, vol. 18, no. 8, pp. 837–842, 1996. P. Kuizinga, N. Petkov and S. Grigorescu, “Comparison of texture features based on gabor filters,” Proceedings of the 10th International Conference on Image Analysis and Processing, pp. 142–147, 1999. V. Vapnik, The Nature of Statistical Learning Theory. Springer Verlag, 1995. C. Burges, “Tutorial on support vector machines for pattern recognition,” Data Mining and Knowledge Discovery, vol. 2, no. 2, pp. 955–974, 1998. C. Papageorgiou and T. Poggio, “A trainable system for object detection,” International Journal of Computer Vision, vol. 38, no. 1, pp. 15–33, 2000.