A VR Platform for Field-scale Phenomena: An application to Fire Spread Experiments Alexandre Muzy
Frédéric Bosseur
Christophe Gouinaud
Nicolas Fauvet
SPE UMR CNRS 6134
Patrick Bourdot
University of Corsica
CNRS-LIMSI UPR 3251
Campus Grossetti, BP 52
ISIMA-LIMOS 13 Avenue des Landais 63170 Aubière, FRANCE +33 (0)473 405 041
Building 502bis, BP 133
20250 Corti, FRANCE
[email protected]
91403 Orsay, FRANCE
+33 (0)4 95 45 02 05
+33 (0)1 69 85 81 70
[email protected]
{muzy,fauvet,bourdot}@limsi.fr
ABSTRACT Digital computers are powerful tools for studying natural phenomena at large-scales. Nevertheless, custom-made methods have to be developed to digitalize, simulate and finally visualize these phenomena. First, the numerous data of the real-world have to be digitalized to be stored into a computer. Then, as dynamics of large-scale natural phenomena are usually not obvious to understand, computation-based simulation models have to be developed. Finally, Virtual Reality (VR) techniques are better than 3D visualization on conventional computer graphic displays to observe and manipulate real and large-scale data, to compare them with simulation ones. Consequently, in a first interdisciplinary effort, we present some new solutions to design a VR platform for the analysis and simulation of largescale phenomena. Original digitalization and visualization techniques (in an immersive environment) constitute the main contribution of this paper.
Keywords : 3D visualization, virtual reality, digitalization, fire spread experiments at field-scale.
1. Introduction Currently, computer science offers great possibilities to study dynamics of field-scale phenomena. After digitalized the numerous data of the real world can be stored, manipulated and visualized on computers. To do so, different specific methodologies are usually performed to chronologically achieve: (1) Data digitalization, (2) Simulation modeling, and (3) Data visualization. These tools are not able to account for other phenomena and difficult to modify when modeling objectives change. Our aim here is to define a generic methodology to deal with field-scale phenomena. Among complex natural phenomena at field-scale, fire spread can be considered as one of the more difficult to study. Understanding this phenomenon and its
consequences at field-scale remains a challenge for scientists from numerous disciplines (physics, computer engineering, mathematics, biology, etc.). In this paper, we make a first effort to develop an interdisciplinary and generic methodology. The different steps to be achieved from real world digitalization to 3D explorations in an immersive environment are described. An original technique for automatically digitalize experimental data (ground cover) is developed. Ground cover is identified from aerial pictures. For the visualization module design, terrain data (the static structure) have been separated from phenomenon data (the dynamic objects moving on the terrain). Efficient rendering techniques have been adapted to RV and separated too from data management. Both design separations allow to improve interface genericity. To present this methodology and the results obtained, the rest of this paper is organized as follows. In the next section the project description is fully resumed. Then, in Section 3, data digitalization of the fire spread experiment at field-scale is provided. After, in Section 4, the 3D visualization interface, the levels-of-detail handling and the visualization of fire spread experiments are presented. Conclusions and future research directions along this line of work are given in Section 5.
2. Project Description Two kinds of fire spread experiments, conducted in the island of Corsica, are considered here. The first one has been conducted on July 2nd, 2004, in the village of Santa Lucìa di Zonza, in plain [1]. The second one has been conducted on April 7th, 2005, in the mountains, on the plateau of Cuscionu, at an altitude of 5000 ft. Different measuring devices have been set by physicists to measure fire and climatic characteristics (fire power, wind velocity, humidity, etc.). Digital cameras recorded images of the fire to determine the front geometry. To organize a coherent competence chain between domain experts, three modules have been defined: 1.
The digital data: This module consists in discretizing the field characteristics using camera and satellite pictures (ground cover, humidity and fire front positions).
2.
The modular simulation model [2]: This module is used to implement a simulation model for predicting fire spread positions. It uses the experimental data from module (1).
3.
The 3D immersive visualization: This module aims to be an interface for the integration of digital and simulation data. A comparison between these data has to be achieved to validate a modeling approach. Moreover, as experimental data are numerous, 3D visualization and virtual reality enhance data understanding by easily choosing the data to visualize (fire fronts, front radiations, ground cover, etc.).
3. Data Digitalization Digitalization of experimental data can be done by hand or automated (from picture analysis). However, due to the size of the experiments, it is more convenient to determine the vegetation distribution and the fire front positions by picture analysis.
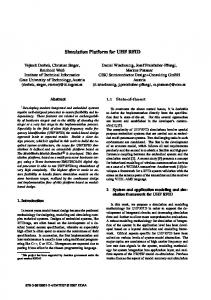
where Pi(x,y) is the pixel value at coordinate (x,y) of image i, Mi(j) is the mean of the j class for indexes i, dN is the pseudo distance function of the neighbor class of the pixel. This classification is iterated until a minor set of pixels change class. To obtain a faster convergence a simulated technique is used to allow misclassified pixels according to a time decreasing probability. The class centers are initialized with the crops and computed again at every iteration. The dN value contributes to obtain a more homogeneous classification without the need of a post treatment. The values of this term are selected, in a very close way of those of Markovian transition matrixes, i.e., according to neighboring classes. For this particular work a uniform set of values is used, proportional to the number of neighbors in the candidate class [5]. The obtained results are shown in Figure 2. One can see the good discrimination of the vegetation classes (essential for our application) from the rest of the land cover. The shrub class is correctly discriminated from the grass and forest class.
Fire front history of the experiment of Santa Lucìa di Zonza has been studied in [1]. Although a fully automated determination of fire front positions is preferable, this in situ survey will be worth to calibrate an automated determination. To study the spatial distribution of the vegetation on the parcel, the data coming from a site survey have been integrated into a Geographic Information System (GIS) [1]. The different layers have been scanned and georeferenced. From the Cuscionu experiment, different vegetation classes have been automatically determined from aerial images. These images can give a global vision of the experimental area. On the other hand, they require original interpretations because existing sensors have been designed for usual cartographic applications. They are not suitable to fire management issues. Particularly, classifications of land covers have to be achieved depending of fuelling properties. We propose here a classification schema to separate areas with specific burning capacities. Our classification scheme uses six classes: rocks, grassing zones, small vegetation, shrubs and forest. A supervised Markovian classification algorithm, optimized by simulated annealing, is used [3, 4]. The choice of the classes is guided by their capacity to propagate fire. Furthermore, these classes are representative of the land cover on Corsican mountains. Two rejection classes are used jointly for shadow and undetermined pixels.
Figure 2. Classification Schema for Classes: Rocks, Grassing Zones, Small Vegetations, Shrubs and Forest (represented in increasing grey levels).
4. 3D Immersive Visualization The 3D visualization module has to be easy to use and designed to easily account for changes in experimental configurations (cover and topography of terrains, fire front positions, etc.).
Altitude File SIMULATION Ground Cover Files
The algorithm we defined consists in: First, by human interpretation, to crop two small sets of pixels of each class in our image, Second, to compute derived images, called “indexes”, as first order statistics or Nagao filters for example, to obtained a new set of images that accurate the distance between classes, Last, in this set of images a multivariate classification based on distance dj is computed as follows.
d j (x , y ) =
n
∑ P ( x , y ) − M ( j ) + dN ( p( x , y ) ∈ j ) i
Simulated Front Files
GIS Experimental Front Files
Texture Files
VISUALIZATION
3D Pictures
Project File
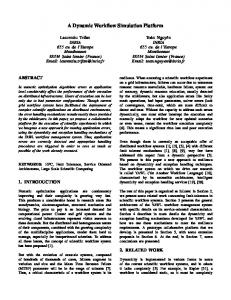
Figure 3. Simulation and Visualization Data Files
i
i =1
Figure 3 sketches the management of the input and output data files of the simulation and visualization modules. This kind of
management has also been achieved in [6]. Both Altitude File and Ground Cover Files are common to both simulation and visualization modules. The Altitude File corresponds to the height map of the experiment. The Ground Cover Files, are masks indicating ground cover types in space (rock, trees, shrubs and grass). Different kinds of trees and shrubs can be loaded. Experimental files are obtained from the previously mentioned digitalization. These files, as well as the Ground Cover Files, are masks stored as TIFF or TGA pictures. This allows to easily pre-visualize the repartition of each vegetation type on the ground, and the relative position of the fire fronts. It is also easier to turn these masks into textures. The Texture Files correspond to the aerial pictures and to the particular textures used for the representation of trees, shrubs, grass, etc. Finally, using a Project File, the Visualization interface generates a 3D view of the experiment at field-scale with the simulated and experimental fire fronts. The 3D visualization module has been implemented through Amira 3.1.1 [7] for terrain rendering, and through C++ code for data management. Amira is a well-designed tool for building scientific visualization applications to be run in immersive environments. Through the AmiraDev software development kit, modules (shared library) can be developed: to load data into Amira, to implement algorithms managing these data, and to visualize the data. The visualization modules are made using OpenInventor, which is a well-known scenegraph library using OpenGL. Terrain is a custom OpenInventor node we developed for fine control and real-time rendering.
Amira visualization module
HxData OpenInventor custom node
Renderer Amira reader module
uses uses Terrain
Amira data module
World 1
1
Ground
Sky
1
ProjectReader Specific to the 1..* phenomenon
FireFrontSet 1..*
GroundCover
1..*
GroundTopography
1..*
FireFront
Figure 4. UML Diagram of the 3D Visualizer The object-oriented design of the whole 3D visualizer is sketched through a Unified Modeling Language (UML) diagram in Figure 4. Loading and storage of the data have been separated from the rendering code. This allows to use Amira as well as whatever rendering code, for visualization. An Amira data reader module has been developed to load every file from a project file into an Amira data node (corresponding to the World class, derived from the HxData class, which is the basic building block). The Renderer class uses that World class, which aggregates the world digital data in a renderer-independent manner. The World data are turned into an OpenInventor custom
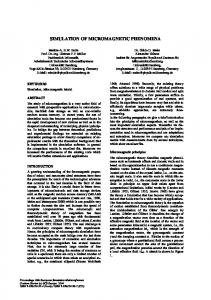
node containing a more “hardware-like” version of the world data (terrain vertices, vegetation billboards and textures). Except for the fire front classes, which are specific, classes of the 3D visualizer can be used to represent whatever natural environment. In order to achieve real-time rendering of large-scale terrains enclosing numerous trees, shrubs and grass, some optimizations must be brought to the visualization part. Lots of terrain rendering techniques have been developed over the past years [8-10]. However, these approaches have been developed for visualization on single desktop computers. Our aim here is to develop an immersive visualizer for fire spread experiments. People immerged in this kind of environments are not just facing data, they are surrounded by data. Hence, the idea is to reflect eyes’ perception by rendering more details where the user stares, and progressively less details as the geometry gets farther from the observer point of interest (angle relative to the looking direction). This approach is merged with a level of detail determination based on the distance from the user’s position. We determined three relevant levels of detail for the study of such a situation: first, the coarse view, showing a rough terrain with coarse colored texture layers that represent the vegetation and fire fronts (cf. Figure 6(a)). Then, a middle levelof-detail view of the terrain is provided with a semi-detailed terrain (cf. Figure 6(b)), and over the textured layers we add simple schematic trees and flames, in order to identify better the kind of mask the user is observing. The final level-of-detail shows the finest possible version of the terrain, and real vegetation and fire. From the first step of the simulation process, we know the density of each type of vegetation and the located temperatures of the fire. The terrain is rendered through a quadtree, in order to use classical but efficient frustum culling on every side of the virtual environment, as well as to bring polygon blocks at different levels-of-detail. The application gives the user the ability to choose which layers to display, as well as which simulation or experimental fire spread timestep to go to. Moreover, users can play and replay recorded experimental fire spread at a desired speed. The application is easy to use. Amira’s bindings to Qt have been used to develop the user interface. Simple push buttons or combo boxes have been designed (cf. Figure 6(a)) that are turned to floating menus once in immersive VR mode. Interactions with the terrain are achieved through a simple mouse in the Amira visualization window, or using any virtual reality pointing device in the immersive situation. Being able to replay a fire spread experiment from any point of view in virtual reality, is a real benefit for the study of such a phenomenon. Moreover, displaying different vegetation layers allows to observe precisely which kind of vegetation influences propagation. Finally, physicists can use this environment to validate their models, thus comparing experimental and simulated fire fronts.
(a)
(b)
Figure 6. (a) Snapshot of the Amira Application ; in Red is the Fire Spread. (b) Middle level-of-detail view.
5. Conclusion and Perspectives A complete methodology has been proposed to deal with fieldscale phenomena. Original and specific tools have been designed for digitalizing and visualizing (in an immersive environment) fire spread experiments. These tools have been developed through an interdisciplinary collaboration between simulation, visualization and digitalization experts. This methodology could be easily extended to other environmental or field-scale problems. Indeed, the shape of these problems is the natural environment. The latter, can be easily digitalized, simulated and observed through our methodology and our tools. However, environmental phenomena are so complex that they require very precise and specific technical solutions. This methodology is only a basis, which has to be improved according to the environmental phenomenon under consideration. Concerning fire spread, many interesting perspectives could be explored. For the automatic determination of vegetation characteristics, we aim to characterize the biomass and the hydrous stress of a land cover. To achieve this goal, SPOT-5 images can be coupled with aerial images. Then, the way we are handling the levels-of-detail can be extended to explore fire phenomena in details (e.g. gas flows). Lastly, RV interactions with the simulation could be achieved.
6. References [1] Rossi JL, Simeoni A, Santoni PA, Bosseur F, Morandini F, et al. 2005. Wind and vegetation effects on the dynamics of a fire spreading across an heterogeneous Mediterranean scrub. Presented at 4th Mediterranean Combustion Symposium, MCS4, Lisbon. Accepted for publication. [2] Muzy A, Innocenti E, Hill DRC, Aïello A, Santucci JF, Santoni PA. 2004. Dynamic structure cellular automata in a fire
spreading application. Presented at First International Conference on Informatics in Control, Automation and Robotics, Setubal, Portugal. 143-51. [3] Dubes RC, Jain AK. 1989. Random field models in image analysis. Journal of Applied Statistics 16: 131-64. [4] Rellier G, Descombes X, Falzon F, Zerubia J. 2004. Texture Feature Analysis Using a Gauss-Markov Model in Hyperspectral Image Classification. IEEE Trans. on Geoscience and Remote Sensing 42: 1543-51. [5] German D, Gidas B. 1991. Image Analysis and Computer Vision. USA: National Academy Press. [6] Joubert M, Bresson R. 2004. Conception et réalisation d'un module de visualisation graphique 3D de feux de forêts, Technical report, Institut Supérieur d'Informatique de Modélisation et de leurs Applications (ISIMA), ClermontFerrand. [7] Amira. Advanced 3D Visualization and Volume Modeling. San Diego, CA: Template Graphics Software Inc. [http://www.amiravis.com/]. [8] Losasso F, Hoppe H. 2004. Geometry clipmaps: Terrain rendering using nested regular grids. Presented at SIGGRAPH, Los Angeles, USA. 769-76. [9] Lindstrom P, Koller D, Ribarsky W, Hodges LF, Faust N, Turner GA. 1996. Real-Time, Continuous Level of Detail Rendering of Height Fields. Presented at SIGGRAPH, New Orleans, USA. 109-18. [10] Duchaineau M, Wolinsky M, Sigeti DE, Miller MC, Aldrich C, Mineev-Weinstein MB. 1997. ROAMing terrain: realtime optimally adapting meshes. Presented at IEEE Visualization, Phoenix, USA. 81-8.