A Wearable Computing Platform for Developing Cloud-based Machine Learning Models for Health Monitoring Applications Shyamal Patel, Member, IEEE, Ryan S. McGinnis, Member, IEEE, Ikaro Silva, Steve DiCristofaro, Nikhil Mahadevan, Elise Jortberg, Jaime Franco, Albert Martin, Joseph Lust, Milan Raj, Bryan McGrane, Paolo DePetrillo, AJ Aranyosi, Melissa Ceruolo, Jesus Pindado and Roozbeh Ghaffari
Abstract— Wearable sensors have the potential to enable clinical-grade ambulatory health monitoring outside the clinic. Technological advances have enabled development of devices that can measure vital signs with great precision and significant progress has been made towards extracting clinically meaningful information from these devices in research studies. However, translating measurement accuracies achieved in the controlled settings such as the lab and clinic to unconstrained environments such as the home remains a challenge. In this paper, we present a novel wearable computing platform for unobtrusive collection of labeled datasets and a new paradigm for continuous development, deployment and evaluation of machine learning models to ensure robust model performance as we transition from the lab to home. Using this system, we train activity classification models across two studies and track changes in model performance as we go from constrained to unconstrained settings.
I. INTRODUCTION Techniques from the field of machine learning are increasingly being applied to problems of detection, classification and prediction in biomedicine [1]. This is particularly true in the case of wearable sensors that measure motion and bio-potentials for monitoring human health [2]. Wearable sensors [3] are a new class of devices that enable continuous health monitoring in the home and community settings. Their applications include detections of events like falls [4], seizures [5] and cardiac abnormalities [6], and tracking changes in symptoms or impairments in response to interventions [7]. Many of these applications rely on machine leaning algorithms for modeling the relationship between sensor data and meaningful measures of health (e.g. severity of tremor or occurrence of arrhythmias). The typical approach for developing machine learning models is to conduct clinical studies to collect labeled data in a controlled setting (e.g. lab or clinic) from a small group of individuals belonging to the target cohort. This approach allows collection of high quality datasets but suffers from several limitations. While these datasets provide a good starting point for model development, they might not accurately represent what happens in unconstrained settings like the home. Such differences could be attributed to factors such as presence of noise (e.g. motion artifacts in ECG signal [8]) and influence of supervision on patients (e.g. S. Patel, R. S. McGinnis, I. Silva, S. DiCristofaro, N. Mahadevan, E. Jortberg, J. Franco, A. Martin, J. Lust, M. Raj, B. McGrane, P. DePetrillo, A. J. Aranyosi, M. Ceruolo,, J. Pindado and R. Ghaffari are with MC10, Inc, Lexington, MA USA (phone: 202-509-5783; e-mail:
[email protected]).
978-1-4577-0220-4/16/$31.00 ©2016 IEEE
white coat effect [9]). Data collection is also limited to short durations, yielding a limited number of observations for training and testing the models, which may limit generalizability. As a result, models and algorithms developed on such datasets may experience a significant drop in accuracy when applied in real world conditions [10]. In this paper, we introduce an end-to-end wearable computing platform for rapid development and deployment of cloud-based machine learning models for extracting meaningful indicators of human health from wearable sensor data. The proposed platform enables collection of highquality labeled datasets in supervised (e.g. lab, clinic) and unsupervised (e.g. home) settings as well as development and deployment of machine learning models in the cloud. We apply this platform to the problem of human activity recognition and present results that demonstrate limitations of models developed on data gathered under constrained conditions. We propose a new paradigm under which trained models are continuously evaluated as more labeled data becomes available, and periodically trained to achieve desired performance on wearable sensor data gathered under real-world conditions.
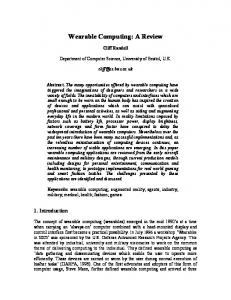
Figure 1. The BioStamp™ sensor.
II. WEARABLE COMPUTING PLATFORM A. BioStampRC™ System The BioStampRC™ system has been designed to accelerate wearable technology research and development by simplifying the path from problem definition, through study design and data collection, to analysis. The system has three main components: (1) BioStamp™ sensor (Fig. 1), (2) Investigator portal, and (3) Investigator application. The BioStamp™ sensor, shown in Fig. 1, is a thin (~0.3cm), flexible and stretchable patch that collocates motion (accelerometer and gyroscope) and surface
5997
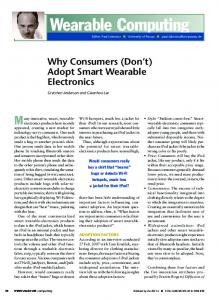
Figure 2. A block diagram of the cloud-based machine-learning pipeline for training models and evaluating their performance. Pre-calculated features are loaded from the cloud database and trained models are saved back to the cloud.
electrophysiological (ECG/EMG) sensors in a waterproof package complete with rechargeable 15mAh lithium polymer battery, 32MB of flash memory (data storage), and ® Bluetooth Low Energy radio (wireless communication). Detailed specifications of the sensor settings are provided in table I. The form factor of the BioStampTM allows it to be worn comfortably at virtually any location on the human body, held in place by a disposable double-sided adhesive, enabling the collection of rich datasets that were previously not possible due to limitations of existing measurement solutions. TABLE I. BIOSTAMP™ SENSOR SETTINGS Sensor Accelerometer
Range
Resolution
Sampling Rate
± 8G
10 mG
50-200 Hz ± 10%
Gyroscope
± 2000 °/s
0.2 °/s
25-250 Hz ± 10%
Electrodes
± 200 mV
0.006 mV
125-250 Hz ± 10%
The Investigator portal is a web-based dashboard, which enables interactive design of study protocols, configuration (e.g. body placement, sampling rate, sensing modality) of sensors and definition of study activities. The Investigator application (Fig. 3) runs on a tablet computer and enables sensor assignment, visualization of live sensor data, administration of study activities and upload of data and annotations to MC10’s cloud infrastructure. Configuration of the Investigator application automatically changes based on changes made to the study design in the Investigator portal. Raw sensor data uploaded by the Investigator application can be visualized and downloaded from the Investigator portal. These features of the BioStampRC™ system enable generation of labeled datasets in controlled, supervised environments (e.g. the lab or clinic) as well as in uncontrolled, unsupervised environments (e.g. the home) and, with immediate availability for processing and analysis via cloud-based data storage. B. Machine Learning Pipeline Labeled datasets, like those generated by the BioStampRCTM system, can be used, in a supervised learning framework, to develop models for translating sensor
data into desired outputs. The cloud-based machine-learning pipeline, enables rapid development and deployment of these models by collocating the data storage and model development environments. A block diagram outlining the main processing steps of the machine-learning pipeline is shown in Fig. 2. Each step in the pipeline can be configured to allow the user full control over how the final model is trained and evaluated. Training and testing sets can be created by specifying a percentage split across the subject pool or by specifying exact subject IDs to be included in the training and testing datasets. Datasets can be created by combining data across multiple studies with common sensor locations. Based on the specification of training and testing datasets, pre-calculated features are loaded into the pipeline and feature selection is performed using the specified feature selection method. The selected features are then used for training multiple models by varying the parameters (e.g. kernel type, number of trees) and/or model types (e.g. SVM, Random Forest) and selecting the best performing model in cross-validation. Performance of the selected model is then evaluated on the testing dataset and reported in the output of the pipeline. In the last step, the pipeline uses the full dataset to train the final model that can now be saved and deployed in the cloud for processing incoming sensor data. The cloud-based implementation of the pipeline enables us to train, evaluate and deploy models continuously and track changes in model performance over time to identify potential issues (e.g. skewed distribution of observations) that could compromise performance. III. METHODS A. Study Design We designed two studies with the aim of collecting labeled accelerometer data during the performance of activities of daily living (ADLs). ADLs included resting activities like sitting, standing and lying as well as moving activities like walking, stair climbing and biking. The first study (Study A) involved performance of ADLs according to
5998
(a)
(c)
(b)
(d)
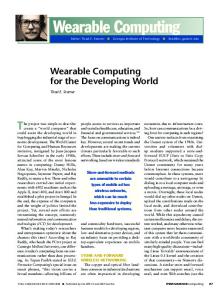
Figure 3. An illustration of sensor locations on the body (a) and screen shots of the Investigator application showing instructions for administering study activities (b), tracking duration of activity annotation (c) and providing labels upon completion of activities (d).
study definitions under supervision of the administrator whereas in the second study (Study B), subjects performed activities in an unconstrained manner. B. Instrumentation As illustrated in Fig. 3 (a), subjects were instrumented with three BioStamp™ sensors placed at the medial chest, anterior forearm (dominant side) and anterior thigh (dominant side) locations. All sensors were configured to record accelerometer data (range: ±4g, sampling rate: 50Hz) to the on-board flash memory. The Investigator app (Fig. 3bd) was used to configure the sensors and administer protocol activities. C. Subjects Subjects were recruited from a normative population of MC10 employees. Thirty (22 males, 8 females, 27.4 ± 7 years) subjects were enrolled in Study A and ten (6 males, 4 females, 31.4 ± 9.6 years) subjects were enrolled in Study B. All subjects were healthy adults with no known gait or balance impairments. D. Experimental Protocol After obtaining consent, subjects were assigned a unique subject ID and instrumented with BioStamp™ sensors using the Investigator application. Subjects were then instructed to perform a set of standardized activities in a pre-determined sequence. Subjects started with a quick posture calibration, which required standing still in an upright posture for approximately 10s. In Study A, posture calibration was followed by subjects performing walking, sitting in a chair, standing up, lying supine and riding a stationary bike for a duration of at least 2 minutes per activity. In Study B, subjects performed additional activities like washing dishes, folding clothes and stair climbing. The Investigator application was used to annotate the beginning and end of each activity, collect activity specific labels (e.g. number of steps and pace for walking) and upload raw data from the sensors to the cloud following completion of the study activities. In Study A, subjects performed activities as prescribed (e.g. constant walking pace, stationary activities with limited or no movement) whereas in study B, activities were performed as per the subject’s preference (e.g. walking
at variable pace over different surfaces and with turns, stationary activities with limb movements). D. Activity Classification The activity classification process begins by preprocessing the raw accelerometer data and extracting signal features. Specifically, an elliptic low-pass filter with a 12Hz cutoff frequency was used to pre-process data for features that required preservation of the accelerometer’s gravity component, and an elliptic band-pass filter with a 0.5-12Hz cutoff frequency was used to pre-process data for features that did not. In order to remove dependence on sensor orientation, features were extracted from only two streams of raw data: (1) Z-axis (orthogonal to the body surface) and (2) the vector magnitude of the X-axis and Y-axis. A 5-second window was used to extract a set of 17 time and frequency domain features [11]. The time domain features include mean value, root mean square value, signal entropy, crosscorrelation coefficient at zero-lag, rate of slope sign change and range ratio. The frequency domain features include spectral entropy, dominant frequency value, dominant frequency magnitude and ratio of energy in the dominant frequency to the signal energy. A total of 31 features were extracted from each sensor for a total of 93 features across the three sensors used in these studies. We then used the machine-learning pipeline described earlier (Fig. 2) to train binary classification models for each activity type using features extracted from all three sensors. Based on earlier works [12], we use a Random Forest classifier [13] for training the activity classification models. Number of trees parameter for the random forest classifier was selected by performing a grid search (5, 10, 20, 50 and 100 trees) with a 5-fold cross-validation. In order to train activity models, we first created a mapping between protocol activities and ADLs of interest. Protocol activities were mapped to sitting (sitting, folding clothes), standing (standing, washing dishes), lying (supine, prone, right, left), walking (treadmill walking, over ground walking) and other (biking, stair climbing). In addition, we created resting and moving activity states. Sitting, standing and lying activities were pooled under resting state whereas walking and other activities were pooled under moving state. Activity state
5999
TABLE II. MODEL PERFORMANCE WITHIN AND ACROSS STUDY A AND STUDY B Model
Precision
Recall
F1 score
AA
AB
A+B B
AA
AB
A+B B
AA
AB
A+B B
Sitting
0.99
0.28
1.00
0.98
1.00
1.00
0.99
0.43
1.00
Standing
0.86
0.59
0.89
1.00
0.96
0.99
0.92
0.73
0.94
Lying
1.00
1.00
0.99
0.98
0.67
0.99
0.99
0.80
0.99
Walking
1.00
1.00
1.00
0.86
0.73
0.92
0.93
0.85
0.96
Other
1.00
1.00
1.00
1.00
0.32
0.91
1.00
0.48
0.95
Resting
1.00
1.00
1.00
0.99
0.92
0.98
0.99
0.96
0.99
classification was implemented by training a single binary model for classification of resting and moving activities. E. Performance Evaluation Performance of the binary models trained to classify each activity was evaluated by testing on an out of sample testing set. For each observation in the testing set, the trained binary activity models provided an estimate of class probability score between 0 and 1. The predicted activity was chosen as the activity model with the highest class probability score. The predictions were accumulated in a confusion matrix and standard measures (accuracy, precision, recall and F1 score) of model performance were derived. IV. RESULTS We started by training and evaluating activity model performance on data from Study A. Subjects from Study A were randomly partitioned with a 50-50 split to create training (N=9) and testing (N=9) sets. Table II shows the performance of the trained activity models on testing set (AA). Across the board, all binary activity models were able to achieve good activity recognition performance (average precision, recall and F1 score > 0.96) with an overall activity recognition accuracy of 96.44% and resting state model accuracy of 99.24%. Standing and walking models were the main source of misclassifications with 14% (walking recall = 0.86) of walking instances being misclassified as standing. The trained models from Study A were then used to perform activity recognition on 50% (N=5) of data from Study B. We can notice a significant drop in the values of the performance metrics shown in table II (AB) with the overall activity recognition accuracy dropping to 72.45% and a slight drop in resting model accuracy to 96%. The main sources of classification error were lying, walking and other being misclassified as either sitting or standing. Walking was misclassified as standing 26% of the time, a significant increase from 14% reported earlier. Lying was misclassified as sitting 22% of the time, and as standing 10% of the time. This drop in performance can be attributed mainly to the relaxed protocol of Study B, where subjects performed activities according to their own preferences. We then trained the activity recognition models by adding 50% (N=5) of data from Study B into the training set along with 50% (N=10) of data from Study A to create a combined training set. The performance of the resulting models on the remaining 50% (N=5) of data from Study B is shown in table II (A+BB). We can notice a significant improvement
in the values of the performance metrics with average values of precision, recall and f1-score greater than 0.97. The overall accuracy of the models trained on the combined dataset increased to 97.16%, which is slightly better than the accuracy of the original models trained and tested on data from only Study A. The resting state model accuracy decreased slightly to 98.83%. V. DISCUSSION The results demonstrate limitations of models trained on data collected in a constrained setting. We observed a significant drop in accuracy (96.44% to 72.45%) when models trained on constrained data from Study A were used to perform activity classification on data from Study B. This drop in accuracy can largely be attributed to the fact that subjects in Study B performed activities without following the strict prescription of Study A. We demonstrate that, by including a portion of the unconstrained dataset in the training set, we were able to achieve a significant increase in model accuracy (72.45% to 97.16%) on the same testing set. The resulting models are able to generalize better and will lead to more accurate characterization of activities performed during daily life. The final trained binary models were configured in a hierarchical tree (Fig. 4) and deployed on the cloud to process and classify streaming sensor data. At the first level of the hierarchy, observations are classified into either a resting or moving state. If an observation’s state is classified as resting (or moving), class probabilities are calculated for sitting, standing and lying (or walking and other) models and the observation is assigned to the activity with the highest
Figure 4. Hierarchical configuration of the binary activity classification models for activity recognition. Activities are first classified as either Resting or Moving. Resting activities are then further classified as either Lying, Sitting or Standing and Moving activities are classified as either Walking or Other.
probability. In Fig. 4, we can see how a new dataset with
6000
Figure 5. A plot of activity classification accuracy for each new subject as a function of the number of subjects included in the training set.
‘Free Walking’ activity label is classified by the hierarchical configuration of trained models. The cloud-based machine learning pipeline presented in this paper enables continuous evaluation and update of models as more data becomes available. Fig. 5 illustrates this aspect of the system by plotting classification accuracy of the hierarchical tree on each new subject as a function of the amount of data available for training binary models. As data from more subjects becomes available in Study A, accuracy improves from 38.62% for the first subject to 100% for the last subject. However, when models trained on data from Study A are applied to the first subject from Study B, classification accuracy drops to 72.16% due to the unconstrained nature of activities. As more subjects from Study B are added to the training pool, the accuracy increases to levels achieved in Study A. We believe that this paradigm can facilitate translation of health monitoring with wearable sensors from the lab to home by tracking changes in model performance and allowing periodic retraining to account for new patterns.
REFERENCES [1] [2] [3] [4]
[5]
[6]
[7]
VI. CONCLUSION In this paper, we present a novel wearable computing platform that enables rapid end-to-end development of machine learning models for extracting meaningful healthrelated information from data collected using wearable sensors. The machine learning pipeline presented herein enables continuous tracking of model performance on new labeled datasets and, when degradation in performance is observed, retraining of the models to ensure desired accuracy. This approach has the potential to become particularly important as we begin to deploy models, developed on data collected during studies performed in environments like the lab and clinic, in unconstrained environments like the home, where collection of labeled data is challenging. We demonstrate this by applying the proposed platform for training activity classification models based on data gathered across two studies. The results presented herein highlight the limitations of developing machine-learning models based on data collected in constrained settings and illustrate the need for continuous evaluation and periodic retraining of such models to ensure that desired performance is achieved.
[8]
[9] [10]
[11]
[12]
[13]
6001
P. Sajda, “Machine learning for detection and diagnosis of disease.,” Annu Rev Biomed Eng, vol. 8, pp. 537–565, 2006. H. Banaee, M. U. Ahmed, and A. Loutfi, “Data mining for wearable sensors in health monitoring systems: a review of recent trends and challenges.,” Sensors, vol. 13, no. 12, pp. 17472–17500, 2013. A. Pantelopoulos and N. G. Bourbakis, “A Survey on Wearable Sensor-Based Systems for Health Monitoring and Prognosis,” IEEE Trans. Syst., Man, Cybern. C, vol. 40, no. 1, pp. 1–12, Jun. 2010. A. K. Bourke, P. van de Ven, M. Gamble, R. O’Connor, K. Murphy, E. Bogan, E. McQuade, P. Finucane, G. ÓLaighin, and J. Nelson, “Evaluation of waist-mounted tri-axial accelerometer based falldetection algorithms during scripted and continuous unscripted activities.,” J Biomech, vol. 43, no. 15, pp. 3051–3057, Nov. 2010. T. M. E. Nijsen, P. J. M. Cluitmans, J. B. A. M. Arends, and P. A. M. Griep, “Detection of subtle nocturnal motor activity from 3-D accelerometry recordings in epilepsy patients.,” IEEE Trans. Biomed. Eng., vol. 54, no. 11, pp. 2073–2081, Nov. 2007. C.-T. Lin, K.-C. Chang, C.-L. Lin, C.-C. Chiang, S.-W. Lu, S.-S. Chang, B.-S. Lin, H.-Y. Liang, R.-J. Chen, Y.-T. Lee, and L.-W. Ko, “An intelligent telecardiology system using a wearable and wireless ECG to detect atrial fibrillation.,” IEEE Trans Inf Technol Biomed, vol. 14, no. 3, pp. 726–733, May 2010. S. Patel, H. Park, P. Bonato, L. Chan, and M. Rodgers, “A review of wearable sensors and systems with application in rehabilitation.,” J Neuroeng Rehabil, vol. 9, no. 1, p. 21, 2012. T. Berset, D. Geng, and I. Romero, “An optimized DSP implementation of adaptive filtering and ICA for motion artifact reduction in ambulatory ECG monitoring.,” Conf Proc IEEE Eng Med Biol Soc, vol. 2012, pp. 6496–6499, 2012. T. G. Pickering, W. Gerin, and A. R. Schwartz, “What is the whitecoat effect and how should it be measured?,” Blood Press Monit, vol. 7, no. 6, pp. 293–300, Dec. 2002. F. Bagalà, C. Becker, A. Cappello, L. Chiari, K. Aminian, J. M. Hausdorff, W. Zijlstra, and J. Klenk, “Evaluation of AccelerometerBased Fall Detection Algorithms on Real-World Falls,” PLoS ONE, vol. 7, no. 5, p. e37062, May 2012. S. J. Preece, J. Y. Goulermas, L. P. Kenney, and D. Howard, “A comparison of feature extraction methods for the classification of dynamic activities from accelerometer data,” IEEE Trans. Biomed. Eng., vol. 56, no. 3, pp. 871–879, 2009. H. Gjoreski, M. Lustrek, and M. Gams, “Accelerometer Placement for Posture Recognition and Fall Detection,” presented at the 2011 7th International Conference on Intelligent Environments (IE), 2011, pp. 47–54. L. Breiman, “Random Forests,” Machine Learning, vol. 45, pp. 5–32, 2001.