software for diffusing information such as GIS or web-based applications do not ... technology has allowed the development of numerous web sites dedicated to ...
Geoinformatics 2004 Proc. 12th Int. Conf. on Geoinformatics − Geospatial Information Research: Bridging the Pacific and Atlantic University of Gävle, Sweden, 7-9 June 2004
A WEB-BASED MULTIMEDIA FRAMEWORK FOR DIFFUSING SPATIO-TEMPORAL INFORMATION: APPLICATION TO NATURAL HAZARDS P-A. Davoine, J. Gensel and H. Martin Laboratory LSR-IMAG, BP 72, 38 400 Saint-Martin d’Hères, France, {nom.prenom}@imag.fr, Tel: +33476827257, Fax: +33 4 76 82 72 87
Abstract The management of natural risks is a multifaceted process based on spatial, phenomenological, temporal and historical approaches. Information used in this context is thus complex, multidimensional, multimedia (texts, sounds, videos, pictures might be combined), semi-structured, heterogeneous, incomplete and discontinuous. Current software for diffusing information such as GIS or web-based applications do not yet handle all these dimensions in a generic way. Still, it is necessary to develop specific application. In this paper, we present the principles and the methodology of a web-based multimedia framework for diffusing spatio-temporal multimedia information. We describe two applications generated with this framework: the SPHERE project dedicated to flood prevention, and the SIDIRA project dedicated to avalanche risks. INTRODUCTION Diffusion of information is a privileged axis in the prevention of natural risks. The objective is to render information better shared by scientists, better used by professional and better understood by the general public. Today, the Web constitutes a popular infrastructure to diffuse largely and restrictively as well information over the Internet. This technology has allowed the development of numerous web sites dedicated to the prevention of natural risks. Many of them make use of cartographic tools and offer interactive maps. If the spatial criterion prevails when considering naturals risks, it is also important to consider information in these phenomenological and temporal aspects. Also, information used is by essence multimedia since pictures, oral accounts, videos, texts or maps are often used for analyzing phenomena. However, existing Web sites do not take into account these different aspects. To answer this problem, we propose a framework for the design and the generation of Web-based Geographic Information Systems. GIS generated with this tool rely on the following principles: i) information retrieval is performed in a simple and intuitive way, ii) the main dimensions of information are presented dynamically and simultaneously, iii) delivered information is adapted to the end-user according to his/her profile (scientist, professional, general public) both in terms of content and presentation. The paper is organized as follows: first, we explain why information about natural risks is spatio-temporal multimedia information. Then, the study of the existing applications concerning these problems, leads us to define the principles of a framework for designing and generating multi-dimensional web-based GIS . Finally, we present two applications generated with this framework for diffusing information on natural risks: the SPHERE project dedicated to flood prevention and the SIDIRA project dedicated to avalanche risks. 149
P-A. Davoine, J. Gensel and H. Martin
NATURAL HAZARDS INFORMATION MULTIMEDIA INFORMATION
AS
SPATIO-TEMPORAL
AND
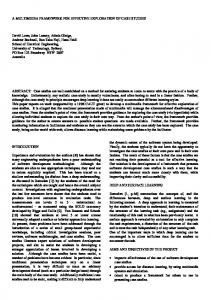
The stakes of the diffusion of information about natural risks The natural risks management can be organized in several stages: forecast, prevention, and intervention (Dauphine, 2001). Before the catastrophe, concerned actors deploy methodologies or tools of forecast, which aim at announcing dangers. The prevention consists in anticipating the consequences of catastrophes and reducing damages they can cause. Diffusion of information is a privileged axis in the prevention of natural risks. Scientists use information according to probabilistic, modeling and simulative approaches. For that, they use statistical data (quantitative or qualitative data) extracted from a sample of selected events. This approach concerns specifically the physical study of the phenomena. Often, in order to increase both the quantity and quality of their analysis, they use also some information resulting from historical investigations. The history of risks is considered less rational than scientist studies. However, this kind of information can be useful to confirm (or infirm) the results of a simulation or/and a modeling process. Technicians use information about natural risks in order to conceive management scenarios. For that, they use GIS as decision-making tools. Quantitative, qualitative or historical information could be helpful technicians. However, integration of the factual and historical information about natural risks in a GIS is a method seldom used in practice. Existing GIS software are not adapted to the handling of this type of information which is very specific. Specificities of information about natural risks Usually, information for the natural risks is better known in its space dimension (location of avalanche, extension of the flood…) or in its phenomenological dimension (elevation and type of avalanche, damage…), that in its temporal and historical dimensions. Concerning natural risks, the temporal dimension is a very important element of knowledge and has to be associated with spatial dimension. Important questions involving time could be: where are located the avalanches that occurred usually in the morning before twelve o’clock? Which was the duration of the rise of water? Which are the places that were flooded in less than three hours by the flood of 1800?, etc. Historical information is mainly collected from researches in archives performed by historians in collaboration with earth science specialists. Their first task is to collect and to list the most relevant past events (floods, avalanches, rock falls). Then, they complete this work by describing phenomenological aspects of these events and adding information about their historical and spatial contexts. This task requires a long and tiny analysis of historical documents like texts, maps and reports. The historical information can be defined by the set of information elements allowing to describe and to analyze a major past event. This set comprises quantitative data like dates or measures and / or qualitative data like the type or the intensity of the phenomenon or the caused damages. It also comprises documents associated with the phenomenon (oral accounts, photos, graphics, etc.) that must be available in order to allow further analysis. To get a global comprehension of past events implies to take into account all the dimensions of information used: description of event, documentary sources, critical analysis of these sources and their contents... (Figure 1). Providing information about the methods and steps chosen by the scientist is a means to check the validity and the quality of the information and can help in understanding her/his analysis. 150
A web-based multimedia framework for diffusing spatio-temporal information: application to natural hazards
T ext s M ap s Grap h ics, P ict ures ...
D o cumentary referen ces
Sp at ial referen ces
L ocat io n E xt en sio n T raject ory
Event s
In dicato rs A n aly sis Sy n th esis
Ph en om eno lo gical descript io n
T em po ral referen ces
D ates P erio d Interv al D urat ion s
Figure 1: The different dimensions of information about natural risks. An event (flood, avalanche, forest fire, earthquake, etc.) can be seen from different points of view.
WEB AND MULTI-MEDIA TECHNOLOGIES: TOOLS FOR THE DIFFUSION OF INFORMATION ABOUT THE NATURAL RISKS The stake of the diffusion of information on the natural risks, together with the development of Web and multimedia technologies have contributed to the multiplication of various types of tools. Existing web applications can be distinguished by the dimension of information they put the emphasis on, or by the data-processing methodology they use. Web sites for diffusing information about natural risks. A comparative study of the most popular Web sites dedicated to natural hazards (Arnaud 2003.) shows the importance of the cartographical format as a vector of diffusion of information. More and more, appearing Web sites use various interactive maps (simple and thematic maps or synthesis maps). The user can get more information by clicking in the map on hypertext links: texts, maps, graphics or table of indicators. When a Web site provides temporal or/and historical information, it is displayed either in a textual (for historical information) or in tabular (for temporal information) format. Some hypertext links give access to static graphs which complete temporal dimension. In this case, spatial dimension is omitted. The phenomenological information is quite wellstructured and well-presented, but no access to the documentary sources is possible. This drawback does not make it possible to put in perspective the events in their historical context. None of the consulted Web sites integrates in a dynamic and simultaneous way the various dimensions of information about natural risks we have considered above: spatial, temporal, phenomenological and documentary dimensions. Few of them has functionalities of spatial and temporal queries and multi-dimensionally interrogation and visualization. Data-processing methodologies Simplest Web sites are composed of static Web pages of presentation. But with the evolution of technologies, it is now possible for a Web server to generate dynamic pages whose content is made of information extracted from relational databases. Some of these dynamic Web sites offers interactive cartography, or web mapping, through which information is presented in a spatial context. The majority of the SIG software publishers propose modules allowing this kind of functionalities. Today, Mapserver can be considered as the leader freeware for developing applications for diffusing spatial information. Some Web applications, called interactive Web-GIS are more complex. This kind of application offers many functionalities allowing to visualize but also to integrate, modify, 151
P-A. Davoine, J. Gensel and H. Martin
or delete information. Carto-Web is an example of interactive Web-GIS (Philipona, 2004). It is composed of 2 modules: a module of visualization of spatial information with the possibility of making spatial queries; a module of acquisition and edition of the geographical objects directly through a Web browser via a Java applet. Carto-Web has been implemented in PHP (a programming language for the development of dynamic Web sites) and uses Mapserver as a map engine, PostgreSQL and PostGIS as geographic data bases. Today, software solutions for the diffusion of spatial information are increasingly powerful and offer the possibility to integrate multi-media dimension (Carthwrigt et al., 1999). However, these tools are not very well adapted to integrate and manage temporal dimension. And we found it necessary to design and develop an environment, able to manage and to visualize some spatio-temporal multimedia information. TOWARDS THE SPECIFICATION OF MULTIMEDIA INFORMATION SYSTEM
A
NEW
SPATIO-TEMPORAL
Concepts The concepts, which underlie the design of a spatio-temporal multimedia information system, are based on the following observations: -
The integration of spatial data, as the basic functionality of a geographical information system, should not be occulted: superposition of geographical layers, processing of simple and complex spatial queries, cartographic visualization. However, since spatial information can be defined according to different geographical and cartographical scales, its visualization must be carried out at various levels of space granularity.
-
These spatial data being associated temporal data, the objective is to visualize them in a synthetic way, and to formulate temporal requests, but also spatio-temporal requests. This requires to handle different levels of temporal granularity.
-
Each dimension (space, temporal, documentary and phenomenological), being considered at the same level of interest, its visualization should not be made at the detriment of the others.
-
The tool should integrate the existing interactions between the different dimensions.
Thus, visualization appears to be one of the fundamental aspects in the design of a environment for diffusing spatio-temporal referenced multimedia information. This is why we propose to develop a convivial interface simultaneously processing queries involving several dimensions. This interface rests on the following concepts:
152
-
An interactive cartography
-
A multi-dimensional and interactive interface: the interface is structured in three interactive frames, each of them representing one dimension of spatio-temporal referenced multimedia information: one spatial frame, one temporal frame and one informational frame.
-
A multi-scaling visual and textual query system based on the successive reductions of the information space according to the requests carried out and to the privileged dimension. The information space can be temporal, spatial and/or spatio-temporal.
A web-based multimedia framework for diffusing spatio-temporal information: application to natural hazards
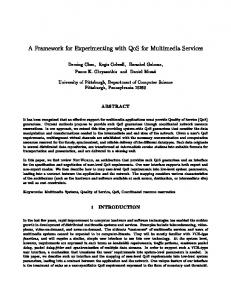
A multi-dimensional and interactive interface Each frame constituting the consulting interface has some functionalities of interrogation and visualization. Since the frames are interactive and synchronized, selected information can be visualized at the same time in a spatial, temporal or documentary context. User can zoom, pan or access to specific information in the chosen context using pop-up menus (Figure 2). Tools bar
Spatial Frame
Informative Frame
Hypertext links
Temporal Frame
Figure 2: An interactive and multi-dimensional interface for a Web-based multimedia spatio-temporal referenced information system: the SPHERE application.
The spatial frame displays several geo-referenced geographical layers, which are modeled in vector or raster format. Geographical information is made of surface, linear, and point objects. Spatial aggregations together with cartographic representation apply at different geographic scales. The temporal frame displays the distribution of the historical events (for instance avalanches or floods in the context of a GIS dedicated to risk prevention) handled by the information system according to the selected period and criteria. Various temporal representations are proposed (groups of dots, histograms, curve ...). A selection on this frame corresponds to a temporal query. The informational window displays information related to events and allows the selection of information by means of button or drop-down lists. When one, or a set of particular events is selected, hypertext links make it possible to reach multimedia information contents (texts, images, photographs, videos and sounds) related to this event. Progressive reductions of the information space and synchronization of the frames The search for events is based on successive reductions of the research space, for each dimension. In the initial state, the spatial and temporal frames display all the events managed by the information system. When the user selects a space or temporal scale, the program executes accordingly a reduction of the research space. Only the events satisfying the conditions are displayed. The next reductions will be added to those already performed. 153
P-A. Davoine, J. Gensel and H. Martin
Gradually, successive reductions of information space lead to the selection of one event. Then, the description of this event appears in the informational window. A button allows to go back to the initial state and research space by removing all the criteria previously imposed. The cartographic restitution in a spatial frame corresponds to a temporal reduction of the search space. Selected events are those, which occurred during a given period of time or at a precise date. The restitution on the temporal graph corresponds to a spatial reduction of the search space. Presented events are those, which have occurred on the selected territory. It is thus possible to carry out simultaneously both a temporal and a space reduction of the search space. Architecture In order to implement the tool in a Web environment, we have developed a Java software that allows the visualization and the navigation via a Web browser to multimedia information with spatio-temporal references. This software is based on a Web architecture comprises various components: -
A Java applet
-
A bridge JDBC (Java DataBase Connectivity), which is a Java API (Application Programming Interface) for connecting a database to a Java program and allows the consultation of a database implemented using a DataBase Management System for which a bridge is provided.
-
A Web Apache server for providing and managing remote accesses.
-
A navigator client which execute HTML page and run Java programs.
EXAMPLES OF APPLICATION This environment made it possible to develop two specific applications SPHERE (Davoine et al., 2002) and SIDIRA (Davoine and Brunetm, 2003), each one having some specific characteristics (see Table 1, Figures 2 and 3).
Figure 3: Interactive and multimedia interface of the SIDIRA application.
154
A web-based multimedia framework for diffusing spatio-temporal information: application to natural hazards Table 1: Characteristics of information integrated into the SPHERE and SIDIRA projects SPHERE SIDIRA Origin of Historical Permanent investiHistorical investigation gation of avalanches investigation Phenomenological information information
Geographic information
Temporal information
Documentary information
Format of data
Semi-structured
Structured
Type of data Geographic referencing of events
Text River, Fuzzy spatial entity, Administrative entity
Assigned Text Administrative entity : hamlet, register, Corridor of avalanches, Zones with risks
Semi-structured
Geographic layer and format (V: vector/R: raster)
Administrative map: V Topographic map: R River map: V Administrative maps: Register and Hamlet: V Possible localization of avalanches ma: V
Geographic objet
Linear, polygon
Polygon
Multiple scale Cartographic scale Not specified Multiple scale Geographic scale Multiple scale Fuzzy and incomplete Precise and complete Fuzzy and incomplete Temporal data data data referencing Graphical presentation Multimedia documents
Cluster of points
Histogram
Time line
Texts, old maps, pictures, sketches, photo
Texts, old maps, pictures, sketches, photo, sound, video
Format of data
Electronic files
Electronic files
SPHERE is an application developed in the framework of a European project, which relates to historical natural hazards. This project concerns catastrophic floods which have occurred within the basin of the Isère river in France. The objective is to propose a framework accessed by Web integrating a complete catalogue of the major past floods. This information comes from a historical investigation. Users, which are scientists and technician, can visualize the spatial and temporal distribution of the flood events integrated into the database according to their occurrence and their intensity. The informational frame shows data assigned to the spatial selected entity or historical analysis of the selected event. Moreover, hypertext links give to the user the possibility of getting a electronic version of the historical document used by historian for the analysis (see Figure 2) The spatial interrogation can be made according to various geographical scales: rivers, town, sub basins. Temporal queries concern a specific date, a fixed or unfixed interval. The SIDIRA project addresses avalanche risks. The objective is to propose a Web-based information system in order to inform the general public about those risks. Users can visualize the events avalanches passed, but also get some information about the existing risks related to a given location. Information comes from two main sources: a permanent investigation about avalanches (EPA) and a historical investigation. The spatio-temporal multimedia environment adapted to the problems of avalanche risks has some specificities (see Figure 3). The temporal frame displays in the form of a histogram the distribution of the number of events for a given level of granularity (century, year, month). The informational frame displays data which are assigned to the spatial selected entity or the description of the selected avalanche. The historical frame displays the historical
155
P-A. Davoine, J. Gensel and H. Martin
analysis of the selected event and hypertext links give to the user the possibility of getting an electronic version of the historical document used by historian for the analysis. CONCLUSION The development of multimedia and Web tools, the increasing and diversified needs concerning natural risk management require to develop specific applications able to integrate and take into account the four main dimensions which structure information about natural risks: spatial, temporal, phenomenological and documentary. Through the SPHERE and SIDIRA applications, the guiding principles of a spatio-temporal multimedia framework have been proposed and validated. Our research is directed towards the integration of other functionalities (automatic integration of map, management of userdefined objects describing the application domain, simulation…) in order to develop a new kind of interactive Web-SIG for various fields using spatio-temporal multimedia information system. BIBLIOGRAPHIE Arnaud, A., 2003: Vers de nouvelles spécifications spatio-temporelles pour la valorisation de l’information historique dédiée aux risques naturels. Institut de Géographie Alpine, Université Joseph Fourier, Grenoble, Mémoire de DEA, in French. Carthwrigt, W., Peterson, P. and Gartner, G., 1999: Multimedia Cartography. Springer Verlag, Berlin, pp. 343 Dauphiné, A., 2001 : Risques et catastrophes, observer-spatialiser-comprendre-gérer. Armand Colin, Collection U, géographie, 288 p., in French. Davoine, PA., Martin, H., Trouillon, A., Cœur, D. And Lang, M., 2002 : Vers un système d’information historique basé sur le Web dédié à la gestion des risques naturels : applications aux crues et inondations de l’Isère. In : Proceedings 6 ièmes Journées CASSINI 2002, GDR-SIGMA, in French. Davoine, PA. and Brunetm R.: 2003, SIDIRA : un système d’information basé sur le Web dédié à la consultation des avalanches : application à la commune de Vallorcine (74). In : Proceedings SIRNAT 2003, Orleans, in French. Philipona, C., 2004 : Web-SIG : un outil pour la collecte et la diffusion de l’information. http://www.camptocamp.com, in French
156