SEAMONSTER: A wireless Sensor Web prototype applied to studying glaciated watersheds Matt Heavner
Dennis R. Fatland
University of Alaska Now at: Los Alamos National Lab Email:
[email protected]
Microsoft Research Redmond, WA Email:
[email protected]
Abstract—The SouthEast Alaska MOnitoring Network for Science, Technology, Education and Research (SEAMONSTER) Sensor Web is operating in partially glaciated watersheds on the margin of the Juneau Ice Field. Data from distributed, heterogeneous sensors with irregular sampling rates is integrated in a PostGIS (PostgreSQL with GIS extensions) database. Data discovery, data browsing, the sensor web operation and management, and education and publication are facilitated by the integration of the PostGIS database and Geoserver to deliver dynamically generated geospatial output. This presentation will focus on the technology developed to operate the SEAMONSTER sensor web and lessons learned regarding sensing the data using networking both internal and external to the sensor web. We will present examples of data fusion, modeling and reanalysis of the data using Open Geospatial Consortium (OGC) standards, and present lessons learned from the project.
I. I NTRODUCTION
Eran Hood and Cathy Connor University of Alaska Southeast Juneau, AK 99801
A. Science Motivation Glaciers in southeastern Alaska have been retreating and thinning rapidly for the last several decades [1], [10]. This loss of ice and the associated increase in freshwater discharge has important implications for the hydrology of pro-glacial rivers and the physical properties in downstream receiving marine ecosystems [7]. The proximity to the Juneau Icefield, the fifth largest icefield in North America, allows for the relatively easy deployment of a multi-layered sensor web to address fundamental questions regarding the ice dynamics and hydrology of outlet glaciers draining the icefield. Lemon Creek Glacier (∼10 km2 ) has a single supra-glacial lake which fills during the summer and catastrophically drains into Lemon Creek, a relatively well constrained glacial hydrologic system, illustrated in Figure 1. More information about the science motivation can be found in [5]. B. SEAMONSTER & Study Site
An environmental sensor network is a distributed set of sensors, generally operating in a mode of storing the data locally and periodically sending the data via telemetry or manual download. Communication between nodes, coupled with in-web computational power provides the sensor network the capability for autonomous reconfiguration based on the observed environment. The condition which triggers the reconfiguration could be of scientific interest or hazard monitoring and response (such as a glacial lake outburst) or an operational event (such as a temperature sensor which fails or a decrease of available battery power below a critical threshold). The autonomous reconfiguration of the sensor network is the key feature of a sensor web. The Open Geospatial Consortium (OGC) has developed a set of Sensor Web Enablement (SWE) protocols (OGC reference document OGC-07-165). In the final report from the 2007 NASA Earth Science workshop, the sensor web concept is defined as “a coherent set of heterogeneous, loosely-coupled, distributed nodes, interconnected by a communications fabric that can collectively behave as a single dynamically adaptive and reconfigurable observing system. The Nodes in a sensor web interoperate with common standards and services. Sensor webs can be layered or linked together” [12]. A software description of the sensor web concept is provided by [3]. The sensor web concept incorporates the need for data discovery for unanticipated data use.
The SEAMONSTER sensor web backbone of fieldhardened, autonomous power-managing computers has been developed and deployed in the Lemon Creek watershed in Southeast Alaska. Lemon Creek is a small, glacial watershed that hosts a diversity of temperate ecosystems. At the head of the watershed, 1200 m above sea level, lies the Lemon Creek Glacier. The Lemon Creek Glacier covers approximately 20% of the watershed with a layer of ice up to a few hundred meters thick. Following the watershed down from the mountain peaks surrounding the glacier toward the marine environment, the watershed encompasses a range of complex and diverse ecosystems in a fairly small spatial expanse. The ecosystems include sparsely vegetated alpine tundra, lush alpine meadows, new and old-growth temperate rainforests, cold streams, and tidally-influenced wetlands and an estuary region. II. H ARDWARE D ESCRIPTION The backbone of the SEAMONSTER sensor web is a small headless field computer or ‘Microserver’ developed by Vexcel Corporation in Boulder Colorado. Vexcel Microservers were developed from 2003 to 2008 with NASA support. These were conceived as general-purpose sensor platforms spanning signal frequencies from one sample per day up to kilohertz sampling frequency, with applicability across a broad variety of field science disciplines and applications (seismology, meteorology,
Fig. 1. The Lemon Creek Watershed. The figure illustrates .shp files exported from ESRI’s Arc suite of software, served by the PostGIS powered GeoServer, used to designate the different ecosystem portions of the Lemon Creek Watershed. The supra-glacial lake forms on the south end of the Lemon Creek Glacier (the glacier flows towards the North, which is up in this view).
visual monitoring, GPS surveys of glacier motion, robotic surveys of stream and lake chemistry and more). Microservers are field-hardened for survivability in harsh environments. They include a standard COTS WiFi router or an equivalent high bandwidth communication device to enable creation of ad hoc field networks used for sharing data and in the future enabling sophisticated software to direct limited field resources towards interesting events. Microservers are also able to act as base stations for localized lightweight sensor networks built on mote technology such as TelosB motes available from Crossbow Technologies. Microservers address the power-cost-data challenge in environmental monitoring by providing a battery recharging system and a power conditioning subsystem that permits the unit to hibernate when the primary external energy source (typically a lead-acid battery) is depleted. Hibernation continues (drawing microwatts of power) until the system determines that the primary battery is sufficiently recharged, typically by solar panels. The computing environment is an ARM-based Single Board Computer and the device also incorporates a GPS board. Supported communication protocols in addition to WiFi include a PC/104 bus, Ethernet, USB, and RS-232 serial ports as well as several analog-to-digital (ADC) channels. Data storage capacity of many Gigabytes is provided by a solid state USB flash drive. As noted Microservers can act as base stations for secondtier lightweight mote-based sensor networks. SEAMONSTER follows the technology lead of the Johns Hopkins University “Life Under Your Feet” soil ecology program employing the Koala / FCP protocols to deploy ‘physical heartbeat’ sensors: Total Solar Radiation, Photosynthetically Active Radiation, temperature, soil moisture, relative humidity, and electrical conductivity. The motes use the 802.15.4 Zigby protocol to periodically recover data to the base station (Microserver file system) and from there a series of daemons move raw data to the SEAMONSTER online GeoServer data catalog.
III. S OFTWARE D ESCRIPTION The SEAMONSTER project generates heterogeneous data sets at irregular time intervals. Managing the data to allow ease of access, public outreach, and easy of comparison between the different instruments by researchers motivated our use of a single SQL database for final storage of all data. (In situ data is typically stored as ASCII files within the Microserver filesystem.) All the data streams through sensors to the microservers and into a postgreSQL database with GIS extensions enabled, called PostGIS [8]. The GIS extensions require that every table entry be associated with a location and time entry. Coupling the PostGIS database with the Open Geospatial Consortium (OGC) GeoServer automatically provides the ability to disseminate the data streams through a web portal (http://seamonster.jun.alaska.edu/browser/), kml for 4-D Geobrowsers (such as Google Earth or Microsoft Virtual Earth), services to more traditional GIS systems (such as the ESRI suite of Arc software), and through the geowiki. The PostGIS database stores both raster and vector (e.g. ESRI .shp files). The geowiki is a project wiki using mediawiki, which requires a SQL database for page storage. By using the same PostGIS database as SEAMONSTER data, a spatio-temporal location is required for each wiki page. To enable autonomous reactivity, SEAMONSTER has implemented several strategies. The Vexcel Microservers continuously run on-board code used to react to the local power conditions. Vexcel Microservers have scheduled scripts running to analyze data from other platforms and react. For example, when the pressure transducer data indicates the supra-glacial lakes begin to drain, the scripts on the Vexcel Microserver force the pan/tilt/zoom camera to image the draining lake. SEAMONSTER also serves as a testbed platform for more sophisticated sensor web management solutions such as the MACRO (Multi-agent Architecture for Coordinated, Responsive Observations) project implementing a CORBAbased solution [9]. For resource management, SEAMONSTER makes use of the munin/rrdtool package and integrates the scheduled collection and plotting of resource information in the kml generation. A. Data Access The diverse data sets and non-continuous sampling from various sites created data cataloging and browsing issues. A web portal is used to avoid creating “one-off” in-house solutions which may not be available for interested public or scientists. Figure 2 illustrates two temperature records from different sites in the SEAMONSTER study area. The left panel shows a list of all the stations in gray. Selecting a station triggers (via openlayers) the map at the lower portion of Figure 2 to identify the location of the sensor. The measurements available at the station are shown as a drop down menu (Temperature, Humidity, Precipitation, and Voltage are shown). After selection of a measurement, the graph updates to show the most recent year of measurements. The user can zoom in and out of the plot graphically or select a date range. One more dataset of a similar measurement from a different
Fig. 2. A screenshot from the dynamically generated SEAMONSTER Data Browser (http://seamonster.jun.alaska.edu/browser/). This provides data browsing capability, including the ability to compare similar measurements from diverse locations, in the example shown the temperature at the Mendenhall Glacier terminus (green) is compared with the temperature at the Lower Lemon Creek stations (red). The station location is shown in the Microsoft Bing geobrowser using openlayers. The SEAMONSTER data portal is dynamically generated from the same PostGIS database as seen in Figure 3.
Fig. 3. An example of data fusion between SEAMONSTER datasets and JIRP datasets. Using common standards such as kml make this data fusion trivial.
C. Model Integration location can be overplotted on the plot, as is shown in Figure 2. The raw data can be downloaded in various formats (text, netcdf, xls) via this web interface. The data browser code is available through the project SVN and has been tested for use by at least two other projects. B. Data Fusion The Lemon Creek Glacier is part of the Juneau Icefield Research Program (JIRP) and was monitored during International Geophysical Year (IGY) (1957-58) [11] and continuously through the International Polar Year (IPY) (2007-8), providing a relatively long-term record of watershed changes. Kml datasets published by JIRP can be viewed in parallel with the kml publications from SEAMONSTER as shown in Figure 3. This illustrates the power of virtual globes and the use of OGC standards to easily integrate publicly available datasets from disparate sources via kml standards. As part of the NOAA ISET (Interdisciplinary Scientific Environmental Technology) program, a collaboration with NOAA Earth Systems Research Labs (ESRL) built upon the SEAMONSTER project to build a prototype web service that accomplishes the following tasks: 1) Data Access/Visualization: First simply displaying live-feed SEAMONSTER Sensor Data from UAS, viewed on Google Earth. The next step of data access incorporated snow depth measurements on the glacier and used high-resolution topography grid on Google Earth. Data fusion via OGC Web Coverage Service (WCS) next accessed and displayed wind data obtained from the Unidata THREDDS WCS. Wind data obtained from GSD’s NextGen FIM WCS. 2) Analysis: The EIS framework then performs calculations to produce new snow depth based on redistribution of snow from the wind and topography information. This second example of data fusion is described in more detail in a presentation on the ISET Earth Information Service (EIS) [4].
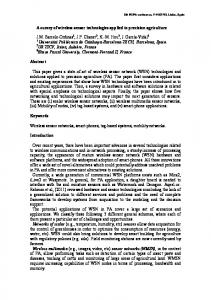
Data from the climate stations is being used in conjunction with a temperature index ice and snow melt model [6] and a digital elevation model to model runoff from the Lemon Glacier and evaluate the glacial contribution to stream flow in the upper Lemon Creek watershed. Stage data from the supra glacial lake are being used in conjunction with the modeled glacial runoff and water quality data to evaluate the magnitude of the annual glacial lake outburst flood and its impact on water quality in Lemon Creek. D. Reanalysis The next step after model integration explaiend above was to compare modeled glacier melt [6] with the measured runoff in the watershed. The match between model and measured could be optimized using the redistributed snow pack described in the previous section. Results from this work are shown in Figure 4. The upper panel of the figure shows the colorcoded modeled geographical melt rate (in centimeters of snow water equivalent (SWE). The four colored shapes in the upper panel correspond to the watershed boundary used for the model (the glacier is on the lower right side corresponding to melt). The model incorporates both the climate parameters observed by SEAMONSTER, a calculated lapse rate based on the temperature from the top and bottom of the glacier, and topographic information for solar shading calculations. The air temperature plot (covering a 16 days period) shows the model correctly produces more melt on warmer days. The lower portion of the plot shows the measured (red) and modeled (blue) melt over two months. There is good agreement between measurement and model except during the ten day period associated with drainage of the lake, corresponding to the fact that the stored (and then released) water is not captured in a simple melt model.
simpler the implementation and more throrough the documentation of the solution, the more other scientists will be able to do on their budget. Specifically, based on the SEAMONSTER project and follow-on work, a new project can take the result that ”If you can reduce your sensor values to an analog voltage then here is a pre-built solution that costs you $20k and can push data 30 miles over a hill.” So ”simpler is better” really means ”simpler is more robust” in sensor networks. This experience is counter to a typical computer programmer’s Moore’s law thinking of more computational power means more code out on the nodes. In reflection on the end SEAMONSTER system design, the microserver should be optimized so that its main system is onboard data storage and its second system does a transmit operation. The tradeoff is enabling enough communication for the coordinated autonomous reconfiguration required to realize the sensor web concept. ACKNOWLEDGMENT SEAMONSTER was funded by NASA Earth Science Technology Office grant AIST-05-0105, NOAA Education Partnership Panel Interdisciplinary Scientific Environmental Technology (ISET) Cooperative Science Center Grant, and NSF Research Experience for Undergraduates Grant No. 0553000. M Habermann, L Berner, E Knuth, N Korzen, D Sauer, J Galbraith, S Siefert, and J Jones were integral to SEAMONSTER. Fig. 4. The upper section shows the color-coded modeled geographical melt rate (in centimeters of snow water equivalent (SWE). The air temperature plot (over 16 days total) shows the model correctly produces more melt on warmer days. The lower portion of the plot shows the measured (red) and modeled (blue) melt over two months. There is good agreement between measurement and model except during the ten day period associated with drainage of the lake.
IV. L ESSONS L EARNED In addition to the common system design optimization criteria (capability, cost, and power consumption) the SEAMONSTER project set out to enable unanticipated science missions. One design lesson learned is that flexibility in science mission should be accomplished through simplicity in the first three areas and documentation. For example, the SEAMONSTER project and provide sensor web technology if the target sensors can be supported at the intended level of simplicity. In a follow-on project by one of the authors (Fatland) sensors outputting analog voltages were used, permitting the sensing technology to be motes and the use of a Vexcel Microserver and a 900 MHz radio as the base station. SEAMONSTER did include the multi-tiered sensor capability but Campbel Scientific climate stations (more complex than originally anticipated) required more sophistication than motes for data acquisition. Therefore, SEAMONSTER used primarily microservers as sensing nodes, obviously not as cost effective as a primarily mote based sensor web.. The goal of unanticipated sciences missions is obviously moderated by limitations in the tradition three (capability, cost, power) constraints. This leads to the conclusion that the
R EFERENCES [1] Arendt, A., Echelmeyer, K., Harrison, W., Lingle, C., Valentine, V., 2002. Rapid wastage of Alaska glaciers and their contribution to rising sea level. Science 297 (5580), 382–386. [2] Berner, L., Habermann, M., Hood, E., Fatland, R., Heavner, M., Knuth, E., Jan 2007. Providing a virtual tour of a glacial watershed. EOS Transactions, AGU 88 (52). [3] Gibbons, P., Karp, B., Ke, Y., Nath, S., Seshan, S., Res, I., Pittsburgh, P., 2003. Irisnet: An architecture for a worldwide sensor web. IEEE Pervasive Computing 2 (4), 22–33. [4] Hansen, T. L., LeFebvre, T. J., Schultz, M., Romberg, M., Mysore, A., Holub, K., McCaslin, P., Salm, S., Esterline, A., Li, Y., Baber, C., Fuller, K., Pogue, Y., Wright, W., Heavner, M., Steinbach, M., Olobode, R., Qian, L., Fatland, R., 2009. Earth information services. 25th Conference on International Interactive Information and Processing Systems (IIPS) for Meteorology, Oceanography, and Hydrology Session 7B, Internet Applications and Cyberinfrastructure II. [5] M. Heavner, D. R. Fatland, E. Hood, and C. Connor, Sensor Webs in Virtual Globes, accepted to Computers & Geosciences, 2010. [6] R. Hock, Glacier melt: A review on processes and their modelling. 2005. Progress in Physical Geography 29(3), 362-391. [7] Hood, E., Scott, D., Sep 2008. Riverine organic matter and nutrients in southeast Alaska affected by glacial coverage. Nature Geoscience 1 (9), 583–587. [8] Hsu, L., Obe, R., 2007. PostGIS for geospatial analysis and mapping. Postgres OnLine Journal, 19–20. [9] Kinnebrew, J. S., Biswas, G., Shankaran, N., Schmidt, D. C., Suri, D., April 2007. Integrating task allocation, planning, scheduling, and adaptive resource management to support autonomy in a global sensor web. 2007 NASA Science Technology Conference. [10] Larsen, C., Motyka, R., Arendt, A., Echelmeyer, K., Jan 2007. Glacier changes in southeast Alaska and northwest British Columbia and contribution to sea level rise. Journal of Geophysical Research 112 (F01007). [11] Miller, M., Pelto, M., Dec 1999. Mass balance measurements on the Lemon Creek Glacier, Juneau Icefield, Alaska, 1953-1998. Geografiska Annaler 81, 671–681. [12] NASA AIST Workshop, Feb 2007. NASA AIST Sensor Web Technology Meeting Report. Http://esto.nasa.gov/sensorwebmeeting/files/ AIST Sensor Web Meeting Report 2007.pdf.