IAC-07- A3.I.A.19 A VALUE PROPOSITION FOR LUNAR ARCHITECTURES UTILIZING PROPELLANT RE-SUPPLY CAPABILITIES James Young Georgia Institute of Technology, United States of America
[email protected]
Alan Wilhite National Institute of Aerospace, United States of America
[email protected]
ABSTRACT
The NASA Exploration Systems Architecture Study (ESAS)ii produced a transportation architecture for returning humans to the moon affordably and safely while using commercial services for tasks such as cargo delivery to low earth orbit (LEO). Another potential utilization of commercial services is the delivery of cryogenic propellants to LEO for use in lunar exploration activities. With in-space propellant re-supply available, there is the potential to increase the payload that can be delivered to the lunar surface, increase lunar mission durations, and enable a wider range of lunar missions. The addition of on-orbit propellant resupply would have far-reaching effects on the entire exploration architecture. Currently 70% of the weight delivered to LEO by the cargo launch vehicle is propellant needed for the TLI burn. This is a considerable burden and significantly limits the design freedom of the architecture. The ability of commercial providers to deliver cryogenic propellants to LEO may provide for a less expensive and better performing lunar architecture.
NOMENCLATURE ESAS CaLV CLV SM CEV LSAM FOM AS DS TLI LOI ISRU
= = = = = = = = = = = =
Exploration Systems Architecture Study Cargo Assist Launch Vehicle Crew Launch Vehicle Service Module Crew Exploration Vehicle Lunar Surface Access Module Figure of Merit Ascent Stage Descent Stage Trans Lunar Injection Lunar Orbital Insertion In-situ Resource Utilization
1
ZBO = MLI = STS = LCC = LOM = NAFCOM = CER =
Zero-boil-off Multi-layer Insulation Space Transportation System Life Cycle Cost Loss of Mission NASA Air Force Cost Model Cost Estimating Relationships
INTRODUCTION In 2004, President Bush addressed the nation and presented the NASA plan to further space exploration. The vision for space exploration included the completion of the International Space Station, the retirement of the Space Shuttle, the development of a crew exploration vehicle, and the return of humans to the moon by no later than 2020. The Exploration Systems Architecture Study (ESAS) team was established to develop the baseline architecture that NASA would use to return humans to the moon. The architecture focused on the development of two new shuttle-derived launch vehicles. The first vehicle, called the Cargo Launch vehicle (CaLV), delivers the Earth Departure Stage (EDS) and Lunar Surface Access Module (LSAM). The second vehicle, called CLV, delivers the new CEV and Earth Return Service Module. A depiction of the architecture ConOps is provided in Figure 1.
In this architecture, crew and cargo elements rendezvous in LEO. The EDS performs the TLI maneuver and then is expended. The descent stage of the lander performs the LOI maneuver. Once the crew transfer from the CEV to the LSAM, the LSAM detaches from the CEV and lands on the lunar surface. After the mission is complete, the LSAM separates, leaving the descent stage on the surface. The crew docks with the CEV and the service module performs the TEI. The CEV finally re-enters the Earth’s atmosphere and performs a land based landing. Although some modification have been made to the original architecture, but this study will ignore these changes for now and focus on the original baseline architecture. Architecture Concerns The baseline architecture was designed over a three month period using concept level design tools. These tools limit the scope and fidelity of the analysis that can be completed, but allows a larger number of designs to be considered. Additional analysis has shown that there are some concerns with the baseline architecture, which may be difficult to overcome with the current design. Multiple Launch Solution
Figure 1: ESAS Baseline Architecture1
The two launch solution introduces a new scheduling constraint into the architecture design. In this case, two vehicles must be launched within a relatively short period of
2
time. The EDS and LSAM are delivered to LEO in advance of the CEV. The EDS and LSAM will experience a degree of propellant boil-off during this wait time. A specific amount of margin is built into the architecture to handle this loss of propellant. There is, however, a chance that some level of delay will prevent the CLV from launching within this margin. If this occurs, the EDS and LSAM will not have sufficient fuel to complete the mission. This would result in the complete loss of the mission and associated hardware. If the propellant lost to boil-off could be provided after the launch of the CLV, then a significant improvement in mission success and life cycle cost could be achieved. Mass Growth It is difficult to accurately predict the final mass of a new launch system during the conceptual design phase. The common design practice is to add a growth margin to the initial mass estimation in an attempt to account for the errors in the initial estimate. The typical growth margin used in the conceptual design phase is around 15%, while the average mass growth for space vehicles is around 25%2 and was over 50% on the Apollo lunar lander. If these trends continue, then it is likely that the architecture will experience significant growth. This is a serious concern, especially for the cargo launch vehicle, which is already pushing the physical limitations of the current assembly facilities. With this physical limitation in place, any growth of the CaLV or LSAM would result in a decrease in the payload capability of the architecture and could result in an infeasible design. The majority of the weight delivery to LEO is in-space propellant (approximately 70% of the total payload). If this requirement can be reduced, then the growth of the architecture elements can be met with the baseline design. Propellant re-fueling offers the ability of decrease the amount of
propellant that must be delivered by the launch vehicles. Extensibility The current lunar architecture is designed to be extensible for future exploration missions, including a human Mars mission. A series of CaLV launches is used to deliver the needed cargo and propellant to LEO. The ESAS’s baseline human Mars mission calls for the launch of six CaLVs. The launch cost alone could exceed $5B per mission and still requires the development of a nuclear propulsion system. The EDS could be used to perform the Mars transfer maneuver and can deliver up to 300,000lbs of payload. The ability to utilize the EDS would greatly reduce the number of CaLV launches required and eliminate the need for the development of a new propulsion system. The ability to use propellant re-fueling provides additional design freedom to the design of the architecture. The development and implementation of this capability could provide an increase in mission success, lower the overall LCC, move the design away from the infeasible design space, and provide a more affordable and sustainable long term exploration architecture. However, this development comes at the cost of additional technology risk and requires dependency on an outside source to consistently deliver propellant to LEO. Propellant Re-Fueling The concept of in-space propellant resupply has been around since the 1960’s, when the Air Force began investigating how its aircraft re-fueling techniques could be applied to in-space operations3. In this case, the propellant required for in-space operations is delivered to LEO or some other destination. It is stored in an orbiting propellant depot instead of being transferred by a large tanker aircraft. The
3
propellant can then be transferred to any of the in-space vehicles.
Project Description The work presented in this paper will outline the use of propellant re-fueling capabilities and how it affects the design of the current NASA baseline lunar architecture. The study focuses on the following key areas: 1. How can this capability best be applied to the lunar architecture? 2. How does the best architecture design change when different weighting scenarios are considered? 3. How does uncertainty in the underlining assumptions affect the best design? 4. What is the propellant delivery cost required to make this capability a viable option? This paper will outline the work done to address these questions and provide results to answer all but Question #3. This work is ongoing and will be addressed at a later date.
Re-fueling Design Space Simulation The simulation environment was developed to help automate the study of propellant re-fueling and its impact on the lunar architecture. An initial investigation of the problem established nine categories that, when combined with propellant refueling, could greatly impact the design of the architecture. These categories, along with the individual design choices, are provided in Figure 2. The design space does not include any specific configuration changes to the baseline design, except that the AS engine is allowed to vary between the four propellant combinations still being considered. It is assumed that the majority of the baseline architecture is fixed, and only changes that are specifically altered by re-fueling are considered. This allows for a more valuable comparison to be made between the baseline architecture and various refueling trade studies. The simulation can be run for almost any combination of these variables. While all combinations of the different input variables are not compatible, there is still more than 10,000 different designs that can be created. This is a very large set of data and would be difficult, if not impossible, to fully explore if each design had to be calculated manually.
Re-fueled Element
EDS
LSAM AS
LSAM DS
CLV 2nd Stage
SM
Propellant Transferred
LOX
LH2
LOX/LH2
LOX/CH4
LOX/LH2/CH4
LSAM Ascent Propellant
LOX/LH2 (pump)
LOX/LH2 (pressure)
LOX/CH4
Hypergols
Boil-off Mitigation
MLI
Cryo-Cooler/MLI
* Considered on EDS, LSAM DS, and LSAM AS
LOI Burn Element
EDS
LSAM DS
CLV 2nd Stage
TLI Burn Element
EDS
CLV 2nd Stage
LEO Orbit Stay
15 days
95 days
Re-fuel Boil-off Propellant
Yes
No
Propellant Transfer
LEO Depot
LLO Depot
Direct Transfer
Figure 2: Trade Study Morphological Matrix
4
Design Space Scenarios
Simulation Environment
The design space can be further broken down into five re-fueling scenarios; these are provided in Figure 3. Within each scenario, the different combination of design variables can be investigated. The baseline case requires no re-fueling and represents the baseline concept of operations. In this case, only a subset of the design variables are considered. Case 1 increases the payload capability of the architecture by increasing the propellant burned during the second stage ascent. Case 2 decreases the amount of TLI propellant that is carried to LEO and replaces it with additional mission payload. Case 3 decreases the amount of TLI propellant that is carried to LEO. This reduced payload requirement allows the vehicle to greatly reduce its overall size. Case 4 provides the propellant that is lost to boil-off while the EDS waits for the crew to be delivered. This case eliminates the LOM that can occur from a long term delay of the CLV, it can be applied to any of the other 4 cases. Cases one through four all require the use of propellant refueling. A range of propellant quantities will be considered for each case.
The lunar architecture propellant re-fueling simulation environment was developed using the ModelCenter4 integration frame work developed by Phoenix Integration. ModelCenter is a commercially available software that provides a user-friendly architecture for passing information between different analysis models. In this case, the models have been developed using Excel©, but any software application could have been used. The simulation environment is broken down into six analysis modules which analyze the architecture elements and calculate each of the Figures of Merit (FOM) used to compare the different architecture designs. The environment is controlled by the “controller module”, which is able to pass on the inputs for each design to the individual modules. The controller can be set up to automate the analysis of any number of cases, including the storage of the desired output information. The simulation of each design takes approximately seven seconds to compute, including the 10,000 Monte Carlo runs that are performed in three of the models.
Earth’s Surface
Initial LEO
Prior to TLI
• •
Baseline case No re-fueling
•
Burn additional ascent propellant
•
Increase the mission payload
Baseline
–
Case 1
Case 2
Case 3
Case 4
LEO Re-fueling
–
dF dP
•
Must re-fuel more than dF
•
Remove some TLI propellant
•
Increase the mission payload
•
Must re-fuel more than dF
• • •
Remove all TLI propellant Decrease size of CaLV Mission payload remains the same
• • • •
Re-fuel propellant boil-off Eliminate CLV LOM case Small amount of propellant needed Can be used on any above case
– –
dF dP (less than above)
Propellant Empty Payload
Figure 3: Low Earth Orbit Re-fueling Scenarios
5
Design Space Evaluation Method A Multi-Attributed Decision Making (MADM) technique is used to rank the effectiveness of each combination of design variables. This technique allows a set of criteria to be used to evaluate the different design options. The implementation of this technique can lead to a more optimal design selection than is possible when only a single criterion is considered. The requirements for this technique are a set of decision making criteria, the relative importance of each criteria (weighting), and how well each design scores for each criteria. A set of five selection criteria are included in this evaluation. A description of each is provided below. These are the same criteria used for the selection of the baseline architecture. • • • • •
Safety and Mission Success – Overall loss of mission p(LOM) Effectiveness – Lunar surface payload capability Extensibility – LEO payload capability Programmatic Risk – Technology development risk Affordability – Life cycle cost
A set of eight weighting criteria will be considered in this decision making process. The different scenarios are provided in Table I. The first five scenarios examine each of the criteria individually. The sixth considers them to be of equal importance. The seventh considers the two most important criteria (LCC and LOM) while the final is a NASA-type weighting, where all five criteria are considered. A value function is used to translate the results from the simulation into a normalized score for each criteria. These scores are linearly normalized between zero and one, where the best result is a one and the worst is a zero. The only exception is that an exponential function is
used for the life cycle cost, which allows a penalty to be applied to designs that greatly exceed the current budget.
FOM 1 1 0 0 0 0 0.2 0.5 0.35
FOM 2 0 1 0 0 0 0.2 0 0.15
FOM 3 0 0 1 0 0 0.2 0 0.1
FOM 4 0 0 0 1 0 0.2 0 0.05
FOM 5 0 0 0 0 1 0.2 0.5 0.35
Table I : Weighting Scenarios
This technique provides a ranking of each different design based on the weighting scenario of interest. Since the selection of a weighting scenario is somewhat arbitrary, it is important to select a design that performs well across multiple weightings and not just a single one. The methods for ranking the design will be used to determine what is the best way to apply re-fueling to the lunar architecture and to understand how this selection reacts to changes in the propellant delivery cost. Effects of Uncertainty There are two types of uncertainty that will be investigated in this work. The first is the cost of delivering propellant to the architecture elements in LEO. Since this capability has never been developed or put into practice, it will be important to understand how the use of this capability changes as a function of the delivery cost. It is of specific interest to determine what is the maximum price that can be charged per pound of propellant while Still considering the propellant re-fueling scenario as a top design. The second type of uncertainty that will be considered will investigate how changes to the input assumptions affect which design choices are indicated as a best ranked design. An example would be the assumption made in developing the ZBO cryo-cooler model. An uncertainty factor will be applied to
6
Total Life Cycle Cost 100 90 80 70 60 50
42.8
40
32.0
4.8
3.9
3.9
3.7
2.7
LOI Maneuver
0 LEO Orbit Time
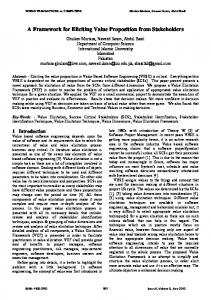
Understanding which design variables have the most impact is a very useful design tool. The impact of each design variable is measured by the variability seen in the outputs when a two-factor Analysis of Variance (ANOVA) is applied. These results can then be presented in a Paerto Chart where the relative variance of each variable is shown for each output. This allows the designer to understand which of the design variables has the most impact on a specific output variable.
6.1
Descent Mitigation
10
Refuel Boiloff
20
Ascent Mitigation
Design Variable Sensitivity
30
LH2 Resupplied
The following sections will outline the results obtained during this study. These results will be presented in three sections. The first is a sensitivity study of the output responses to the design variables. This is to provide the designer with an understanding of how each design variable affects the overall architecture. The second section provides a characterization of the top 100 designs and how they change when different weighting scenarios are considered. The final section will specifically look at the top few designs and discuss how propellant re-fueling can best be applied to the architecture and under what conditions it would not be beneficial to the architecture.
EDS Mitigation
Re-fueling Case Study Results
the LCC is most affected by the designed LEO stay time. This has the largest effect on the LCC because when the 95 day stay time is chosen, a large amount of margin must be carried to LEO to account for the propellant that will be lost. This increases the size of the launch vehicle that is used to deliver these elements. When the 15 day stay is considered less margin must be carried to LEO, but there is a greater chance that the mission will be scrubbed. This can add large additional cost to the architecture. Around 40% of the variability is associated with this decision. These two cases differ on what is the second most influential factor. For Case 1, which stage performs the LOI maneuver is the second most important criteria since it has the greatest effect on the lunar lander. Case 3, however is more affected by the amount of TLI LOX that is delivered to LEO as it has the highest delivery cost.
LOX Resupplied
important aspects such as the weight, power requirements, and cost to determine the range of these values where cryo-coolers are still considered the best option for the architecture. The smaller this range, the more risk that will be associated with the use of that design aspect.
Figure 4: Paerto Chart, Case 1, Life Cycle Cost
Total Life Cycle Cost 100 90 80 70 60 50
46.3
40 30
21.6 4.3
2.0
0.8
0.2
Ascent Mitigation
Descent Mitigation
11.2
Refuel Boiloff
13.5
10
EDS Mitigation
20
LH2 Resupplied
LOI Maneuver
LOX Resupplied
0 LEO Orbit Time
Three example Paerto Charts are provided to illustrate the information obtained in this analysis. The first two charts (Figure 4 and Figure 5) are for the total LCC output and provide a comparison between Case 1 and Case 3. These two figures reveal that
Figure 5: Paerto Chart, Case 3, Life Cycle Cost
7
$/lb to LS 100 90 80 70 60
51.6
50 40 30 20
12.8
10.3
10
8.6
7.0
6.5
3.1
0.0 LEO Orbit Time
LOX Resupplied
Descent Mitigation
Refuel Boiloff
Ascent Mitigation
LH2 Resupplied
EDS Mitigation
LOI Maneuver
0
Figure 6: Paerto Chart, Case 1, $/lb to Lunar Surface
The results in Figure 6 also depict Case 1, but now focus on how the $/lb of payload delivered to the lunar surface is affected by the input variables. In this case, the stage that performs the LOI maneuver has the largest impact, with over 50% of the variability associated with this factor. This is because much of the Lander’s descent stage is designed around being able to perform this maneuver. If this could be eliminated, then the size and cost of the lander can be greatly reduced. These figures show how the variability in the output variables can be characterized with respect to each of the inputs design variables. This provides the designer with a set of tool that can be used to when a change in a output variable is desired.
Top Design Characteristics By using the results obtained from the MADM process, a ranking of each design could be determined. It was of some interest to understand which values appeared the most in each of the different input variable top designs. The histograms provided in Figure 7, Figure 8, and Figure 9 display the number of times that each value showed up in the top 10, 20 , 50, and 100 designs. This allowed the designer to visualize the design space and determine if a specific choice dominates the top designs or if the ranking was indifferent of the design choice made.
Each of these figures contains three weighting scenarios for comparison. The top chart is of equal weighting (0.2,0.2,0.2,0.2,0.2), the middle chart is the NASA scenario (0.35, 0.1,0.1,0.1,0.35) and the bottom chart is a cost and reliability only scenario is (0.5,0,0,0,0.5). It is evident in these charts that the chosen weighting scenario greatly affects the outcome. The information in Figure 7 and Figure 8 is from Case 3 and the information in Figure 9 is from Case 1. The charts in Figure 7 examine which engine should be designed for the ascent stage of the lunar lander. The LOX/LH2 pump-fed engine is the most common engine selection among all of the weighting scenarios, appearing in 50% of the top 100 deigns. This engine has a higher development risk, but also provides the highest performance and generally provides the lowest lander cost. The high performance of this engine generally outweighs any of the development risks. The Hypergol engine is the second most commonly selected engine. Its performance is the lowest of the designs considered, but it is the simplest and most easily developed. An interesting feature to note is that the pressure-fed and methane engines almost never show up in the best designs when the NASA-type weighting is chosen. The engine selection is likely to be dominated mostly by the risk preference of the decision makers. As risk becomes a more important factor the more likely the decisions will move away from the pump-fed design. The charts in Figure 8 depict the mitigation method used on the lander and EDS. The results suggest that the mitigation method selected has little effect on the overall design of the architecture. The selection of MLI only appears in slightly more than 50% of the designs regardless of the weighting scenario considered. This suggests that any benefits gained from the use of cryo-coolers are balanced by the
8
Ascent Stage Propellant
Mitigation Methods
50 45 40 35
70 Hypergols
60
LOX/CH4 LOX/LH2 (pressure)
50
LOX/LH2 (pump)
AS - MLI AS - Cryo DS - MLI DS - Cryo
30
40
25 20
30
15
20
EDS - MLI EDS - Cryo
10 10
5 0
0
Top 10
Top 20
Top 50
Top 100
Top 10
Ascent Stage Propellant
60
LOX/CH4 LOX/LH2 (pressure)
50
LOX/LH2 (pump)
AS - MLI AS - Cryo DS - MLI DS - Cryo
40
30 30
20
EDS - MLI EDS - Cryo
20
10
10
0
0
Top 10
Top 20
Top 50
Top 100
Top 10
Ascent Stage Propellant
40 35
Top 20
Top 50
Top 100
Mitigation Methods
50 45
Top 100
70 Hypergols
40
Top 50
Mitigation Methods
60 50
Top 20
70 Hypergols
60
LOX/CH4 LOX/LH2 (pressure)
50
LOX/LH2 (pump)
AS - MLI AS - Cryo DS - MLI DS - Cryo
30
40
25 20
30
15
20
EDS - MLI EDS - Cryo
10 10
5 0
0
Top 10
Top 20
Top 50
Top 100
Top 10
Top 20
Top 50
Top 100
Figure 7: Ascent Propulsion Characterization
Figure 8: Mitigation Method Selected
additional mass and costs associated with implementation of the system. The MLI is slightly favored because of the lower risk in developing the technology. The campaign only considered a seven day lunar mission; in the case of an extended lunar or Mars missions cryo-coolers may become a more optimal selection.
account, so only the additional cost is included in the decision. In the NASA case, the best design tends to favor some increase in upper stage burn. The top 10 designs tend to prefer less than the maximum increase in propellant, but the rest of the designs are split between increasing the burn by 50,000 lbs and 100,000 lbs. These results show that when all of the FOM are considered, the overall design of the architecture favors the use of propellant re-fueling to increase the payload capability even with a corresponding increase in the LCC. These results assume a propellant delivery rate of $1,900/lb of propellant. If this price can not be met the use of propellant re-fueling is no longer favored by the architecture. A more detailed examination of the top five design for Case 1 and Case 3 are provided in the next section.
The information provided in Figure 9 comes from varying the additional propellant burned during the second stage ascent of the CaLV. The greater the amount of propellant burned, the more payload that is delivered to both LEO and the LS. This comes at an increase in architecture cost, however, as additional propellant must be delivered to LEO to refuel the EDS. The results for this case are very dependent on the weighting scenario used. Looking at the cost/reliability scenario (Chart 3), it is evident that increasing the upper stage burn is not desirable. This is because the performance increase is not taken into
9
Additioanl Propellant Burned 70 0
60 50
50,000 100,000
40 30 20 10 0 Top 10
Top 20
Top 50
Top 100
Additioanl Propellant Burned 50 45
0
40
50,000
35
100,000
30 25 20 15 10 5 0 Top 10
Top 20
Top 50
Top 100
Additioanl Propellant Burned 120 0
100
50,000 100,000
80 60 40 20 0 Top 10
Top 20
Top 50
Top 100
Figure 9: Additional Ascent Propellant
Description of Best Designs The results presented in the previous sections depict the sensitivity of propellant re-fueling to each of the design variables. They aslo illustrate exactly where the best design fell within the design space when different weighting scenarios are considered. This section will discuss how propellant re-fueling is best used within an exploration architecture. Specifically, it will focus on three areas: where re-fueling technologies can best be applied, what is the required cost of propellant delivery to make this concept feasible, and how the optimal design changes as the propellant delivery cost deviates from this value. All of the results presented here will be for the NASA-type weighting scenario outlined above. The results provided in Figure 10 are for Case 1, where a greater payload capability is achieved through an increase in the
upper stage burn. There are four variables that specifically investigate how re-fueling techniques can be applied to the architecture. These variables are the lander re-fueling strategy, re-fueling the LEO boil-off, increasing the EDS capability to include the LOI maneuver, and increasing the CaLV upper stage burn. The choice for each of these variables, along with the other design variables, are provided in Figure 10. These results are ranked based on how well they scored using the value function formulation discussed previously. This technique should be used as a guide to help the decision maker select the best alternative. It, however, is not the only information that should be considered when making the decision. In this case, the top five designs are presented for Case 1 and Case 3. The scores for each of these are close enough that it is difficult to determine that one is better than the others. At first glance, is it evident that the four variables specific to the use of propellant re-fueling are consistent across the top four designs. The variables then switch for the fifth best design. The best case design increases the upper stage burn by an additional 50,000 lbs, increasing the total delivered payload by 7% and increasing the mission payload capability by 70%. The EDS is preferred to perform the LOI maneuver, allowing the lander to decrease in gross weight by up to 30%. Providing re-fueling capabilities to the lander is a less optimal means of improving the payload capability of the architecture. Any payload improvement comes at a lower utility than achieved from an increase in the upper stage burn time and from utilizing the EDS to perform the LOI maneuver. The ability to re-fuel the boil-off lost while the EDS remains in LEO also always shows up in the top four designs. This eliminates the LOM scenario that occurs when the CLV experiences significant delay. This increases the success rate of the architecture and lowers the overall cost. The fifth solution is similar to the baseline
10
in Case 1, the architecture favored burning some of the TLI propellant during ascent and re-fueling it in orbit. In this case, the architecture is not improved by providing this propellant in orbit. The reduction in the size of the vehicle is not enough of an advantage to outweigh the additional cost associated with delivering and storing this quantity of propellant. The architecture also favors the use of MLI on the EDS as any propellant lost will be re-fueled while in LEO and cryo-coolers on the lander since the propellant must be stored for a longer period of time. This is the opposite trend seen in Case 1.
design, where no re-fueling techniques are applied. The results in Figure 11 are for Case 3. In this situation the CaLV is allowed to decrease its size as needed while still maintaining at least the same payload capability to both LEO and the lunar surface. Similar to the results seen in Case 1, the ability to re-fuel the propellant lost while the EDS is in LEO is chosen for four of the top five designs. This again illustrates that the cost of delivering propellant to the architecture is less than the cost of the lost hardware that would occur. This is true for delivery costs that are less than $1,950/lb; if the price is greater than this, the architecture does not favor this choice. Another similarity is that all of the top designs do not favor the use of re-fueling techniques on the lunar lander, other than re-fueling the propellant boil-off. At the current propellant delivery price the additional LS payload is outweighed by the additional cost to the architecture. At some lower delivery cost, it may become more beneficial to re-fuel at least one stage of the lander. Utilizing the EDS to perform the LOI maneuver is still among the best designs. This change not only results in a smaller lander, but also causes a significant reduction in the overall size of the CaLV. The major difference between these two cases is that
The trends seen in this case may be a result of the case design and the FOM used to evaluate it. The case is designed to keep the LS and LEO payload fixed, and adjusts the size of the vehicle as needed. In some cases, when re-fueling techniques are used, the lunar mission payload capability can remain constant while decreasing the overall capability of the architecture. An example is when the TLI propellant is removed at launch. This decreases the payload that the CaLV has to deliver to LEO, but does not decrease the size of the lander. The ability to complete the lunar mission remains the same, but the extensibility to other missions is greatly reduced because the
AS Propellant
AS Mitigation
DS Mitigation
Lander Stage Re-fueled
EDS Mitigation
LOE Orbit Time
Boil-off Refueled
LOI Maneuver
TLI Propellant Re-fueled
Hypergols
MLI
MLI
None
Cryo-cooler
15 days
yes
EDS
50,000
LOX/LH2 (pump)
MLI
MLI
None
Cryo-cooler
95 days
yes
EDS
50,000
LOX/LH2 (pump)
Cryo-cooler
MLI
None
Cryo-cooler
95 days
yes
EDS
50,000
LOX/LH2 (pump)
MLI
Cryo-cooler
None
Cryo-cooler
95 days
yes
EDS
50,000
LOX/LH2 (pump)
MLI
MLI
None
MLI
95 days
no
DS
0
Figure 10: Top five designs for Case 1 (propellant delivered at $1,900/lb)
11
AS Propellant
AS Mitigation
DS Mitigation
Lander Stage Re-fueled
EDS Mitigation
LOE Orbit Time
Boil-off Refueled
LOI Maneuver
TLI Propellant Re-fueled
LOX/LH2 (pump)
Cryo-cooler
Cryo-cooler
None
MLI
15 days
yes
EDS
0
LOX/LH2 (pump)
Cryo-cooler
Cryo-cooler
None
MLI
15 days
yes
DS
0
Hypergols
MLI
Cryo-cooler
None
MLI
15 days
yes
DS
0
LOX/LH2 (pump)
MLI
MLI
None
MLI
95 days
no
EDS
0
LOX/LH2 (pump)
MLI
MLI
None
Cryo-cooler
15 days
yes
EDS
0
Figure 11: Top five design for Case 3 (propellant delivered at 1,950/lb)
architecture can deliver less total payload. This forces the selection away from that area of the design space. In fact, no design that reduces the architecture extensibility shows up in the top designs. The use of this case would only be considered when the architecture’s extensibility is not an important merit. It would be an interesting tradeoff to see how these results change when a weighting criteria that considers only the mission success, reliability and technology risk is examined.
Conclusions
This paper discusses how propellant refueling techniques can be applied to NASA’s current lunar architecture. A design space was established to aid in fully exploring how re-fueling technologies could be applied to the design of the architecture. The design space was evaluated using a MADM technique that considers the same five FOM used in the original ESAS study. A sensitivity study was performed to determine the impact that each design variable has on the design of the architecture. An example set of three variables was discussed. The top set of designs for both Case 1 and Case 3 were presented at the break even propellant delivery cost. This cost is approximately $1,900/lb of delivered propellant for both cases. The most common use of propellant re-fueling is to
provide the propellant lost while the EDS and lander are stationed in LEO. This decreases the overall cost of the architecture and increases the mission success rate. If the delivery of propellant to the architecture elements can achieve this price, then the use of propellant refueling would not be the optimal choice. It is unknown if this price can be realistically achieved. The development of a new low cost delivery system would likely be required to meet this price. It is unlikely that the cost could be achieved utilizing current architecture elements. Additional work is ongoing to determine the sensitivity of this price to the assumptions made in the development of the simulation environment. This will provide insight into the robustness of propellant re-fueling techniques. References 1
Stanley, D., et. al. Exploration Systems Architecture Study Final Report, Summer 2006.
2
Wilhite, A., Reeves, D., Stanley, D., Wagner, J., “Evaluating the Impacts of Mass Uncertainty on Future Exploration Architectures,” AIAA-2006-7250, AIAA Space 2006 Conference, San Jose, California, 2006
3
Smith, R.K., Seventy-Five Years of Inflight Re-fueling: Highlights, 1923-1998,
12
Air Force History and Museums Program, Washington, D.C., 1998. 4
Malone, B., Papay, M., “ModelCenter: An Integration Environment for Simulation Based Design,” Simulation
13