Absolute alignment of breathing states using image similarity derivatives K. Eck*, J. Bredno, T. Stehle Philips Research Laboratories, Weißhausstraße 2, 52076 Aachen, Germany
ABSTRACT The fusion of information in medical imaging relies on accurate registration of the image content coming often from different sources. One of the strongest influences on the movement of organs is the patient’s respiration. It is known, that respiration status can be measured by comparing the projection images of the chest. Since the diaphragm compresses the soft tissue above, the level of similarity to a reference projection image in extremely inhaled or exhaled status gives an indication of the patient’s respiration status. If the images to be registered are generated under different conditions the similarity with a common reference image is calculated on different scales and therefore cannot be compared directly. The proposed solution uses two reference images acquired in extremely inhaled and exhaled position. By comparing the images with two references and by combining the similarity results, changes in respiration depth between acquisitions can be detected. With normal breathing, the similarity to one of the reference images increases while the similarity to the other one decreases over time or vice versa. If the patient’s respiration exceeds the respiration span of the reference images, the similarity to both reference images decreases. By using not only the similarity values but also their derivatives over time, changes in respiration depth therefore can be detected and the image fusion algorithm can act accordingly e.g. by removing images that exceed the valid respiration span. Keywords: respiration phase, image alignment, registration, diaphragm
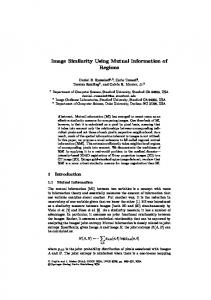
1. INTRODUCTION Images drawn from different sources that are acquired under different circumstances (e.g. regarding the x-ray dose) inherently differ in their characteristics, thereby making the direct comparison a difficult task. In some cases registration can be achieved by using methods that are robust against certain differences in the images characteristics (e.g. mutual information methods). In other cases, indirect registration methods are required that determine the status of the patient with regard to some parameters (e.g. heart contraction6 and the patient's respiration2) that influence the internal alignment of organs and other body parts and register the information based on the similarity of these parameters1. One of the strongest influences on the movement of organs is the patient’s respiration. Respiration can to a certain accuracy be measured with external sensors8 and alternatively by analysis of the projection images of the chest. Since the diaphragm compresses the soft tissue above during exhaling, the level of similarity to a reference projection image in extremely inhaled or exhaled status gives an indication of the patient’s respiration status3. For images from one source (with similar noise, contrast, and general imaging characteristics) the similarity results can serve as absolute values for the respiration status. If the images are generated under different conditions, the similarity with a common reference image is calculated on different scales and therefore cannot be directly used for mutual comparison. One method to cope with this is to normalize the similarity values to a common maximum and minimum similarity based on the assumption that the patient respiration depth does not change over time. The drawback of the approach is that 1. this approach is sensitive to intraprocedural changes that violate this assumption and that 2. such violations are not detected. This may result in unrecognized gross respiratory misregistrations as a consequence of a changing respiration depth. Figure 1 shows an example of the vertical position of the diaphragm of a patient over 240 images at 12.5 frames/s * E-mail:
[email protected], phone: +49 241 6003 679, fax: +49 241 6003 442
Medical Imaging 2005: Visualization, Image-Guided Procedures, and Display, edited by Robert L. Galloway, Jr., Kevin R. Cleary, Proc. of SPIE Vol. 5744 (SPIE, Bellingham, WA, 2005) · 1605-7422/05/$15 · doi: 10.1117/12.595313
79
acquisition rate. Obviously, the respiration span changes after the first 120 images for about two respiratory cycles and then slowly returns to the previous behavior. Position / pixel 50 Frame number 0 120
240
-50
Figure 1: Diaphragm position over time. Respiration is subject to the patient's will – the depth of respiratory intake may change over time as shown in this example.
As the diaphragm deforms the body during breathing, this deformation can be observed on x-ray images as slight changes of attenuation in the abdomen region. If lung or diaphragm is visible on the image area, the influence of respiration on the image is immediately visible, but even when neither of the two is visible, the diaphragm movement clearly changes the image content9,10. The results of Figure 1 were obtained by correlating a region of interest (ROI) containing the diaphragm border of each image of the sequence to the first image of the sequence. The vertical displacement with the highest normalized cross-correlation value (equation 1) is regarded as the shift of the patient's diaphragm.
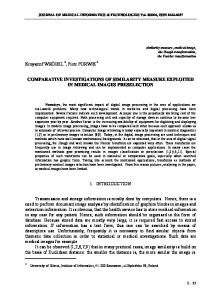
2. METHODS The influence of the diaphragm on the image is used to find image data with similar respiration status on two image sequences, one acquired with high dose, the other one acquired with low dose. In principle, this task can be done by: 1. choosing a sufficiently big region of interest (ROI) in the images that is strongly affected by the diaphragm motion and only little by other sources of movement like the heart's contraction, 2. comparing the ROI image content of the low-dose sequence with all images of the high-dose sequence, 3. selecting the high-dose image with the highest similarity as the matching information for the current low-dose image. This method of 'full comparison' therefore compares each incoming low-dose image to all high-dose images, which may be well in the numbers of 30 to 40 (Figure 2).
a)
b)
c)
Figure 2: For a low-dose image a), two example high-dose images b), c) are candidates for the full comparison method. Candidate b) shows the more similar position of the diaphragm and should therefore be chosen.
The maximum tolerable period for this is dictated by the latency and computation-time budget, e.g. for an acquisition rate of 12.5 frames/s the computation should be ended in less than 50 ms. A faster approach to the estimation of the patient's respiration status was chosen in the past5 to ensure the real time capability7 of the algorithm: Instead of comparing the low dose image to each of the high-dose images, all high-dose images a are first compared to a single reference image r selected from the set of high-dose images. This reference image typically is one showing an extreme respiration status of the patient, giving a respiration status value s for each of the high-dose images:
80
Proc. of SPIE Vol. 5744
sn =
∑ ∑
(rx − µ r ) ⋅ (a xn − µ an )
x∈R
(rx − µ r ) 2 ⋅
x∈R
∑
(a xn − µ an ) 2
,
(1)
x∈R
with R a region of interest in the images, n as the index numbering the images of the high-dose image sequence, µ r , µ a as the mean values of the ROI in the reference image and in the image to be compared. For each high-dose image, the normalized cross-correlation with the reference image is interpreted as a measure of the respiration status: the smaller the correlation value, the more distant the status is compared to the respiration status of the reference image. For images with similar correlation values consequently it is assumed that they have been acquired with the patient in similar respiration status. Each low-dose image is compared to the previously chosen reference image. The similarity of this low-dose image and the high-dose reference image gives an indication of the patient's respiration status at acquisition time. Since low-dose images and the high-dose images differ in their imaging characteristics, the similarity with the reference image is calculated on different scales and therefore the similarity values cannot be directly compared. One method to cope with this is to normalize the similarity values to a common maximum and minimum similarity based on the assumption that the patient's respiration depth does not change in between the acquisition of the high-dose and the low-dose sequence. 1
respiration status
0.9
0.8
0.7
frame 20
40
60
80
100
similarity value 1
0.9
0.8
0.7
frame 20
40
60
80
100
Figure 3: Example for the detection of respiration states that exceed the span given by the reference images. Top: true respiration status of the patient during acquisition of the low-dose sequence over image number. Bottom: similarity to each of the two extremely inhaled / extremly exhaled reference images over image number. The dashed boxes indicate areas where the derivatives of the similarity function have the same sign, indicating that the patient left the reference image respiration span.
Proc. of SPIE Vol. 5744
81
The drawback of the approach is that it is sensitive to differences in respiration span. While the influence of temporarily changes of the respiration depth during the acquisition of the low-dose images can be limited to a certain time window, systematic differences of high-dose sequence and the low-dose sequence respiration span produce systematic deviations and are not detected. This may result in unrecognized gross respiratory misregistrations as a consequence of a changing respiration depth. The combination of similarity value based choice of corresponding low-dose and high-dose images and of scaling the similarity values to common maximum and minimum values will be called 'one-reference method' in the following. An extension to the one-reference method uses two reference images in extremely inhaled and exhaled status drawn from the sequence of high-dose images. Each high-dose image is then compared to both, the extremely inhaled and extremely exhaled reference image. The respiration status is calculated by scaling the similarity results to a common maximum and minimum value for the inhaled and exhaled reference image and by averaging the (mirrored) respiration status values. Each incoming low-dose image again is compared with both reference images. The two similarity values are normalized so that their maximum and minimum values match those of the respective results of the similarity values of the high-dose images compared to the reference images and are averaged accordingly. This method will be called the 'two-reference method' in the following. The advantage of the two-reference method compared with the one-reference method is twofold: one the one hand, the influence of noise on the similarity results is reduced, on the other hand, the relationship of the estimated respiration status value and the heart's position is expected to be linearized (Figure 4). 2π
Respiration status
Respiration status
2π
0
0 0
Contraction status
2π
0
Contraction status
2π
Figure 4: Respiration-contraction state diagram for a high-dose sequence (sequence set 3 in Table 1 and Table 2). The vertical axis shows the respiration status from maximum inhaled (0) to maximum exhaled (2π), also the reference frame position in this case. The horizontal axis shows the heart contraction status interpolated from the patient's ECG. Left: respiration status calculated with the onereference method, each circle indicating the status of one high-dose image. Right: respiration status calculated with the two-reference method. The two-reference method distinguishes images of the opposite respiration state better than the one-reference method.
The analysis of the calculated similarity values for both reference images can be used to detect changes in the patient's respiration span. In Figure 3, this principle is illustrated with a high-dose sequence. It shows the (ground truth) respiration status of a patient as estimated from the correlation of diaphragm positions following equation (1) in the upper diagram4. Each circle represents one image; the dashed lines indicate the respiration span of the patient's first respiration cycle. The lower diagram of Figure 3 shows the similarity values that result from the correlation of the high-dose images with the two reference images that were chosen as the minimum and maximum intake images of the first respiration cycle. Here, each cross represents the similarity of an image to one of the reference images. Dashed horizontal lines indicate the minimum and maximum respiration status of the first cycle. By comparing the low-dose images with these two references (Figure 3, top) and by analyzing the similarity results, changes of the patient's respiration span (from exhaled to inhaled) are detected: With normal respiration, the similarity to one of the reference images increases while the similarity to the other one decreases over time and vice versa. If the patient’s respiration exceeds the respiration span of the high-dose sequence, the similarity to both reference images decreases (Figure 3, bottom, dashed boxed areas). An
82
Proc. of SPIE Vol. 5744
equal sign of the derivatives of the respective similarity functions indicates an exceeding respiration status while nonequal signs indicate the normal conditions (patient's respiration within the respiration span sensed in the high-dose recording) By using not only the similarity values but also their derivatives over time, changes in respiration depth therefore can be detected and the application can act accordingly by e.g. extrapolating the respiration status of the high-dose images. Thereby the robustness (by removing excessive respiration states) and the accuracy of the processing (usage of two reference images linearizes the dependency of similarity and respiration status) can be increased. The use of the similarity values to exclude images from the respiration status detection where the patient's respiration status exceeds that of the reference images will be called 'two-reference method with rejection' method.
3. RESULTS For a quantitative analysis of the described methods for respiration status estimation: a) the one-reference method, b) the two-reference method with rejection of outlyers and c) the method of full comparison with rejection of outlyers have been tested. Three sets of sequences have been used: each of the sets contains one high-dose sequence (set one: 77 images, set two: 62 images, set three: 70 images) and one low-dose sequence (set one: 200 images, set two: 166 images, set three: 240 images) respectively, both acquired with similar imaging geometry and table position. Though only part of the high-dose images are suitable to supply additional information to the low-dose images in the chosen sample sequences, all images of the sequences can be used for analysis of the respiration status algorithms since the estimation itself does not rely on the image content other than in the region of interest. Here, the contraction of the heart was not used as an additional parameter to concentrate on the analysis of the respiration status. For each of the three sequence pairs, the following steps have been performed: first from the high-dose sequences the images with extremely inhaled and exhaled respiration status (reference images) were identified. Then, all high-dose images are compared to the reference images using equation (1) on the region of interest. For the 'one-reference method', the calculated similarities are directly scaled for a range of 0…1. For the 'two-reference method with rejection' equation (1) is applied separately for each of the two reference images, the results are scaled to a range of 0…1 and 1…0 respectively and subsequently are averaged. Low-dose images are regarded as exceeding the respiration span of the high-dose sequences if the differential quotient of the similarity to the two reference images has equal sign. A value of d n in equation (2) equal to 1
d n = sign (r ′ n − r ′ ( n−1) ) ⋅ (r n − r ( n−1) )
(2)
(with r ′ n denotes the similarity of low-dose image n to the second reference image according to equation (1)) indicates that the low-dose image n is outside the respiration span of the patient during the high-dose sequence acquisition.
One-reference method Two-reference method with rejection Full comparison with rejection
Sequence set 1 Mean Stddev -4.20 16.94 -1.29 11.03
Sequence set 2 Mean Stddev -0.141 19.68 1.45 19.89
Sequence set 3 Mean Stddev 2.62 13.98 0.61 7.01
-0.13
-0.55
1.27
0.74
1.95
2.04
Table 1: Mean and standard deviation of the residual difference of the diaphragm position of high-dose images and low-dose images for three different methods of respiration status detection: one-reference method, two-reference method with rejection of low-dose images that exceed the respiration span of the high-dose image sequence and choice of matching high-dose image by full comparison of the low-dose image to all high-dose images of the set.
The 'full comparison with rejection' method uses equation (1) not only to calculate the similarity to the reference images but furthermore to calculate the similarity to all images of the high-dose sequence of the respective set. This method is computationally more expensive than the other two methods since instead of one or two correlation of ROIs, it uses 60, 70 or 77 correlations to identify the best-fitting high-dose image.
Proc. of SPIE Vol. 5744
83
For all three sequence sets and all three methods, the mean deviation and variance of the difference of the low-dose images' respiration status to the status of the high-dose image of the closest respiration status was calculated (Table 1). This status difference was quantified by measuring the vertical displacement of the diaphragm border, which is visible in all images. It is observed that even with the one-reference method the respiration status estimation is nearly unbiased (maximum of 4.2 pixel in sequence set 1) while the standard variation of the estimation is high (minimum 13.98 pixel in sequence 3). This number of pixels equals a mean misestimation of about 2.3 mm. Stepping from the one-reference method on to the two-reference method, the estimation bias represented by the mean estimation value remains nearly unchanged while the distribution of estimation results improves (16.94 to 11.03, 13.98 to 7.01) or at least stays at similar level (19.68 to 19.89 in sequence set 2). A significant reduction of the standard deviation is achieved using the full comparison method with rejection: while the mean values still remain nearly unchanged and thereby unproblematic, the mean error is reduced to 0.74, 1.95 and 2.04 pixel respectively, which is near to the accuracacy of the chosen method of ground truth determination and thereby is at the upper limit of what can be achieved. To investigate whether the outlyer rejection or the improved status determination of the two-reference method is responsible for the improvements compared with the one-reference method, the rejection result was investigated in more detail (Table 2). For all three sequence sets, the number of low-dose images that exceed the respiration span of the high-dose have been visually determined to 56 in set one, 0 in set two and 42 in set three.
Frames in total Negatives Positives False positives False negatives True positives True negatives Sensitivity Specificity
Sequence set 1 200 158 42 15 25 17 143 0.405 0.905
Sequence set 2 166 166 0 1 0 0 165 0.994
Sequence set 3 240 184 56 3 4 52 181 0.928 0.984
Table 2: Number of images detected as exceeding the high-dose respiration span (positives) and detected as inside the respiration span (negatives) for three different sets of high-dose and low-dose sequences when using the two-reference method with rejection.
For set one, the rejection process resulted in 55 rejected images. While four images that were inside the respiration span of the high-dose sequence have been errerously been marked as rejected (false positives), three images that indeed were outside the respiration span of the high-dose sequence were not detected (false negatives). This gives a sensitivity of 0.928 and a specificity of 0.984 for sequence set one. The standard variation of the estimation result was found to improve from 16.94 to 11.03 pixel. In set two, no low-dose images that exceeded the respiration span of the high-dose sequence were present since the patient was under forced respiration. Here the two-reference method properly detected only one respiration status (probably caused by noise or by the imperfect sampling of the respiration during high-dose image acquisition) that is exceeding the respiration span of the high-dose sequence. Consequently, the outlyer rejection was not able to improve the estimation result. This result supports that the outlyer rejection is the main influence on the estimation result and that the improved robustness and noise-reduction aspects of the two-reference method is of minor importance. Set three shows an even better detection of images of exceeding respiration status (three false positives, four false negatives) resulting in an improvement of the standard deviation from 14 to about 7 pixel, which also supports the thesis that the improvement of the two-reference method is correlated to the accuraccy of the outlyer detection scheme.
84
Proc. of SPIE Vol. 5744
4. DISCUSSION The results presented in Table 1 and Table 2 allow a quantitative comparison of the three methods: one-reference method, two-reference method and full comparison. It is observed, that all three methods give an unbiased estimate of the respiration status as measured by the diaphragm position. Regarding the estimation precision, the one-reference method generally shows standard deviations of about 3 mm, which is a limiting factor for many applications of respiration status based analysis. It was found, that the two-reference method shows significant improvements (standard deviation ~ 1.5 mm) compared to the one-reference method especially in cases, where different respiration spans occur in the high-dose and the low-dose part of the sequence sets. This supports the assumption, that these improvements are based mainly on the improved alignment of the respiration span and the removal of respiration status outliers rather than on the noise-reduced status estimation as illustrated in Figure 4.
Figure 5: Sample images from sequence set three (left image) and sequence set two (right image). The white rectangle indicated the approximate ROI position. In sequence two, the contrasted vessels appear in the ROI, whereas in sequence three, they are located mostly outside the ROI.
The moderate estimation result on sequence set two may be caused by an unfortunate ROI placement. The region of interest, which is located at the lower border of the imaged area, typically is dominated by the diaphragm and contains only low to no time varying content. Figure 5 shows an image from such a sequence (set three) on the left side. Sequence set two (Figure 5, right) in contrast shows a region of interest, which is, regarding the similarity to a reference image, strongly influenced by the inflow of contrast agent. This may result in distorted respiration status values that do no longer represent the respiration status of the patient but his vessels contrast agent saturation11,12. Compared with both the one-reference method and the two-reference method, the method of full comparison of all highdose images with the incoming low-dose image shows clearly superior results regarding the estimation precision. The full comparison method reduces the standard deviation to about 0.3 mm. Nevertheless it should be kept in mind, that this method is computationally more expensive compared to the two-reference method by a factor of typically 20.
5. SUMMARY In this paper, three different methods of fast determination of the patient's respiration status from x-ray projection images have been described and quantitative results on their performance have been presented. The methods are applicable to all cases, where projection images with different characteristics have to be aligned. It was shown that the different respiration span of the patient during the acquisition of low-dose and high dose images is a significant source of respiration status estimation error. This error can be reduced by a factor of up to two using the new 'two-reference
Proc. of SPIE Vol. 5744
85
method with rejection'. The respiration status estimation can be further significantly improved if the low-dose images are no longer compared to reference images but if they are directly compared to all of the high-dose images. Using this method of full comparison, standard deviations of 0.3 mm can be obtained. The drawback of this method is that it requires a computational effort typically 20 times higher than the other two methods.
ACKNOWLEDGEMENTS We want to thank our colleagues from Philips Medical Systems for fruitful discussions and experimental support, especially G. Keesman, G. Gijsbers, P. Rongen and H. Stegehuis.
REFERENCES 1.
D. W. Ro, L. Axel, G.T. Herman, R.F. Leveen, "Computed masks in coronary subtraction angiography," IEEE Transaction on medical imaging 6(4):297-300, 1987 2. G. Shechter, C. Ozturk, j.R. Resar, E.R. McVeigh, "Free breathing respiratory motion of the heart measured from xray coronary angiograms," Proc. SPIE Conference on Medical Imaging: Physiology, Function and Structure from Medical Images, SPIE Vol. 5369, pp. 34-43, 2004 3. B. Martin-Leung, K. Eck, I. Stuke, J. Bredno, T. Aach. Mutual information based respiration detection. Proc. 17th International Congress on Computer Assisted Radiography and Surgery (CARS), pp. 1085-1092, London, June 2528 2003. Elsevier. 4. K. Eck, I. Wächter, J. Bredno, "Synthesis of angiographic images using iterative approximation", Image Processing, J. Michael Fitzpatrick, Milan Sonka edts., Proceeding of SPIE Vol. 5370, pp. 163-171, 2004 5. B. Martín-Leung, K. Eck, I. Stuke, J. Bredno, and T. Aach, "Mutual information based respiration detection," in Computer Assisted Radiology and Surgery (CARS 2003), H. U. Lemke and M. W. Vannier, eds., Exerpta Medica International Congress Series 1256, pp. 1085-1092, 2003. 6. I. Stuke, S. Mollus, A. Condurache, K. Eck, T. Aach, “Cardio dynamic subtraction angiography”, Proc. 2nd EMBSBMES Conf., pp. 915-916, 2002 7. J. Bredno, B. Martín-Leung, and K. Eck, “Software architecture for live enhancement of medical images,'' in Electronic Imaging / Real-Time Imaging, N. Kehtarnavaz and P. A. Laplante, eds., Proc. SPIE 5297, 2004, to appear. 8. S.S. Vedam, P.J. Keall, V.R. Kini, H. Moustafavi, H.P. Shukla, and R. Mohan, “Acquiring a four-dimensional computed tomography dataset using an external respiratory signal,” Phys. Med. Biol. 48, pp. 45-62, 2003. 9. K. McLeish, D.L.G. Hill, D. Atkinson, J.M. Blackall, and R. Razavi, “A Study of the motion and deformation of the heart due to respiration,”, IEEE Trans. Med. Imag. 21(9), pp. 1142-50, 2002. 10. D. Manke, P. Rösch, K. Nehrke, P. Börnert, and O. Dössel, „Model evaluation and calibration for prospective respiratory motion correction in coronary MR angiography based on 3-D image registration,” IEEE Trans. Med. Imag. 21(9), pp. 1132-40, 2002. 11. M. Schrijver, Angiographic image analysis to assess the severity of coronary stenoses, Ph.D. Thesis, Twente University Press, Enschede (NL), 2002. 12. A. Condurache, K. Eck, J. Bredno, and T. Aach, "Statistical-model based identification of complete vessel-tree frames in coronary angiograms," in Electronic Imaging: Computational Imaging, C. A. Bouman and E. L. Miller, eds., Proc. SPIE 5299, 2004, to appear.
86
Proc. of SPIE Vol. 5744